


Sometimes, a performance problem appears rather suddenly. One day, performance is reasonable but the next, operations are much slower. This can sometimes be caused by a change in behavior in the database layer. Oracle, for example, may change execution plans for SQL statements after updating statistics. In this article, I'll look at why that happens with Oracle, and how you can detect and fix sub-optimal execution plans.
This will not be an exhaustive treatment of the topic, but I will focus on some of the common problems that I've seen with Oracle and the CLM applications. I'll provide links to Oracle documentation for those of you who want to learn more.
Let's start with a little background on how SQL statements are handled.
Here is some sample output from dbms_xplan.display_cursor: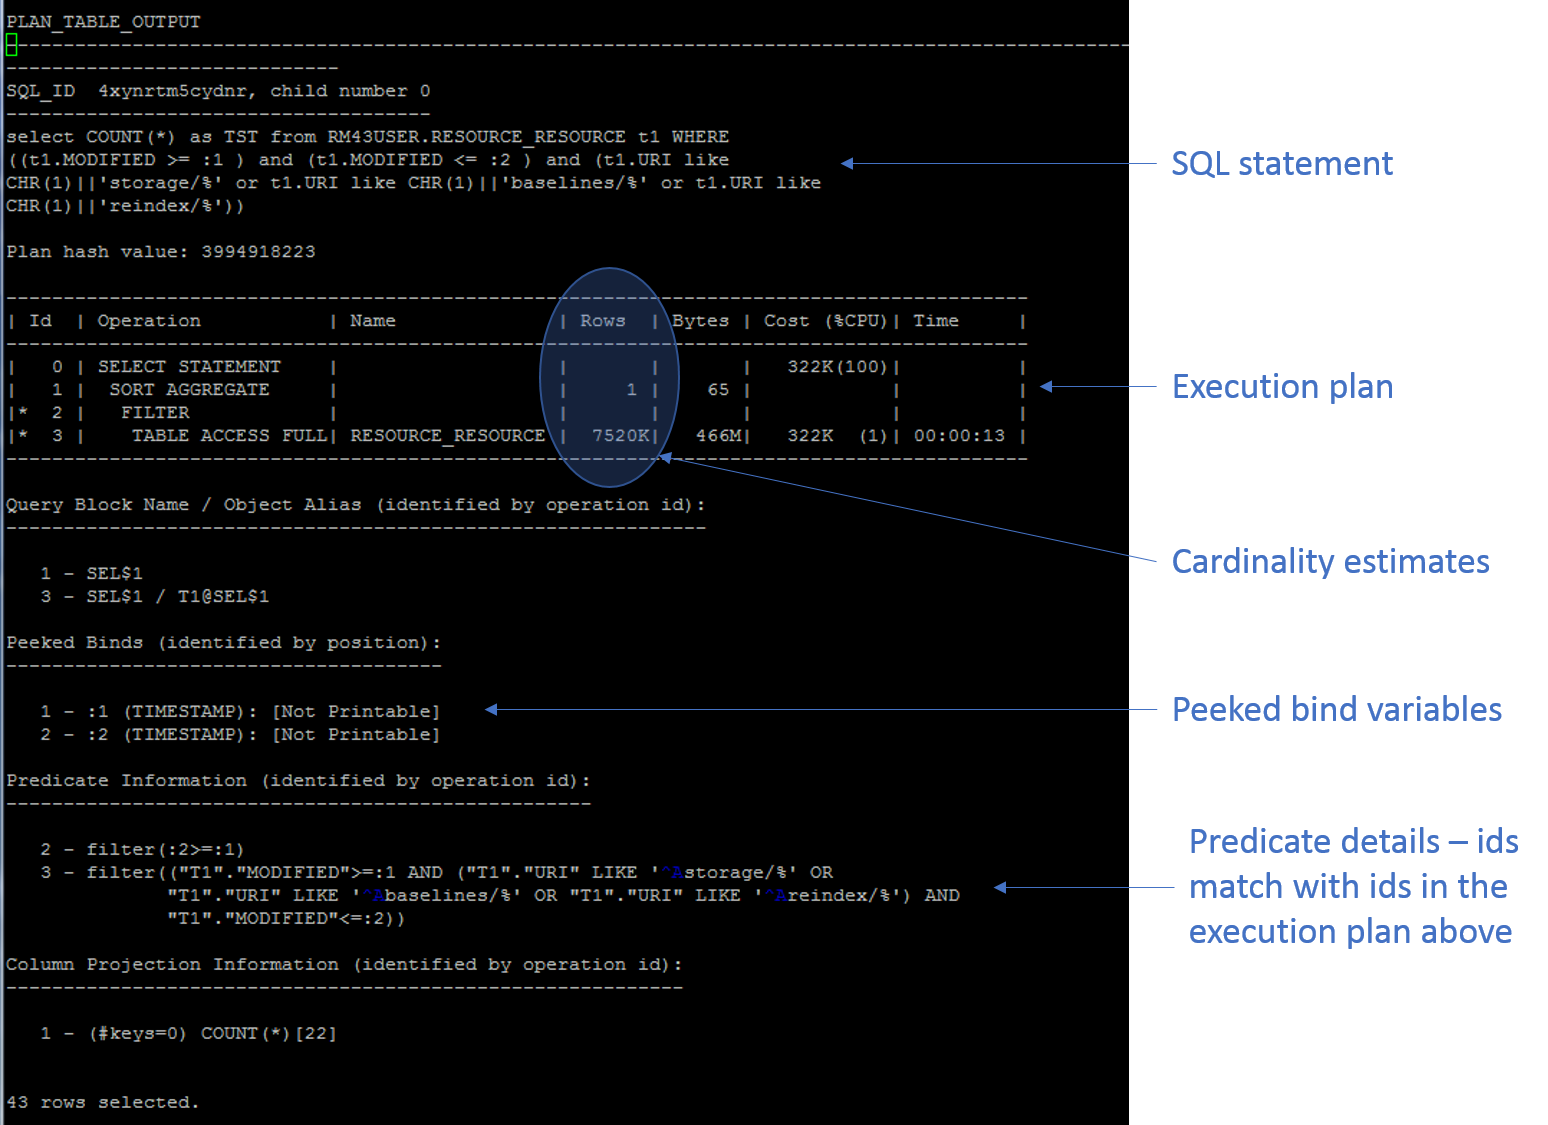 There is one more thing you can do with dbms_xplan.display_cursor, but you can't use bind variables for this. If you add a gather_plan_statistics hint to a SQL statement, you can get more information about the estimated and actual rows, like so:
 For more information on how to read execution plans, refer to the Oracle documentation.
 This is less useful if you have SQL with bind variables. You can get EXPLAIN output if you use SQL with bind variables, but there won't be values for the optimizer to peek at, so the execution plan might not be the same as what Oracle will actually use. That's why I recommend using dbms_xplan.display_cursor instead when analyzing SQL with bind variables.
What's a SQL execution plan?
An execution plan is the series of steps that Oracle uses when executing a SQL statement. This covers the specific indexes, if any, that will be used plus other activities like sorts and joins. When you execute a statement for the first time, Oracle will parse it and then the Oracle optimizer will analyze the statement to find the lowest cost way of executing the statement. The optimizer will use the statistics available on the table, and will make guesses as to the number of rows that are likely to be returned by any step in the execution plan. The number of rows returned by a given step is called the cardinality. Once the parsing is completed, the execution plan is then cached; future requests to execute the statement will use the cached execution plan. As you can probably guess, the algorithms used by the Optimizer are quite sophisticated, and they evolve with each release of Oracle. But the algorithms are not perfect, because in the end, they are making guesses about the cardinality of each step, and these guesses are not always correct for every workload. And so, there are many Oracle features that are intended to deal with this problem. Some features (like SQL profiles) ensure plan stability. Others (histograms, SQL plan directives, adaptive plans) improve cardinality estimates or react to bad cardinality predictions.Bind variables
Bind variables are a way of parameterizing SQL statements. An application can supply values for the bind variables at run time. One advantage to bind variables is that they allow Oracle to reuse the cached execution plans. If you use literals, then the following two statements would viewed as different, and each would be parsed separately.SELECT ITEM_ID from RESOURCE_RESOURCE WHERE ARCHIVED = '0' SELECT ITEM_ID from RESOURCE_RESOURCE WHERE ARCHIVED = '1'But if you use a bind variable, then Oracle only needs to parse the statement once, and it can use the cached execution plan even if the value of the bind variable changes. The statement below includes a bind variable (:1).
SELECT ITEM_ID from RESOURCE_RESOURCE WHERE ARCHIVED = :1So, how does the optimizer decide on an execution plan when the SQL only specifies a placeholder for a value? It uses bind variable peeking - when the statement is parsed, Oracle will peak at the values of any bind variables and use those values to improve its cardinality estimates.
Histograms
A histogram is a type of column statistic that provides more detailed information about the data distribution in a table column. If the distribution of values is skewed, then a histogram can help the optimizer improve its cardinality estimates. For example, in statement below, the ARCHIVED column can have only two values: 1 or 0, to represent whether a resource has been archived or not:SELECT ITEM_ID from RESOURCE_RESOURCE WHERE ARCHIVED = :1But most resources are not archived. So Oracle might initially start by incorrectly assuming that the values are equally distributed. It would assume that the cardinality of "WHERE ARCHIVED = :1" would be the total number of rows divided by the number of distinct values. So, if we have 1,000,000 resources, the first estimate would be that 500,000 rows would be returned. In that case, the optimizer might decide that a full table scan is the best execution plan. But if 95% of the resources are not archived, then the cardinality of "WHERE ARCHIVED = :1" would be 50,000 when selecting for ARCHIVED = '1' and 950,000 when selecting for ARCHIVED = '0'. A histogram will tell the optimizer about the frequency of different values, and so the optimizer can get a better cardinality estimate if it knows what value of ARCHIVED you are selecting for. There are several different kinds of histograms. Oracle will decide which histograms are needed when running DBMS_STATS (if the METHOD_OPT parameter for a table is set to the default of "SIZE AUTO").
How do statements become slow?
It is not unusual for SQL statements to become slow. If you Google for "Oracle SQL plan stability", you'll find a number of articles on why it happens and what to do about it. And in fact, there are many features in Oracle to help you deal with that. Here I'll look at some of the common problems I've encountered with CLM applications and Oracle.Bind variable peeking
If the number of rows returned by a SQL statement is sensitive to the values of the bind variables, then bind variable peeking can create a sub-optimal execution plan. Let's use the following statement as an example:select COUNT(*) from RM1USER.RESOURCE_RESOURCE t1 where ((t1.MODIFIED >= :1 ) and (t1.MODIFIED <= :2 ) and (t1.URI like 'storage/%' or t1.URI like 'baselines/%' or t1.URI like 'reindex/%'));This statement has two bind variables: a start time and an end time. Let's say that the first time the application executes this statement, it uses a wide date range, and so the statement returns over 1,000,000 rows. As the statement is compiled, the optimizer peeks at the bind variables and notices the cardinality is high, and so it selects a full table scan as the best way to execute the statement. And this execution plan is cached and will be used if this statement is executed again. Now let's say the code executes this statement again but this time with a narrow time range, and only a few rows are returned. Unfortunately, the cached execution plan involves a full table scan, and so this statement will perform poorly. A full table scan is not optimal if this statement returns a small number of rows - an index scan against the index on the MODIFIED column is a better choice. The poor performance will persist until the execution plan is updated. This could take some time - the statement might need to age out of the cache first. Or, in Oracle 12c, the optimizer might notice the cardinality mis-estimate and the new adaptive plan features can come intoplay. Adaptive cursor sharing is a feature which allows Oracle to select execution plans based on the values of bind variables. This is another source of execution plan instability.
Histograms
Another reason that Oracle might choose bad execution plans is histograms.Histograms and bind variable peeking
When a bind variable is used, then the optimizer will peek at the bind variable when creating the execution plan. If there is a histogram available for a column, the cardinality estimate will use the peeked bind value in conjuction with the histogram. Since the histogram was created because Oracle detected skewed data, the cardinality estimates are going to be sensitive to the peeked value. You are likely to get different execution plans if the value of the peeked variable occurs at a low frequency vs. a high frequency. Performance can be dramatically different when using a high frequency value with a plan generated assuming a low frequency value (and vice versa). This is another area where adaptive cursor sharing may come into play.Histograms and VARCHAR columns
Oracle has a limitation when generating histograms on VARCHAR columns. In Oracle 11g, it will only look at the first 32 characters of the column values. In Oracle 12c, it will only look at the first 64 characters. That means if the values in the VARCHAR column are not unique in the first 32/64 characters, then the resulting histogram will map all of the values into a single bin. Oracle may then decide that a full table scan is the best execution plan, since it would assume that any WHERE clause will select all of the values. There are some columns in the CLM tables which contain URLs and these are often not unique in the first 32/64 characters (especially for longer host names). We have recommended deleting and disabling histograms for those columns (see http://www-01.ibm.com/support/docview.wss?uid=swg21975746 ). In Oracle 12c (and in some versions of Oracle 11g), this behavior improved because Oracle would also look at the number of distinct values in the column as a way to check the accuracy of the histogram. It would use 1/(Number of distinct values) to predict the cardinality rather than use a histogram with a small number of bins. In other words, if all of the column values are mapped into one histogram bin, but the number of distinct values is more than 1, then the histogram isn't accurate and Oracle will use 1/NDV as the cardinality.Histograms generated inappropriately
Oracle will sometimes create a histogram on a timestamp column. Imagine a MODIFIED date column which ends up having duplicate timestamps during a period of high activity (such as when importing data). Oracle might think the values are skewed because of the duplicates, and then try to divide up the timestamps into ranges. This becomes less effective as a system ages. The range of MODIFIED timestamps becomes large for systems that have been in production for years, which makes the cardinality predictions inaccurate. I have seen cases where Oracle created a histogram on a column which contained all unique values. For equality predicates, the cardinality for such a column would be 1/(number of distinct values) and so a histogram would be useless. I suspect the histogram was created because of queries involving LIKE clauses and wildcards. Oracle might have detected skew because "LIKE 'string%' returned more results than predicted by 1/NDV. This is speculation because I haven't found any documentation of the impact of LIKE on histogram generation.Out-of-date statistics
The accuracy of the Oracle optimizer does depend on having current statistics. If you are updating statistics daily, that would normally be frequent enough to avoid problems. There are a few exceptions, however. If you are importing (or creating) artifacts at an unusually high rate, you should consider updating statistics immediately after the import. One example of why this matters is the MODIFIED date column I mentioned earlier. If you import a large number of artifacts, their MODIFIED date values will be later than the last value that the optimizer knows about. From the optimizer's perspective, queries against these new artifacts are for dates in the future. So it has to predict cardinality based on past creation rates, and this is likely to be an underestimate. If you are upgrading to a new release, you should consider updating statistics at least once partway through the upgrade. When an upgrade adds new tables, those tables start out empty. The cardinality of queries is 0 initially, and that can lead to poor choices. Updating the statistics partway through the upgrade gives the optimizer better information.Understanding slow SQL statements
When trying to understand slow SQL, the first step is to get information about the execution plan for the statement. Let's look at a few ways to do that.Explaining execution plans for cached statements
You can get the execution plan that Oracle used for a specific statement from the cursor cache. This is the best place to start, because the execution plan in the cursor cache accounts for the values of bind variables. If you use "EXPLAIN PLAN FOR", you may get a different execution plan (see the discussion in the next section).
SELECT * FROM table(dbms_xplan.display_cursor('sql id', NULL, 'all +peeked_binds'));
To run this, you first to find the SQL id for the statement of interest. You can do that by looking in v$sqlarea:
select sql_id, sql_text as sq from v$sqlarea where sql_text LIKE '%RESOURCE_RESOURCE%' order by sql_text;The more specific you can make the filtering on sql_text, the easier it will be to find the SQL statement you want to analyze. Note that the sql id is a hash generated from the SQL statement, so it stays stable over the lifetime of the database (until upgrading Oracle, anyway).
Here is some sample output from dbms_xplan.display_cursor:
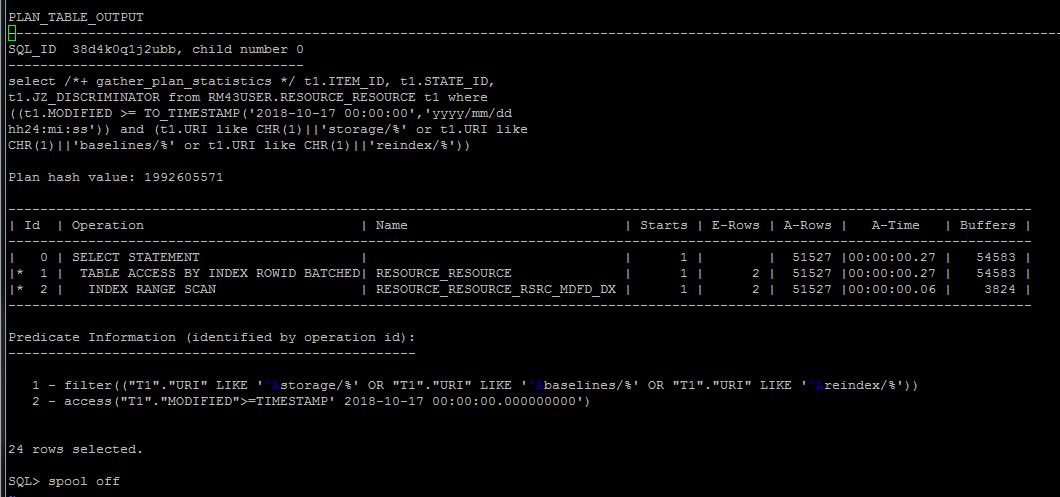
There is one more thing you can do with dbms_xplan.display_cursor, but you can't use bind variables for this. If you add a gather_plan_statistics hint to a SQL statement, you can get more information about the estimated and actual rows, like so:
select /*+ gather_plan_statistics */ t1.ITEM_ID, t1.STATE_ID, t1.JZ_DISCRIMINATOR from RM43USER.RESOURCE_RESOURCE t1 where
        ((t1.MODIFIED >= TO_TIMESTAMP('2018-10-17 00:00:00','yyyy/mm/dd hh24:mi:ss'))
        and (t1.URI like CHR(1)||'storage/%' or t1.URI like CHR(1)||'baselines/%' or t1.URI like CHR(1)||'reindex/%')) ;

SELECT * FROM table(dbms_xplan.display_cursor(format=>'allstats last'));
The output from this would be similar to the screenshot below. Now the report includes columns for both the estimated (E-Rows) and actual (A-Rows) cardinality of each step. A mismatch between the two estimates is a warning sign that the optimizer doesn't have good information.
For more information on how to read execution plans, refer to the Oracle documentation.
Using EXPLAIN PLAN FOR
You can also get execution plans by pre-pending "EXPLAIN PLAN FOR" to a SQL statement:
explain plan for select t1.ITEM_ID, t1.STATE_ID, t1.JZ_DISCRIMINATOR from RM43USER.RESOURCE_RESOURCE t1 where
         ((t1.MODIFIED >= TO_TIMESTAMP('2018-10-17 00:00:00','yyyy/mm/dd hh24:mi:ss'))
         and (t1.URI like CHR(1)||'storage/%' or t1.URI like CHR(1)||'baselines/%' or t1.URI like CHR(1)||'reindex/%')) ;

select PLAN_TABLE_OUTPUT FROM TABLE(DBMS_XPLAN.DISPLAY());
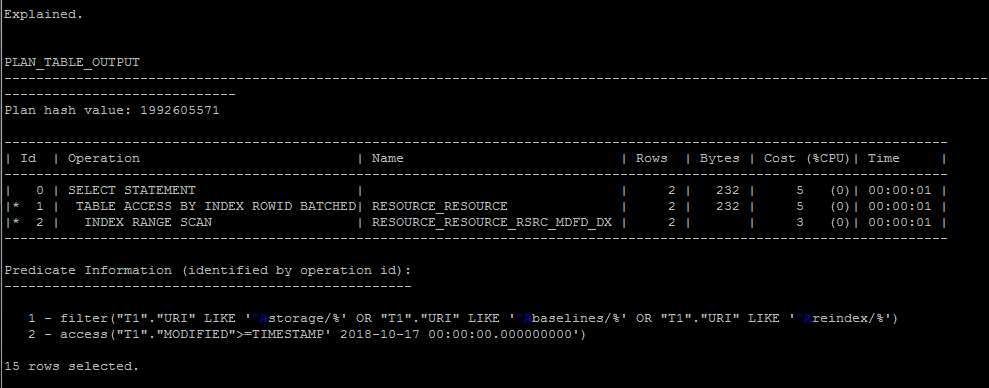
The output for the statements above on my test database is:
This is less useful if you have SQL with bind variables. You can get EXPLAIN output if you use SQL with bind variables, but there won't be values for the optimizer to peek at, so the execution plan might not be the same as what Oracle will actually use. That's why I recommend using dbms_xplan.display_cursor instead when analyzing SQL with bind variables.
Diagnosing histogram issues
If you suspect histograms are responsible for bad execution plans, there are a few ways to check on that. First, you can get a list of all columns for which histograms have been generated using the following command (change RM43USER to your schema name).SET LINESIZE 200 column table_name format a40 column column_name format a24 select table_name, column_name, histogram from all_tab_col_statistics where owner = 'RM43USER' and histogram != 'NONE' order by table_name, column_name;This will tell you which columns have a histogram, and what kind of histogram was generated for each column:
TABLE_NAME                               COLUMN_NAME              HISTOGRAM
---------------------------------------- ------------------------ ---------------
DIGNSTCTSTS_DGNSTC_TST_RSLT_TM           NODE_ID                  FREQUENCY
DIGNSTCTSTS_DGNSTC_TST_RSLT_TM           TEST_ID                  FREQUENCY
MARKERS_MARKER                           APPLICATION              FREQUENCY
MARKERS_MARKER                           CONTEXT_ID               FREQUENCY
MARKERS_MARKER                           PROJECT                  FREQUENCY
MARKERS_MARKER                           TYPE                     FREQUENCY
MARKERS_MARKER                           URI                      HYBRID
MARKERS_MARKER                           URI2                     FREQUENCY
MARKERS_MARKER                           USER_COL                 FREQUENCY
PROCESS_PROCESS_AREA                     ARCHIVED                 FREQUENCY
PROCESS_PROCESS_AREA                     JZ_DISCRIMINATOR         FREQUENCY
You can also get details on the distribution of values in the histogram by using the following SQL. Here, replace table_name and OWNER with values relevant to your environment. You may also want to add "column_name = 'yourcolumn'" to limit this to a single column.
column density format 9.999
select column_name, num_distinct, num_nulls, histogram, num_buckets, density, sample_size, notes from all_tab_col_statistics where table_name = 'RESOURCE_RESOURCE' and OWNER = 'RM43USER';
Oracle 12c introduces a new type of histogram called HYBRID. To look at the distribution of values for hybrid histograms, use a command like the following:
column endpoint_number format 999,999
column endpoint_actual_value a40
select endpoint_number, endpoint_actual_value, endpoint_repeat_count from all_tab_histograms where owner = 'RM43USER' and table_name = 'RESOURCE_RESOURCE' and COLUMN_NAME = 'URI' order by endpoint_number;
This output can be difficult to interpret. If you need more information, use the Oracle documentation. This is a good reference for Oracle 12c, release 1: https://docs.oracle.com/database/121/TGSQL/tgsql_histo.htm#TGSQL366
Optimizer tracing
If you can't figure out why Oracle is choosing a given plan, there is a way to get more details about the execution plans considered (and rejected) by the optimizer. Execute the following procedure (replace sql_id with the sql id you found previously:exec dbms_sqldiag.dump_trace(p_sql_id=>'sql_id',p_child_number=>0,p_component=>'Optimizer',p_file_id=>'MYSTMT');This will generate a TRC file on the Oracle server, in the diagnostic trace directory. The trace file would have MYSTMT in its name, given the options above. Use this only if you are desperate. It will be hard to wade through the TRC file, but you will get information about each of the indexes Oracle considered and its cost estimates for each one. This may give you a clue as to what went wrong. It is usually all about the cardinality estimates. You will also see information about the values of the peeked bind variables in the trace file, so that can be helpful.
Improving slow SQL statements
Disable histograms
If a histogram is leading to the selection of a poor execution plan, you can disable the collection of histogram statistics for a column. We recommend that for columns in the VVCMODEL_VERSION table, and describe how to do that in this technote: http://www-01.ibm.com/support/docview.wss?uid=swg21975746. The technique in that technote can be applied to other columns in other tables.Use SQL profiles and SQL plan baselines
A SQL profile can be generated for a statement to provide the optimizer with more information about the cardinality of the various parts of the statement. The cardinality adjustments in a profile are based on sampling a WHERE clause, rather than using estimates. A SQL plan baseline is a set of one or more accepted execution plans for a statement, so these can be used to stabilize an execution plan. Use the SQL tuning advisor to create and manage SQL profiles and baselines. https://docs.oracle.com/database/121/TGSQL/tgsql_sqltune.htm#TGSQL540 https://docs.oracle.com/database/121/TGSQL/tgsql_profiles.htm#TGSQL598Disable Oracle 12c adaptive features
If you have a system that is performing reasonably well (at least from a SQL perspective), then you may want to disable the adaptive features in Oracle 12c. These features can defer the selection of an execution plan to execution time. https://www.google.com/url?sa=t&rct=j&q=&esrc=s&source=web&cd=1&cad=rja&uact=8&ved=2ahUKEwj96v7y2preAhUDjq0KHdt2BYwQFjAAegQICBAC&url=https%3A%2F%2Fwww.oracle.com%2Ftechnetwork%2Fdatabase%2Fbi-datawarehousing%2Ftwp-optimizer-with-oracledb-12c-1963236.pdf&usg=AOvVaw2f_SoGFxOFXOLT5gMWFUIa Disable automatic profile accepting.Update statistics immediately after long imports
Related topics: Deployment web home, Deployment web home
External links:
https://oracle-base.com/articles/12c/adaptive-query-optimization-12cr1 http://www-01.ibm.com/support/docview.wss?uid=swg21975746 https://docs.oracle.com/database/121/TGSQL/tgsql_histo.htm#TGSQL366

| I | Attachment | Action | Size | Date | Who | Comment |
|---|---|---|---|---|---|---|
 png |
Plan1.png | manage | 413.4 K | 2018-10-22 - 20:36 | VaughnRokosz | |
| png |
Plan2.png | manage | 13.5 K | 2018-10-22 - 20:36 | VaughnRokosz | |
| png |
Plan3.png | manage | 36.8 K | 2018-10-22 - 20:36 | VaughnRokosz |


 Copyright © by IBM and non-IBM contributing authors. All material on this collaboration platform is the property of the contributing authors.
Contributions are governed by our Terms of Use. Please read the following disclaimer.
Dashboards and work items are no longer publicly available, so some links may be invalid. We now provide similar information through other means. Learn more here.