Lifecycle Query Engine 6.0 Performance Report for Query Scalability 
Authors: KeithWells Build basis: Lifecycle Query Engine 6.0
Introduction
This article presents the results of Lifecycle Query Engine (LQE) performance testing for the Rational Collaborative Lifecycle Managment (CLM) 6.0 release. JRS and LQE provide an integrated view of artifacts across data sources allowing the capability to generate reports across tools and project areas.
The Lifecycle Query Engine (LQE) implements a Linked Lifecycle Data Index over data provided by one or more lifecycle tools. A lifecycle tool makes its data available for indexing by exposing its Linked Lifecycle Data via a Tracked Resource Set, whose members MUST be retrievable resources with RDF representations, called Index Resources.
An LQE Index built from one or more Tracked Resource Sets allows SPARQL queries to be run against the RDF dataset that aggregates the RDF graphs of the Index Resources. This permits data from multiple lifecycle tools to be queried together, including cross-tool links between resources. Changes that happen to Index Resources in a lifecycle tool are made discoverable via the Tracked Resource Set's Change Log, allowing the changes to be propagated to the Lifecycle Index to keep it up to date.
JRS provides a Report Builder to guide users through the intricacies of building SPARQL ueries to view data in a report format. This article will show performance benchmarks from LQE tests providing guidance to customers in planning their LQE deployment and server configurations.
Disclaimer
The information in this document is distributed AS IS. The use of this information or the implementation of any of these techniques is a customer responsibility and depends on the customer’s ability to evaluate and integrate them into the customer’s operational environment. While each item may have been reviewed by IBM for accuracy in a specific situation, there is no guarantee that the same or similar results will be obtained elsewhere. Customers attempting to adapt these techniques to their own environments do so at their own risk. Any pointers in this publication to external Web sites are provided for convenience only and do not in any manner serve as an endorsement of these Web sites. Any performance data contained in this document was determined in a controlled environment, and therefore, the results that may be obtained in other operating environments may vary significantly. Users of this document should verify the applicable data for their specific environment.
Performance is based on measurements and projections using standard IBM benchmarks in a controlled environment. The actual throughput or performance that any user will experience will vary depending upon many factors, including considerations such as the amount of multi-programming in the user’s job stream, the I/O configuration, the storage configuration, and the workload processed. Therefore, no assurance can be given that an individual user will achieve results similar to those stated here.
This testing was done as a way to compare and characterize the differences in performance between different versions of the product. The results shown here should thus be looked at as a comparison of the contrasting performance between different versions, and not as an absolute benchmark of performance.
What Our Tests Measure
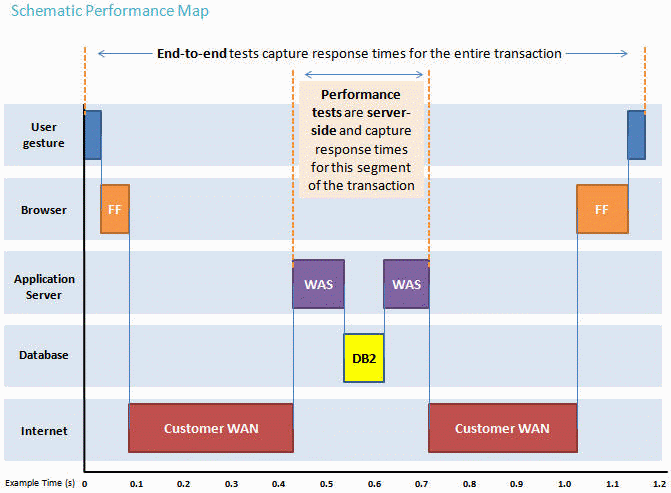
Automated tooling such as Apache Jmeter and Rational Performance Tester (RPT) are widely used to simulate a workload normally generated by client software such as the Eclipse client or web browsers. All response times listed are those measured by our automated tooling and not a client.The diagram below describes at a very high level which aspects of the entire end-to-end experience (human end-user to server and back again) that our performance tests simulate. The tests described in this article simulate a segment of the end-to-end transaction as indicated in the middle of the diagram. Performance tests are server-side and capture response times for this segment of the transaction.

Methodology
LQE used the JMeter performance measurement tool from Apache to simulate clients as JMeter Threads. Each user is represented by 1 JMeter thread. For these tests, the load is incremented by 50 threads (users) between 50 and 650 (or higher).The performance test models a dashboard refresh initiated by a user. When a user refreshes a dashboard, each widget that refreshes represents one or more queries which get executed in parallel.
Dashboard widgets can represent fast user-related queries, slower, larger scoped queries called report queries, or more encompassing project-level queries. In these tests, about 80% of the queries are classified as user-related queries, and the rest are report-based queries.
Each thread (user) refreshes their dashboard resulting in 6 or more queries executed at the same time. The total number of threads are ramped up over a period of 5 minutes. Then each thread will continue to refresh their dashboard 15 times with a think time of 80 seconds between refreshes.
Between concurrency tests there is 2.67 minute pause to allow the system to quiesce. Queries are tested against two different 100M triple datasets:
- Reslqe – the reslqe dataset is a generated dataset which was seeded by a real LQE indexTdb which had indexed 15 internal IBM RTC projects. The dataset was profiled and then increased in size to 100M triples by an internal data generator utility.
- SSE – The SSE dataset started as a RELM LQE indexTdb which was profiled and grown in size to 100M triples by an internal data generator utility.
The reslqe queries consisted of 8 queries: 2 report based queries and 6 user based queries.
| Run | Total Queries Executed |
|---|---|
| run_50 | 6000 |
| run_100 | 12000 |
| run_150 | 18000 |
| run_200 | 24000 |
| run_250 | 30000 |
| run_300 | 36000 |
| run_350 | 42000 |
| run_400 | 48000 |
| run_450 | 54000 |
| run_500 | 60000 |
| run_550 | 66000 |
| run_600 | 72000 |
| run_650 | 78000 |
The SSE queries consisted of 10 queries: 4 report based queries and 6 user based queries,
| Run | Total Queries Executed |
|---|---|
| run_50 | 7500 |
| run_100 | 15000 |
| run_150 | 22500 |
| run_200 | 30000 |
| run_250 | 37500 |
| run_300 | 45000 |
| run_350 | 52500 |
| run_400 | 60000 |
| run_450 | 67500 |
| run_500 | 75000 |
| run_550 | 82500 |
| run_600 | 90000 |
| run_650 | 97500 |
LQE Test Dataset Characteristics
| Condition | Reslqe | SSE |
|---|---|---|
| Size of the dataset on disk, on the LQE server | 22.2GB | 19.9GB |
| Number of resources | 3,050,000 | 4,953,453 |
| Number of triples | 99,389,595 | 99,919,403 |
Performance goals
The goal of this performance testing was to determine how many users LQE could support in a query-only based scenario when the users refreshed their dashboards throughout the day.Customer expectations for LQE query and indexing performance should be analyzed with attention to server hardware, dataset size, data model complexity, current system load, and query optimization.
- Larger indexes requires more RAM native memory.
- Heavier query loads should allocate more CPU cores.
- Indexing can perform faster with faster disk I/O.
These tests were performed on a Redhat 7.0 server system with 96GB RAM, 250 GB SSD, 2 Intel Xeon E7-2830 8-core 2133 MHz CPUs, 100M triple datasets are based on CLM resources, and a set of dashboard-like queries.
Topology
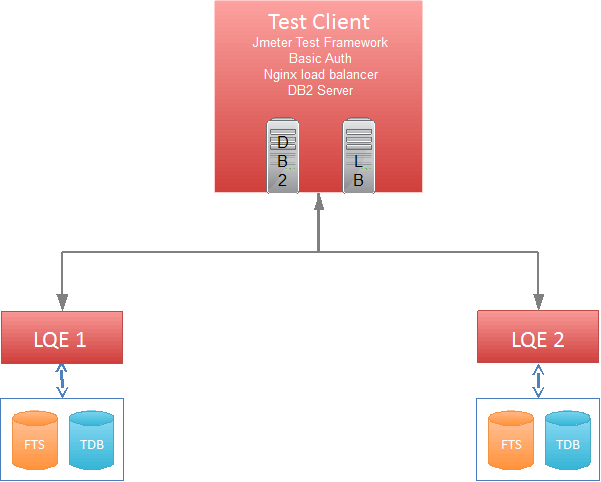
The topology under test is based on Standard Topology (E1) Enterprise - Distributed / Linux / DB2.

You can run several instances of Lifecycle Query Engine (LQE) and each instance must use the same external data source (in this case DB2). The group of LQE nodes behave like a single logical unit. By deploying LQE across a set of servers, you can distribute the query workload and improve performance and scalability. Each LQE node contains its own independent triple store index, which indexes the same tracked resource set (TRS) data providers that you specified on the LQE Administration page.
The specifications of machines under test are listed in the table below. Server tuning details are listed in Appendix A
| Role | Model | Processor Type | Number of Processors | Memory(GB) | Disk | Disk Capacity | OS |
|---|---|---|---|---|---|---|---|
| LQE 1 Server | IBM X3690-X5 | 2 x Intel Xeon E7-2830 8 core 2.13GHz | 32 vCPU | 96GB | 400GB SSD 3 x 146 GB 15k RPM SAS RAID-0 4 x 500 GB 7200 RPM SAS Raid-5 | 2.78TB | Redhat Enterprise 7 .0 |
| LQE 2 Server | IBM X3690-X5 | 2 x Intel Xeon E7-2830 8 core 2133 MHz | 32 vCPU | 96 GB | 1 x 250GB SSD 4 x 300GBV SAS RAID-5 Configuration | 1300GB | Redhat Enterprise 7.0 |
| Test Framework/DB2 Server | IBM X3690-X5 | 2 x Intel Xeon E7-2830 8 core 2133 MHz | 32 vCPU | 96 GB | 1 x 250GB SSD 4 x 300GBV SAS RAID-5 Configuration | 1072GB | Windows Server 2008 R2 Enterprise |
Disks
For a larger configuration, the use of fibre attached SAN storage is recommended but not required. For LQE servers you should consider using SSD drives, but it depends whether your environment will easily support them.
Network Connectivity
There are several aspects to network connectivity for LQE:
* Connectivity between the LQE and a database server.
* Connectivity between the LQE server and the end users.
* Connectivity between the LQE server and data source provider servers.
* Connectivity between LQE and an authenticating server (e.g. JTS).
The recommendation for network connectivity is to minimize latency between the LQE application server and other servers (no more than 1-2 ms) and to have the servers located on the same subnet. When using external storage solutions, the recommendation is to minimize connectivity latencies, with the optimal configuration being fiber attached Storage Area Network (SAN) storage.
Results
The following results are based on LQE query performance with no active indexing.

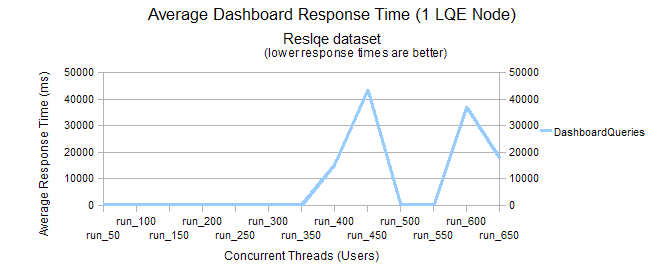
Illustration 1: Average Dashboard Response Time (1 LQE Node)
In illustration 1, the average dashboard response time exceeded 1 second with concurrent loads of 400, 450, 600 and 650 users. In this test, there was a think time of 80 secs between dashboard refreshes. When the refresh think time is expanded to 300 secs (5 mins) and the thread rampup period is increased, these spikes decrease and level out indicating that LQE will quiesce with higher loads when given the opportunity. It should also be noted that for all runs the average dashboard response time never exceeded 60 secs which most dashboard users would find acceptable. The spikes in this graph usually indicate contention of either network or Jena resources. Query throughput drops with high contention rates.

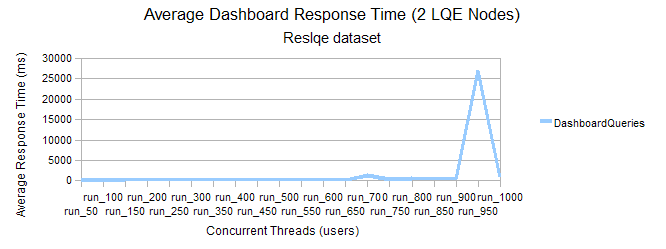
Illustration 2: Average Dashboard Response Time (2 LQE Node)
Illustration 2 shows the average dashboard response time for 2 LQE nodes with the same 100M triple index. The average dashboard response time exceeded 1 second at 950 concurrent users, yet remained less that 30 seconds up to 1000 concurrent users. As can be seen in illustrations 1 and 2, a two LQE node system can expand the query capacity in a system. In illustration 1 we see 1 LQE node supports 350 users with average dashboard response times less than 1 sec. Whereas 900 concurrent users in the 2 LQE node system are supported until contention issues begin. Also, in the 2 LQE node system the maximum time spent during any test run was 27 seconds as compared to 43 seconds for 1 LQE node. Using a load balancer to share queries across LQE nodes helps maintain query performance expectations to support almost twice as many users. Multi-node LQE systems share the burden in a high throughput query environment.
In previous performance test experiments, it was found that query performance can degrade when the index has about 100M triples or above, but this depends on resource shapes and size of resources.
Appendix A - Server Tuning Details
| Product | Version | Highlights for configurations under test |
|---|---|---|
| LQE | LQE 6.0 | LQE Configuration Changes: |
| On the Query Service Page, | ||
| * Set the Query Timeout(seconds) to 160 | ||
| * Enable HTTP Response Caching Enabled and | ||
| * Enable Query Result Caching Enabled | ||
| On the Permissions Page, | ||
| * Set “Everyone” as the group for the Lifecycle Query Engine Index. | ||
| On the Advanced Properties Page, show internal, | ||
| * Set the HTTP Connection Timeouts to 120 secs | ||
| * Set the HTTP Socket Timeouts to 120 secs | ||
| * Set "Maximum Number of Query Metrics" to “5000” | ||
| * Set "Metrics Maximum Age(ms)" to "604800000" (7 days) | ||
| * Set Metrics Scrubber Period (ms) to “32400000” (9 hrs) | ||
| * Set "Metrics Graph Count Period (seconds)" to "60000" (16.67 hrs) | ||
| Apache Tomcat | CLM packaged Version 7.0.54 | JVM settings: |
| GC policy, arguments, max and init heap sizes: | ||
| JAVA_OPTS="$JAVA_OPTS -Xmx16G" | ||
| JAVA_OPTS="$JAVA_OPTS -Xms4G" | ||
| JAVA_OPTS="$JAVA_OPTS -Xmn512M" | ||
| JAVA_OPTS="$JAVA_OPTS -Xgcpolicy:gencon" | ||
| JAVA_OPTS="$JAVA_OPTS -Xcompressedrefs -Xgc:preferredHeapBase=0x100000000" | ||
| JAVA_OPTS="$JAVA_OPTS -agentlib:healthcenter -Dcom.ibm.java.diagnostics.healthcenter.agent.port=1972" | ||
| JAVA_OPTS="$JAVA_OPTS -Dlqe.testDiscoverResourceGroups=true" | ||
| JAVA_OPTS="$JAVA_OPTS -Dlqe.performance.test=true" | ||
| Linux Settings: | ||
| Set Linux scaling governor to “performance” -- for CPUFREQ in /sys/devices/system/cpu/cpu*/cpufreq/scaling_governor; do [ -f $CPUFREQ ] continue; echo -n performance > $CPUFREQ; done | ||
| DB2 | DB2 v10.5.300.128 | Transaction log setting of LQE Database: |
| * Transaction log size changed to 8192: db2 update db cfg using LOGFILSIZ 8192 | ||
| * Transaction log primary file number to 24: db2 update db cfg using LOGPRIMARY 24 | ||
| * Transaction log secondary file number to 24: db2 update db cfg using LOGSECOND 24 | ||
| Network | Shared subnet within test lab |
Appendix B – Considerations
* Generally, the smaller the index the faster queries will perform* Plan ahead, add more RAM as the indexTdb size increases
When performance expectations start to deteriorate, or when queries start to time out you should investigate the following:
* Is compaction of the indexTdb required?
* Is there a rogue query? ( a rogue query is a query that is not being timed out as it should be)
A rogue query can be detected by navigating to the LQE UI Health Monitoring page:
* Select Statistics
* Select View As List (in the upper right hand side)
* Select Running Queries tab to identify any queries which may not have timed out
* Has the IndexTdb grown to surpass the server hardware capacities such as the allocated RAM?
* Is the system under too high a load? If queries are continuous, indexing may not have enough opportunity to write to the index.
* Queries which are run frequently and that take longer than 1 second to execute should be optimized.
* Query performance might decrease when more than 3000 results are returned. (ie 150,000 results may take more time)
* The query timeout is set to 60 seconds as a default: If queries are taking longer, increase the query timeout time on the Query Services page, or analyze the system for other possible concerns such as those listed above.
* Do not copy an indexTdb directory when the LQE server is active.
Additional contributors: TWikiUser, TWikiUser
| I | Attachment | Action | Size | Date | Who | Comment |
|---|---|---|---|---|---|---|
| |
Results-1-LQE-Node.png | manage | 10.5 K | 2015-08-03 - 13:01 | UnknownUser | |
| |
Results-2-LQE-Node.png | manage | 9.5 K | 2015-08-03 - 13:06 | UnknownUser | |
| |
TestDisclaimer.gif | manage | 40.1 K | 2015-06-15 - 13:23 | UnknownUser | |
| |
Topology.png | manage | 13.3 K | 2015-07-13 - 12:46 | UnknownUser |
-
 Deployment web
-
 Planning and design
-
 Installing and upgrading
-
 Migrating and evolving
-
 Integrating
-
 Administering
-
 Monitoring
-
 Troubleshooting
Status icon key:
-
 To do
To do
-
 Under construction
-
 New
New
-
 Updated
-
 Constant change
- None - stable page
- Smaller versions of status icons for inline text:
-


Contributions are governed by our Terms of Use. Please read the following disclaimer.
Dashboards and work items are no longer publicly available, so some links may be invalid. We now provide similar information through other means. Learn more here.

