JTSMon - Seeing what your server is up to
Authors: VaughnRokoszBuild basis: Rational Team Concert 3.0.1.1 to 3.0.1.6+, 4.0.x, 5.0.x
Starting in 6.0.3 and improved in 6.0.4 and 6.0.5, we introduced MBeans for monitoring the behavior of the system. This work has made JTSMon obsolete.
Disclaimer: JTSMon uses internal counters which are not guaranteed to behave the same across releases. JTSMon is provided as-is, with no support. You should not use JTSMon in production systems unless specifically directed to do so by IBM support. You should not use JTSMon to support business-critical operations.
As a Jazz administrator, have you ever wondered what your server is doing today that is different than last week or last month? Why it is that yesterday things were fine and today something seems a little sluggish first thing in the morning? Wouldn't it be really handy to see what exactly your growing user base is doing day by day and how that is changing over time as you add more users and projects?
Maybe you've already learned that the Jazz server has a web service report that provides a lot of performance and traffic data which seems like it should be really useful. But then you got lost trying to make sense of a one time snapshot of a seemingly infinite list of obscure operations, unsure which ones might matter to you if any?
JTSMon (Jazz Team Server Monitor) is a new tool that will help you make more sense out of all those numbers by taking a series of snapshots and turning them into spreadsheets so you can sort, filter, recombine, and graph the data to actually see what sort of traffic is hitting your server day by day and week by week. It provides a command line utility that automatically takes web service counter snapshots from one or more Jazz application servers over time then analyzes the data to produce time-trend tables that provide new insight into server traffic and usage patterns.
To see what JTSMon might do for you, let's take a look at what web services are and then we'll see what JTSMon can do with them.
For those who want to get right to it, download JTSMon here.
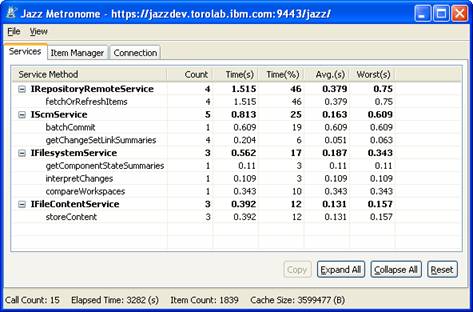
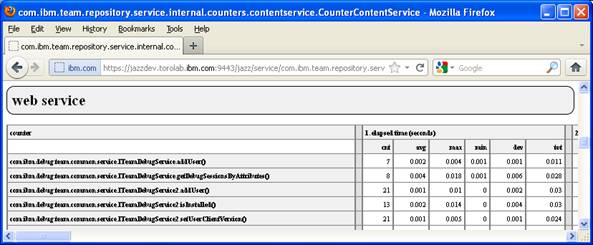 Using Metronome to make sense of the server reports has some limits. The server is accumulating data from many clients and the webservices may be used in different ways for different user operations. Also keep in mind that the web service reports only show how much time the server required to perform the operation. Metronome data also includes the round-trip time between the client and server. If the server time is relatively small, the difference between the two may represent excessive network latency, which may be causing perceived performance problems.
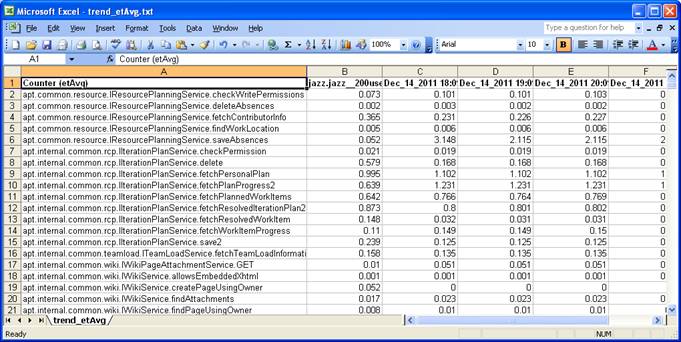 With a little spreadsheet manipulation the data can be sorted and filtered to isolate the information that is the most interesting and turned into charts showing the most frequently called operations, those passing the most data, or those consuming the most server time.
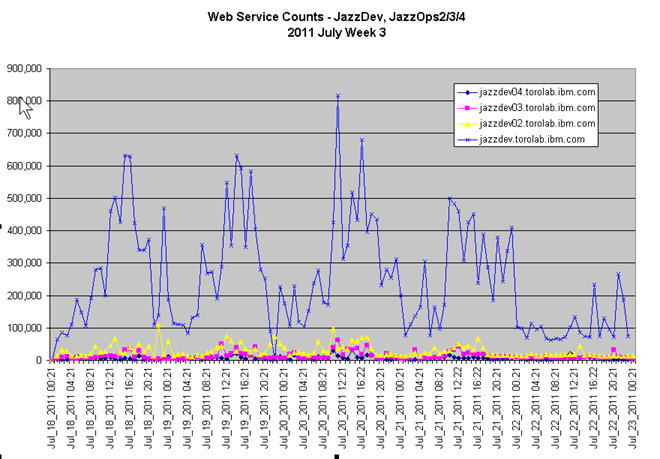
JTSMon produces data tables to show total traffic over multiple servers or applications allowing you to see the traffic patterns over days and weeks...
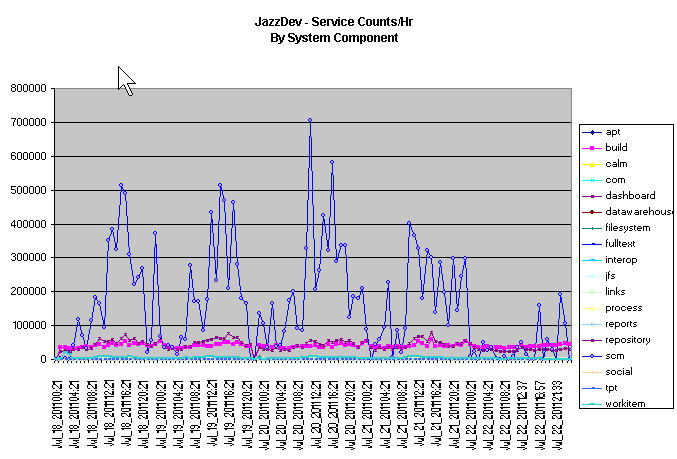
 Or the data can be aggregated by system component to see 500+ webservices consolidated to 10-20 major subsystems so you can see the site profile showing the balance of demand for builds, workitems, dashboards, and SCM operations.
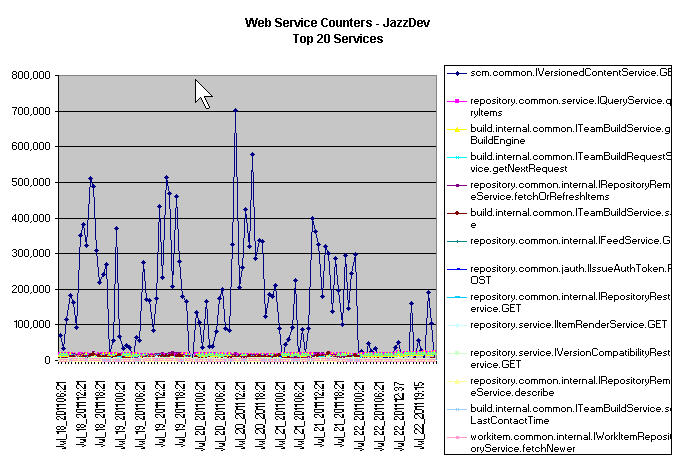
 Or you can drill in by individual webservice to focus on the top 20 or 50 most frequently used services. In this case we can now see that a single webservice (IVersionedContentService.GET (download a file)) is the most frequently called operation in a SCM heavy environment like Jazzdev.
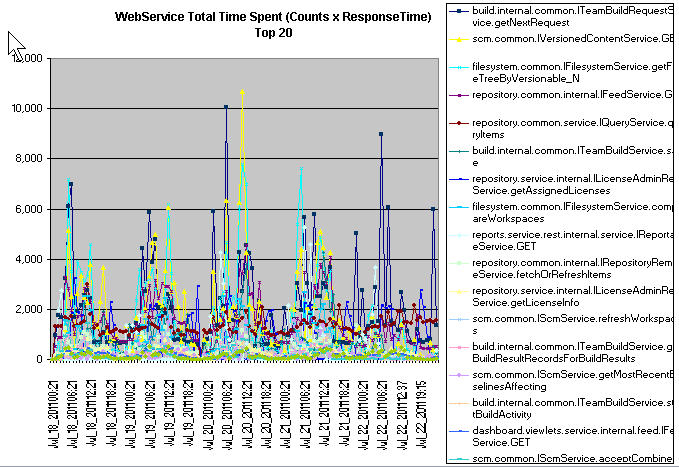
 JTSMon slices out not only counts and average times but also total times which can paint a very different picture than call counts by themselves.
What is a Web Service?
A web service is a low level individual message sent from a Jazz client or web browser to the Jazz server to do something or get data. Multiple web services are often needed to carry out an individual user operation such as logging in, checking in a change set, updating a work item, or downloading files to refresh your workspace. The best way to understand what web services do and how they are used is to enable the Metronome feature on the RTC Eclipse client which tracks and reports on what web services have been executed by your individual RTC or CLM client. The Metronome report will show you the web service traffic generated by whatever client operation you do such as checking in a few files. For more information take a look at the Jazz metronome tool keeps us honest topic.
Finding out what Web Services the server is performing
The Jazz server maintains web service reports that show the overall traffic to a server from all the different clients and provides a wealth of information about historical traffic and performance. The basic report is available to any valid user by visiting the following URL on the target server:https://<yourhost>:9443/<app>/service/com.ibm.team.repository.service.internal.counters.ICounterContentServiceThe webservice report provides a number of different data tables representing server performance since startup. Many will only make sense to internal developers in the context of detailed system knowledge but there are several that are potentially quite useful:
- Webservice counters - external webservice requests made to the server since its started
- Asynchronous tasks - background processing tasks providing maintenance, integration, and followup operations
- Floating license usage, showing which licenses are actively in use. WARNING: In the 4.0.6 release, the behavior of the license counters has changed. The counters are now reset whenever the license ETLs run.
 Using Metronome to make sense of the server reports has some limits. The server is accumulating data from many clients and the webservices may be used in different ways for different user operations. Also keep in mind that the web service reports only show how much time the server required to perform the operation. Metronome data also includes the round-trip time between the client and server. If the server time is relatively small, the difference between the two may represent excessive network latency, which may be causing perceived performance problems.
Using JTSMon to visualize and make sense of Web Service counter reports
JTSMon records a series of web service reports then slices out specific variables to generate time-trend tables so you can see how the data is changing over time. Even then with 500+ webservices it can be overwhelming, so JTSMon aggregates the data at different scales to help to get the big picture across multiple applications or servers.- Overall totals for all servers or applications being monitored
- Component level totals based on the web service name (i.e. Build, SCM, Repository, Workitems, etc.)
- Individual web services covering elapsed time averages, counts, and total time bytes sent and bytes received.
 With a little spreadsheet manipulation the data can be sorted and filtered to isolate the information that is the most interesting and turned into charts showing the most frequently called operations, those passing the most data, or those consuming the most server time.
JTSMon produces data tables to show total traffic over multiple servers or applications allowing you to see the traffic patterns over days and weeks...
 Or the data can be aggregated by system component to see 500+ webservices consolidated to 10-20 major subsystems so you can see the site profile showing the balance of demand for builds, workitems, dashboards, and SCM operations.
 Or you can drill in by individual webservice to focus on the top 20 or 50 most frequently used services. In this case we can now see that a single webservice (IVersionedContentService.GET (download a file)) is the most frequently called operation in a SCM heavy environment like Jazzdev.
 JTSMon slices out not only counts and average times but also total times which can paint a very different picture than call counts by themselves.

Related topics:
External links:
- None
Deployment.JTSMonTool moved from Deployment.JazzMon on 2013-10-06 - 15:16 by Main.gcovell -
Contributions are governed by our Terms of Use. Please read the following disclaimer.
Dashboards and work items are no longer publicly available, so some links may be invalid. We now provide similar information through other means. Learn more here.