Enabling CLM Server Monitoring (DEPRECATED: CLM Server Monitoring is no longer supported and was dropped in version 6.0.3.)
Authors: BorisKuschelBuild basis: CLM 4.0.6+
By default, the CLM Server Monitoring feature is not enabled after installation. To enable the feature, you use JConsole. If you have not done so already, ensure that it is possible to connect with JConsole as described in Jazz monitoring through JMX.
Depending on what method was used to connect to JConsole, the configuration is located in slightly different information.
For WebSphere Application Server production systems, the WebSphere Application Server configuration should be followed; otherwise, follow the standard JTS Server Monitoring instructions.
In all the domains you want to enable for monitoring, navigate to this location:
Ensure that the parameters are correct. Specifically, ensure that the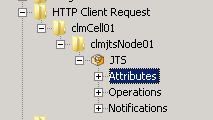
In all the domains to enable for monitoring, navigate to this location:
Ensure that the parameters are correct. Specifically, ensure that the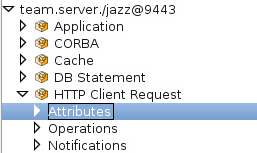
Enabling CLM Server Monitoring for WebSphere Application Server
When connecting with JConsole, one or more domains should be listed that correspond to the applications that are installed on WebSphere Application Server:
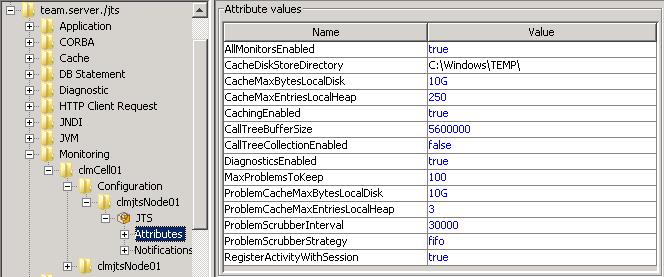
team.server.* > Monitoring > {WebSphere Application Server cell} > Configuration > {WebSphere Application Server node} > {WebSphere Application Server name} > Attributes
Ensure that the parameters are correct. Specifically, ensure that the
CacheDiskStoreDirectory contains enough space to accommodate both the CacheMaxBytesLocalDisk and ProblemCacheMaxBytesLocalDisk. This determines how much information is retained by the CLM Server Monitoring before being evicted.
To collect all user activities, not just those that are problems (this can be memory intensive), set RegisterActivitywithSession to true.
To turn on all monitors, set AllMonitorsEnabled to true and DiagnosticsEnabled to true.
To enable monitors on a monitor-by-monitor basis, you must navigate to each monitor. (AllMonitorsEnabled can be left false in this case.)
For each monitor, set Enabled to true to enable it. You can set the Threshold (the default is 10s, an L is required after the number when setting a new value, for example, 5000L for 5 seconds), which determines how long an execution should take before a problem is created and whether aggregates should be collected. Set RollupEnabled to true.
These attributes can be found in the monitors in these locations:
team.server.* > CORBA > {WebSphere Application Server cell} > {WebSphere Application Server node} > {WebSphere Application Server name} > Attributes
team.server.* > Cache > {WebSphere Application Server cell} > {WebSphere Application Server node} > {WebSphere Application Server name} > Attributes
team.server.* > DB Statement > {WebSphere Application Server cell} > {!WebSphere Application Server node} > {WebSphere Application Server name} > Attributes
team.server.* > HTTP Client Request > {WebSphere Application Server cell} > {WebSphere Application Server node} > {WebSphere Application Server name} > Attributes
team.server.* > Pool > {WebSphere Application Server cell} > {WebSphere Application Server node} > {WebSphere Application Server name} > Attributes
team.server.* > Request > {WebSphere Application Server cell} > {WebSphere Application Server node} > {WebSphere Application Server name} > Attributes
team.server.* > SPARQL > {WebSphere Application Server cell} > {WebSphere Application Server node} > {WebSphere Application Server name} > Attributes
team.server.* > Service > {WebSphere Application Server cell} > {WebSphere Application Server node} > {WebSphere Application Server name} > Attributes
Enabling CLM Server Monitoring
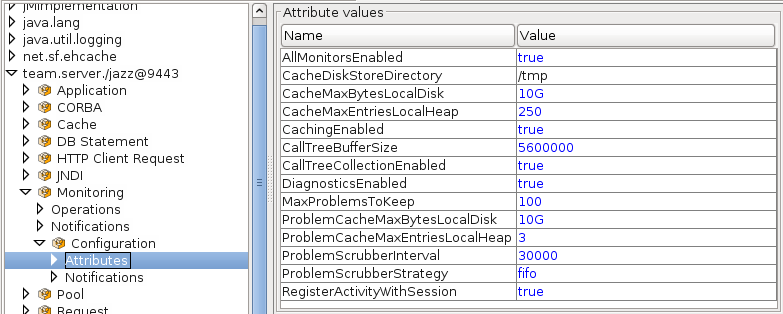
When you connect with JConsole, one or more domains should be listed that correspond to the applications installed on the application server.team.server.* > Monitoring > Configuration > Attributes
Ensure that the parameters are correct. Specifically, ensure that the
CacheDiskStoreDirectory contains enough space to accommodate both the CacheMaxBytesLocalDisk and ProblemCacheMaxBytesLocalDisk. This determines how much information is retained by the CLM Server Monitoring before being evicted.
To collect all user activities, not just those that are problems (this can be memory intensive), set RegisterActivitywithSession to true.
To turn on all monitors, set AllMonitorsEnabled to true and DiagnosticsEnabled to true.
To enable monitors on a monitor-by-monitor basis, you must navigate to each monitor (AllMonitorsEnabled can be left false in this case).
For each monitor, set Enabled to true to enable. You can set the Threshold (the default is 10s, an L is required after the number when setting a new value, for example, 5000L for 5 seconds), which determines how long an execution should take before a problem is created and whether aggregates should be collected. Set RollupEnabled to true.
These attributes can be found in the monitors in these locations:
team.server.* > CORBA > Attributes
team.server.* > Cache > Attributes
team.server.* > DB Statement > Attributes
team.server.* > HTTP Client Request > Attributes
team.server.* > Pool > Attributes
team.server.* > Request > Attributes
team.server.* > SPARQL > Attributes
team.server.* > Service > Attributes
Related topics: Deployment web home, Deployment web home
External links:
Additional contributors: TWikiUser, TWikiUser
Contributions are governed by our Terms of Use. Please read the following disclaimer.
Dashboards and work items are no longer publicly available, so some links may be invalid. We now provide similar information through other means. Learn more here.