


ETM Read Access Control (RAC) Performance Report
Authors: SameerkumarKalariaBuild basis: Engineering Test Management (ETM) 7.2
NOTE: This article is currently in draft state.
Page contents
- Introduction
- Key Findings
- Test Methodology
- Test Environment Details
- Performance Test Results
- Performance Limitations
- Additional Details on the Data Shape
- Appendix: Abbreviations and Terminology
- References
Introduction
For organizations who need team members—including external partners and suppliers—working together to manage the testing of complex systems in a coordinated manner while strictly complying with export control regulations such as the International Traffic in Arms Regulations (ITAR) and corporate data segmentation policies, Engineering Test Management (ETM) Read Access Control (RAC) using Team Areas is a major capability. Historically, the only mechanism to isolate sensitive test artifacts was to create completely separate ETM project areas for different teams. However, this isolation created operational silos and hindered collaboration scenarios—such as maintaining a master Test Plan that links to or references restricted Test Cases managed by specific partner teams. ETM Read Access Control provides granular visibility control within a single, non-configuration-enabled project area by associating read access permissions with Jazz Team Areas. Team members only see the test artifacts assigned to the team areas in which they hold membership (or child team areas thereof), while unauthorized users are prevented from viewing or querying restricted artifacts.Business Value
Read access control using team areas provides significant enterprise and operational benefits:- Export Regulation & ITAR Compliance: Enables strict compliance with export control laws and data segmentation mandates by enforcing strict data partitioning.
- Risk Mitigation: Prevents unauthorized read access and data leakage of confidential or classified test artifacts to suppliers or third-party collaborators.
- Unified Collaboration in Single Project Area: Eliminates project area duplication, enabling master test planning, unified dashboards, and cross-team test management within a single shared project area.
- Simplified Governance: Permissions are managed dynamically through team area membership, reducing administrative overhead.
- Full Auditability: Changes to read access control assignments on artifacts are tracked through standard artifact revision history.
Supported Test Artifacts
Read access control using team areas is supported across the core ETM artifact lifecycle:- Test Plan
- Test Case
- Test Suite
- Test Script
- Test Case Execution Record (TCER)
- Test Suite Execution Record (TSER)
- Test Case Result
- Test Suite Result
- Test Data
- Keyword
- Attachment
Architectural & Technical Overview
The ETM RAC feature leverages pre-existing Jazz Foundation (JAF) item-level read permission architecture:- Read Access Policy: In-scope ETM items utilize a
PROTECTEDread access policy at the repository level. - Read Access Context: Artifacts store a read access context reference pointing to the governing Team Area Item UUID. When an artifact is restricted to a Team Area, the Foundation access context is registered accordingly.
- SQL Access Right Filtering: When queries are executed against the relational database (Oracle / Db2), additional SQL filtering (incorporating Common Table Expressions / CTEs and subqueries) is dynamically applied to enforce process area and team area visibility for the executing user session.
- Transparent Security: Users without read permissions receive HTTP 404 (Not Found) responses upon direct URI access. In table browse views and query filters, unauthorized artifacts are filtered out of the result set without exposing metadata.
- Applicability Scope: RAC using team areas is supported on non-configuration-enabled (Non-CM) ETM project areas. Once RAC is enabled on a project area, it cannot be disabled, and the project area cannot subsequently be enabled for configuration management.
Standard Disclaimer
The information in this document is distributed AS IS. The use of this information or the implementation of any of these techniques is a customer responsibility and depends on the customer’s ability to evaluate and integrate them into the customer’s operational environment. While each item may have been reviewed by IBM for accuracy in a specific situation, there is no guarantee that the same or similar results will be obtained elsewhere. Customers attempting to adapt these techniques to their own environments do so at their own risk. Any pointers in this publication to external Web sites are provided for convenience only and do not in any manner serve as an endorsement of these Web sites. Any performance data contained in this document was determined in a controlled environment, and therefore, the results that may be obtained in other operating environments may vary significantly. Users of this document should verify the applicable data for their specific environment. Performance is based on measurements and projections using standard IBM benchmarks in a controlled environment. The actual throughput or performance that any user will experience will vary depending upon many factors, including considerations such as the amount of multi-programming in the user’s job stream, the I/O configuration, the storage configuration, and the workload processed. Therefore, no assurance can be given that an individual user will achieve results similar to those stated here. This testing was done as a way to evaluate and characterize the performance, scalability, and resource utilization of ETM Read Access Control under high concurrent user load and large data volumes. The results shown here should be evaluated as comparative performance data and operational guidance rather than an absolute benchmark for all custom deployments.Key Findings
Performance and scalability characterization of ETM Read Access Control (RAC) by using Team Areas across large enterprise repositories (147M+ artifacts) established the following key conclusions:- High Concurrency Scalability:
- In typical enterprise project deployments with up to 500 team areas, RAC scales linearly up to 3,000 concurrent users with fast, sub-second response times and zero performance degradation.
- Under standard mixed workloads up to 1,500 concurrent users, zero transactions breached the 5.0-second SLA threshold.
- Low Infrastructure Overhead:
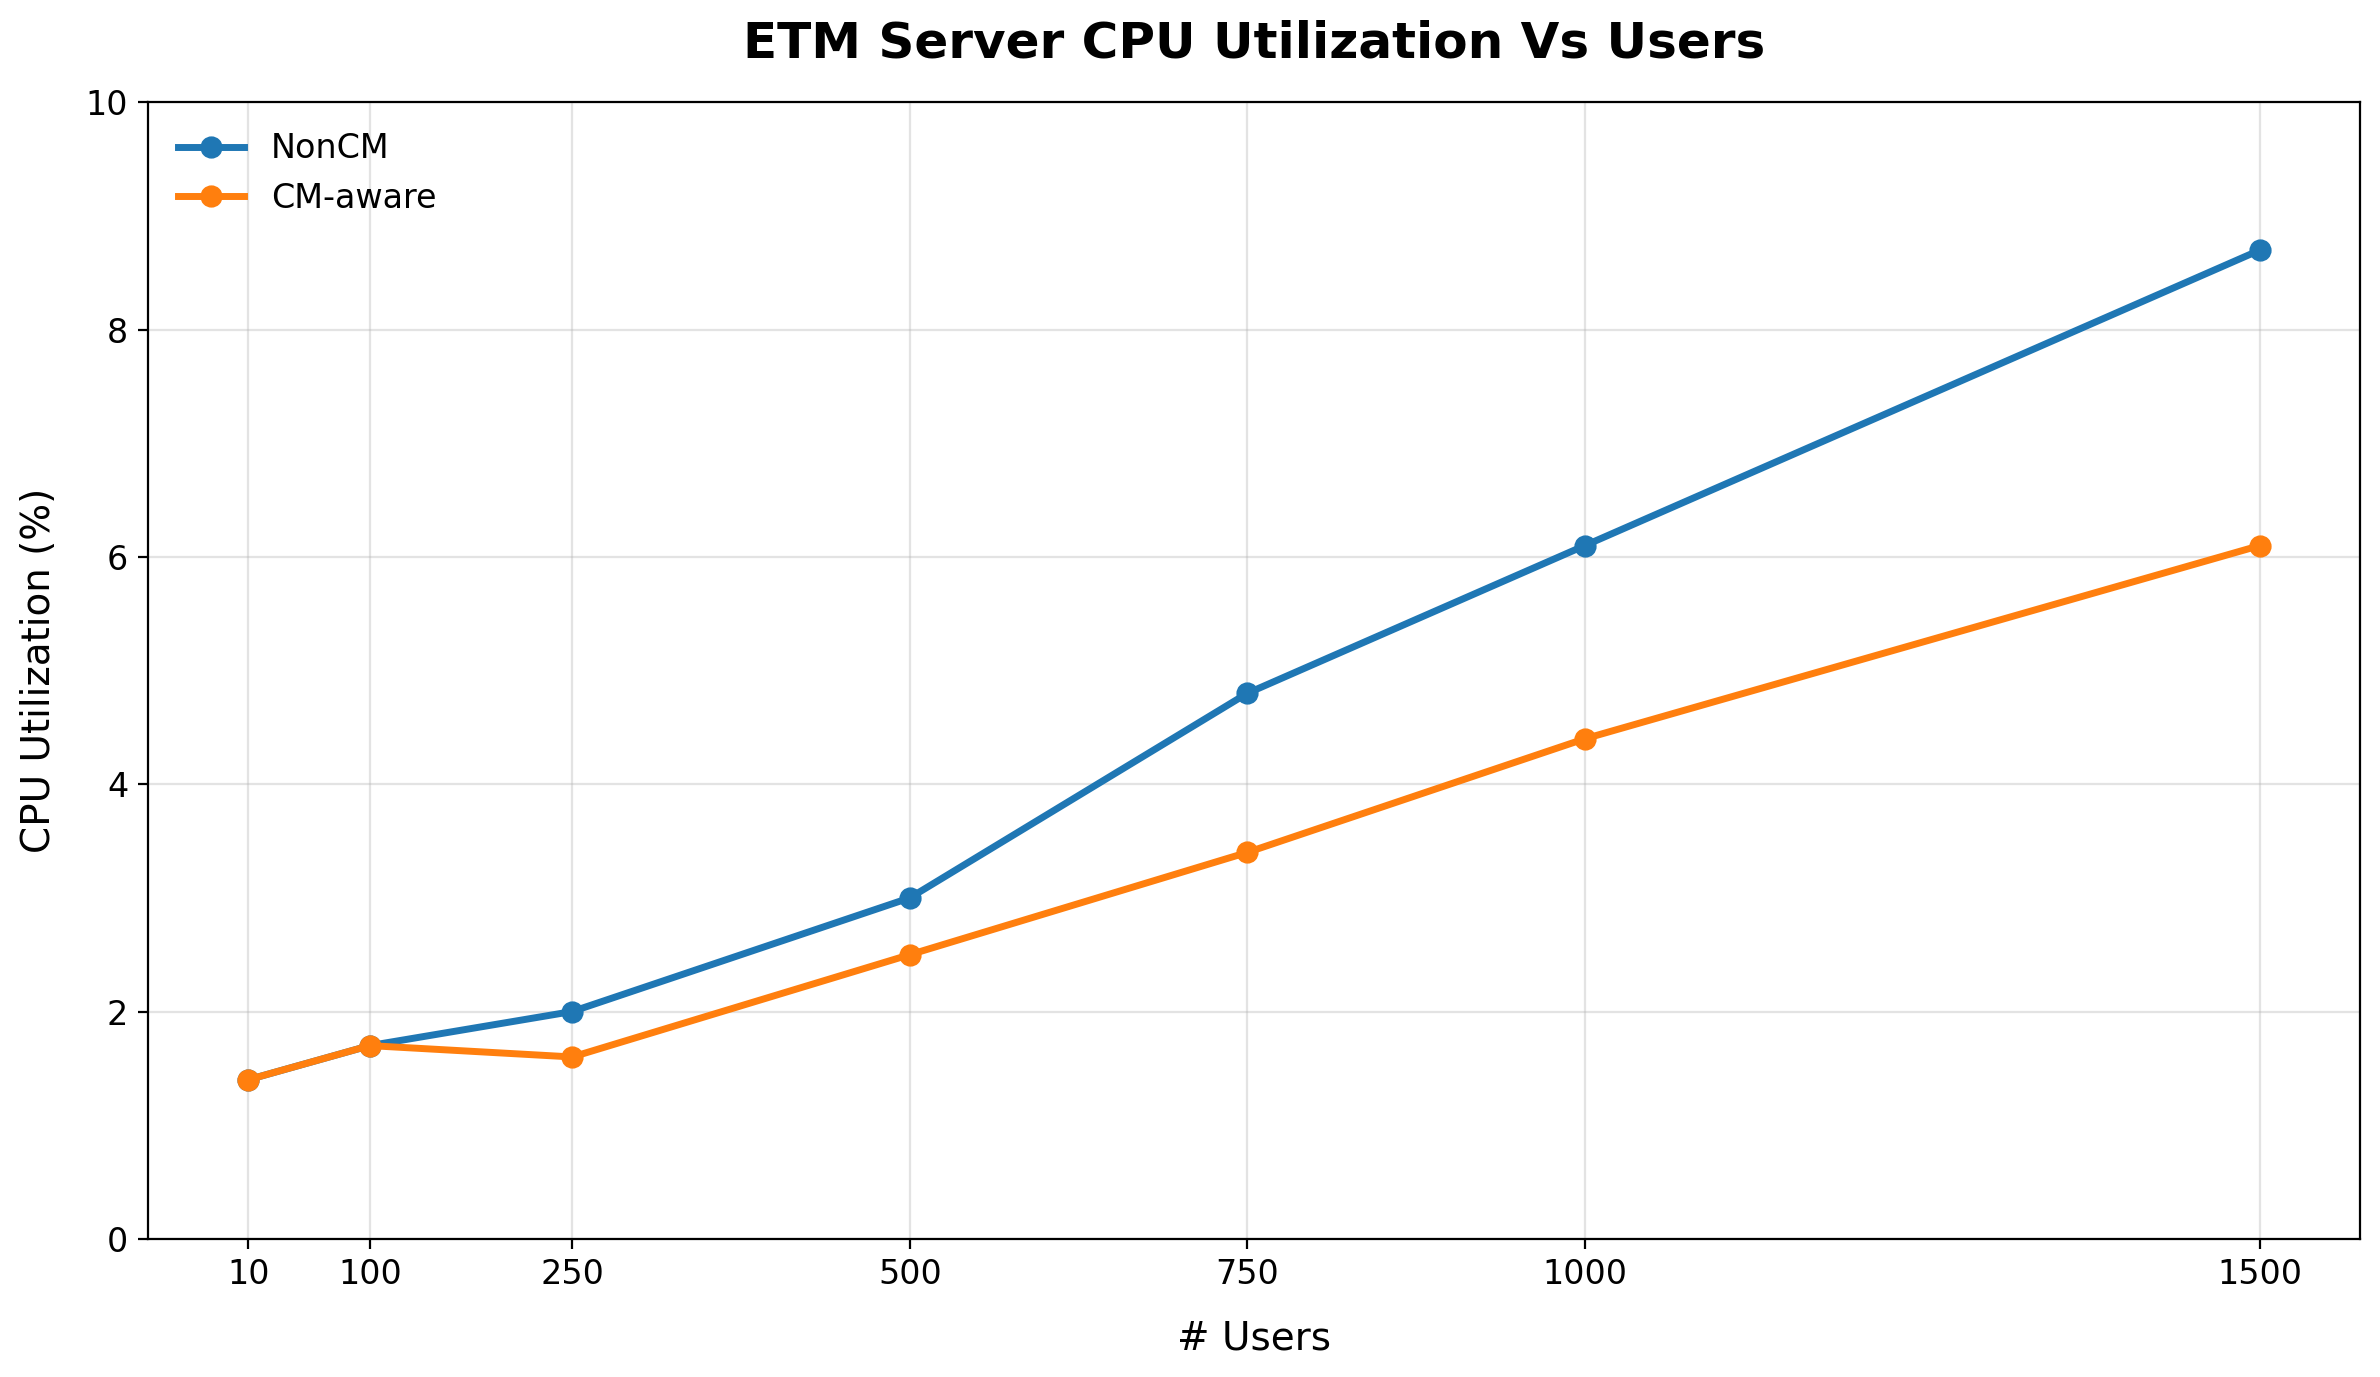
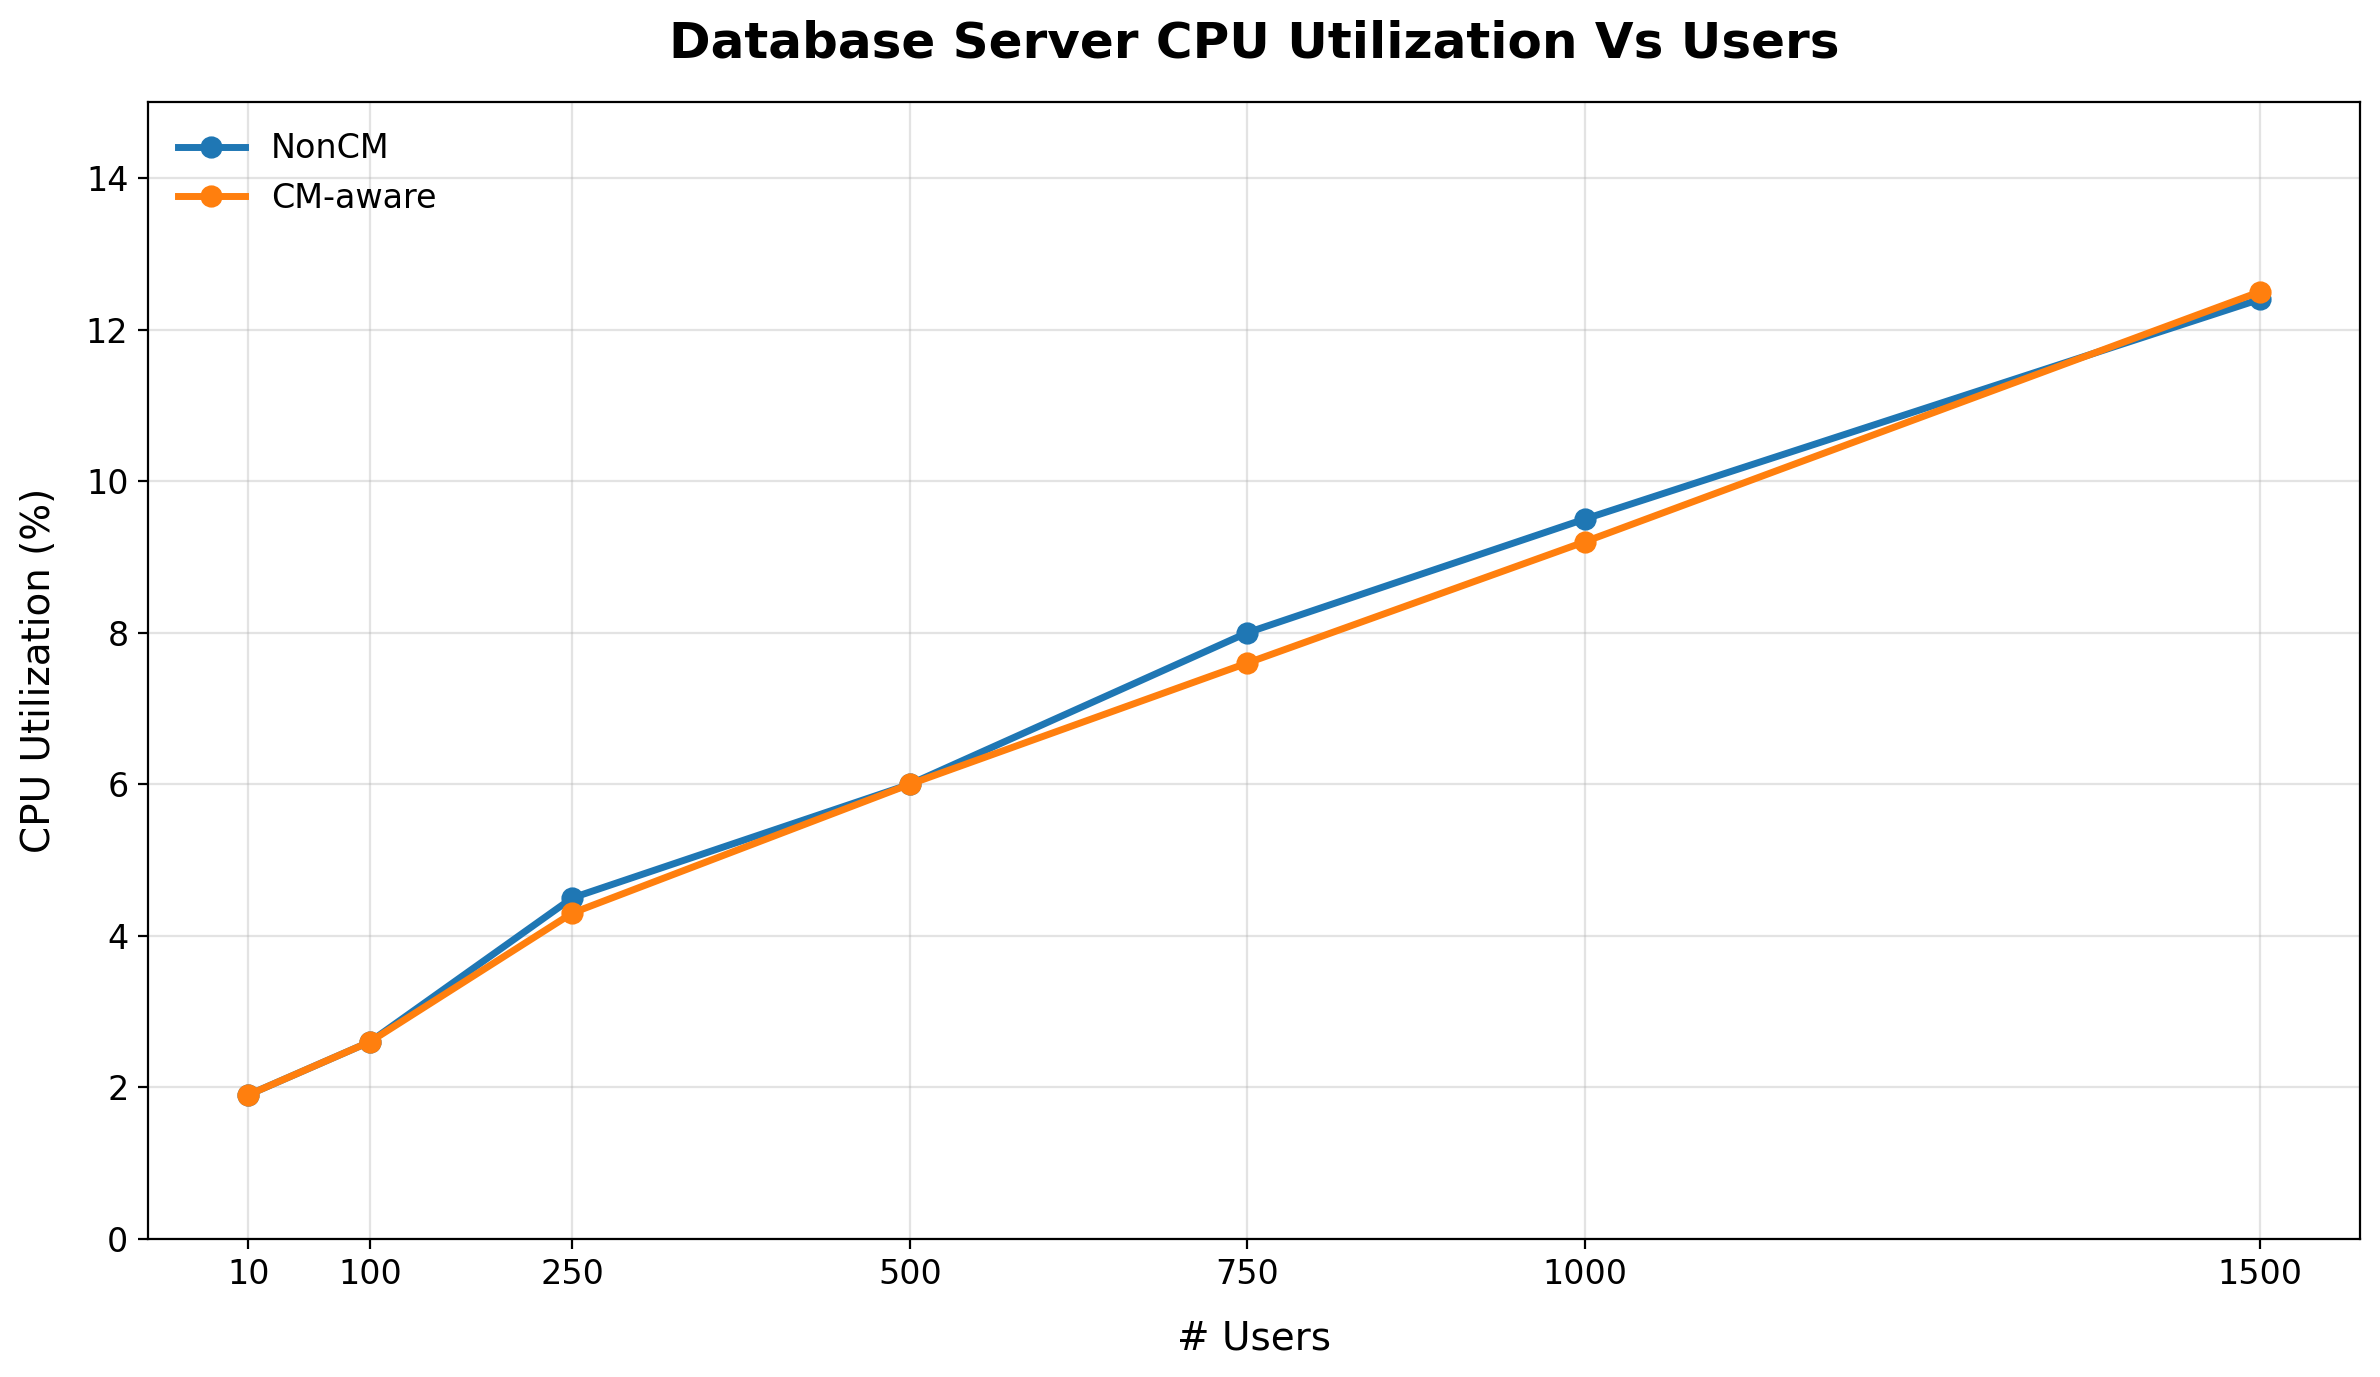
- The RAC SQL access-filtering logic introduces minimal CPU overhead on the hosting environment. At peak 1,500-user load, CPU utilization remained well below capacity—peaking at 12.4% on the Oracle 19c Database and 8.7% on the ETM Liberty Application Server.
- Team Area Sizing Boundaries:
- Because RAC evaluates team hierarchies dynamically in SQL queries, high team area density per project introduces sizing boundaries:
- 500 Team Areas: Recommended up to 3,000 concurrent users.
- 1,000 Team Areas: Recommended up to 1,800 concurrent users (knee point at ~2,000 users).
- 2,000 Team Areas: Recommended up to 1,000 concurrent users (elevated latency beyond 1,000 users).
- Because RAC evaluates team hierarchies dynamically in SQL queries, high team area density per project introduces sizing boundaries:
- Identified Bottlenecks:
- Initial project area dashboard loads invoke
/processAreaHierarchiesWithApplicationContext, which can take up to ~1 minute in repositories with massive project and team area counts. - User permission resolution (
/processAreasForUser) scales linearly with the number of team areas assigned to an individual user, warranting the practice of least privilege in user team assignments.
- Initial project area dashboard loads invoke
Test Methodology
This section details how the ETM RAC performance characterization and scale tests were conducted, including the repository data shape, environment topology, test scenarios, and workload execution methodology.Data Shape & Repository Scale
Performance validation was executed against our largest ETM repository containing approximately 147M artifacts across 2,040 project areas and 20,200 team areas. To stress-test the new RAC SQL filtering paths, hierarchy resolution logic, synthetic benchmark project areas and team area hierarchies were generated in two structured phases using the Java-based ETM Data Generator tool:- Phase 1 — Project & Team Area Hierarchy Generation:
- Created ~1,000 non-configuration ETM project areas.
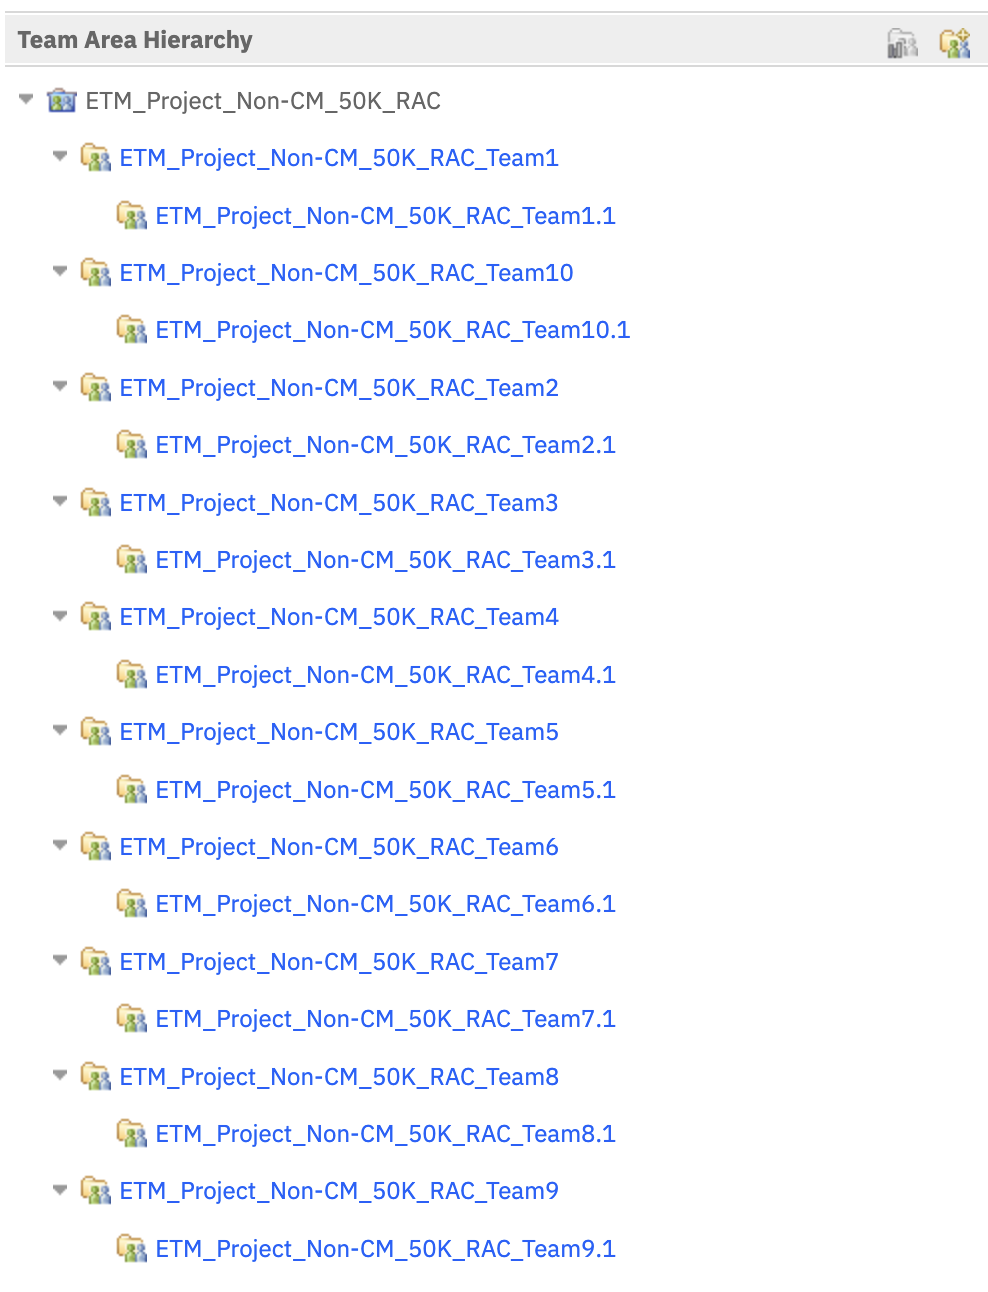
- Configured hierarchical team structures in each project: 10 top-level team areas, each having 1 sub-team area (20 team areas per project).
- Assigned users across project and team areas with standard
JazzUsersandJazzAdminroles.
- Phase 2 — High-Volume RAC Project Areas:
- Populated high-volume project areas generating ~250K to ~2.3M total artifacts with complex team area assignments.
- Configured user populations from 500 up to 10,000 assigned users per project area.
- Generated multiple artifact states and relationship links across Test Plans, Test Cases, Test Suites, Test Scripts, and Execution Records.
| Project Area Name | Type | Team Area Structure | User Base | Generated Artifacts |
|---|---|---|---|---|
| ETM_Project_Non-CM_500K_10KUsers_RAC | Non-CM (RAC) | 20 main teams, 1 sub-team, 1 sub-sub team | 10,000 Users | ~2.3M Artifacts |
| ETM_Project_Non-CM_500K_RAC | Non-CM (RAC) | 10 main teams, 1 sub-team | 500 Users | ~2.3M Artifacts |
| ETM_Project_Non-CM_50K_RAC | Non-CM (RAC) | 10 main teams, 1 sub-team | 500 Users | ~250K Artifacts |
| ETM_Project_CM_500K_10KUsers_RAC | CM-Aware | 20 main teams, 1 sub-team, 1 sub-sub team | 10,000 Users | ~2.3M Artifacts |
| ETM_Project_CM_500K_RAC | CM-Aware | 10 main teams, 1 sub-team | 500 Users | ~2.3M Artifacts |
| ETM_Project_CM_50K_RAC | CM-Aware | 10 main teams, 1 sub-team | 500 Users | ~250K Artifacts |
The following screenshot illustrates the team area hierarchy configuration established in the test project areas:
Workload & Test Scenarios
The performance workload was designed to simulate realistic end-user navigation patterns, browsing actions, and complex filtering operations across RAC-enabled repositories. The core scenario suite included:- Authentication & Dashboard Navigation:
-
RQM_Login: User authentication and initial session handshake. -
RQM_Dashboard: Initial project dashboard rendering and widget data retrieval.
-
- Test Plan & Artifact Browsing:
-
QM_Browse_TestPlans: Loading the paginated Test Plan table. -
QM_Open_Random_TestPlan: Opening a full Test Plan editor. -
QM_Open_TP_TC_View: Browsing Test Cases associated with a selected Test Plan. -
QM_Open_TP_TS_View: Browsing Test Suites associated with a selected Test Plan. -
QM_Open_TP_TCER_View: Browsing Test Case Execution Records (TCERs) associated with a selected Test Plan. -
QM_Open_TCs_List_View: Browsing the main Test Cases table view. -
QM_Open_TCERs_List_View: Browsing the main Test Case Execution Records (TCERs) table view.
-
- Direct Artifact Opening:
-
QM_Open_Random_TestCase,QM_Open_Random_TestSuite,QM_Open_Random_TCER.
-
- TCER Filter Operations:
- Iterations
- Last Result Passed
- Last Result Failed
- Blocked / Error
- Owners
- Owners + Weights
- Owners Exclude Iterations
- Test Environment + Owners
- Test Case Filter Operations:
- Categories
- Categories Excluding
- Categories (Some Unassigned)
- Draft Status
- Created By
- Owners
- Categories + Test Plan Script Steps
- Categories + Test Suites + Test Scripts
- Categories + Weight
Load Testing Methodology
Multi-user workload simulation was executed using Rational Performance Tester (RPT):- Multi-user load schedules were built to execute mixed-scenario workloads with realistic pacing and think time.
- Multi-tier scale runs were conducted from 10 concurrent users up to 1,500 concurrent users (with dedicated scaling capacity evaluations up to 3,000 users).
- Workloads were executed side-by-side against both Non-CM (RAC) and CM-Aware project areas under identical hardware and database configurations to isolate and quantify the RAC access-filtering overhead.

Monitoring Tools
Comprehensive monitoring was active throughout all benchmark windows:- NMON: Continuous recording of CPU, memory utilization, disk I/O, and network throughput across all physical nodes.
- Oracle AWR (Automatic Workload Repository): Profiling database execution time, RAC Common Table Expression (CTE) query overhead, buffer cache hits, and SQL execution plans.
- Java Diagnostics: Thread dumps, javacores, and queryStats instrumentation to detect internal lock contention or JVM memory pressure.
- RPT Report: Aggregating transaction throughput, response times, and error rates.
Test Environment Details
The performance tests were conducted on an enterprise four-server topology deployed on bare-metal physical servers.| Server Role | Hostname / Endpoint | Operating System | Application / Stack | vCPUs | RAM |
|---|---|---|---|---|---|
| Web / Reverse Proxy | RTPCLMPERF42 (perfqm.ibm.com) | RHEL 7.9 | IBM HTTP Server (IHS) | 8 | 16 GB |
| JTS Server | RTPCLMPERF36 | RHEL 7.9 | Jazz Team Server (Liberty) | 24 | 32 GB |
| ETM Application | RTPCLMPERF28 | RHEL 8.x | ETM Server (Liberty) | 24 | 64 GB |
| Database Server | RTPCLMPERF73 | RHEL 7.9 | Oracle Database 19c Enterprise | 40 | 64 GB |
Performance Test Results
This section presents the performance test findings, capacity thresholds, comparative metrics between Non-CM (RAC) and CM-Aware project areas, and server resource utilization under load up to 1,500 concurrent users.Summary of Load Test Results
- Stable Scalability to 1,500 Users: ETM Non-CM project areas with Read Access Control enabled scale reliably up to 1,500 concurrent users with zero response time threshold breaches (> 5.0 seconds SLA).
- Minimal Server Resource Overhead: Server CPU utilization remained exceptionally low on both tiers at 1,500 concurrent users—peaking at 12.4% on the Oracle Database server and 8.7% on the ETM Application server.
- Fast Navigation & TCER Filtering in Non-CM: Browsing Test Plans (~236 ms), opening TCER views (~328 ms), and executing TCER filters (285–307 ms) demonstrated sub-second response times across all load levels.
- Predictable Scaling Profile: Response times for navigation, dashboards, and filtering remained flat from 100U to 1,500U, demonstrating strong query execution stability.
Load Testing with Varying Team Area Counts (Capacity Limits)
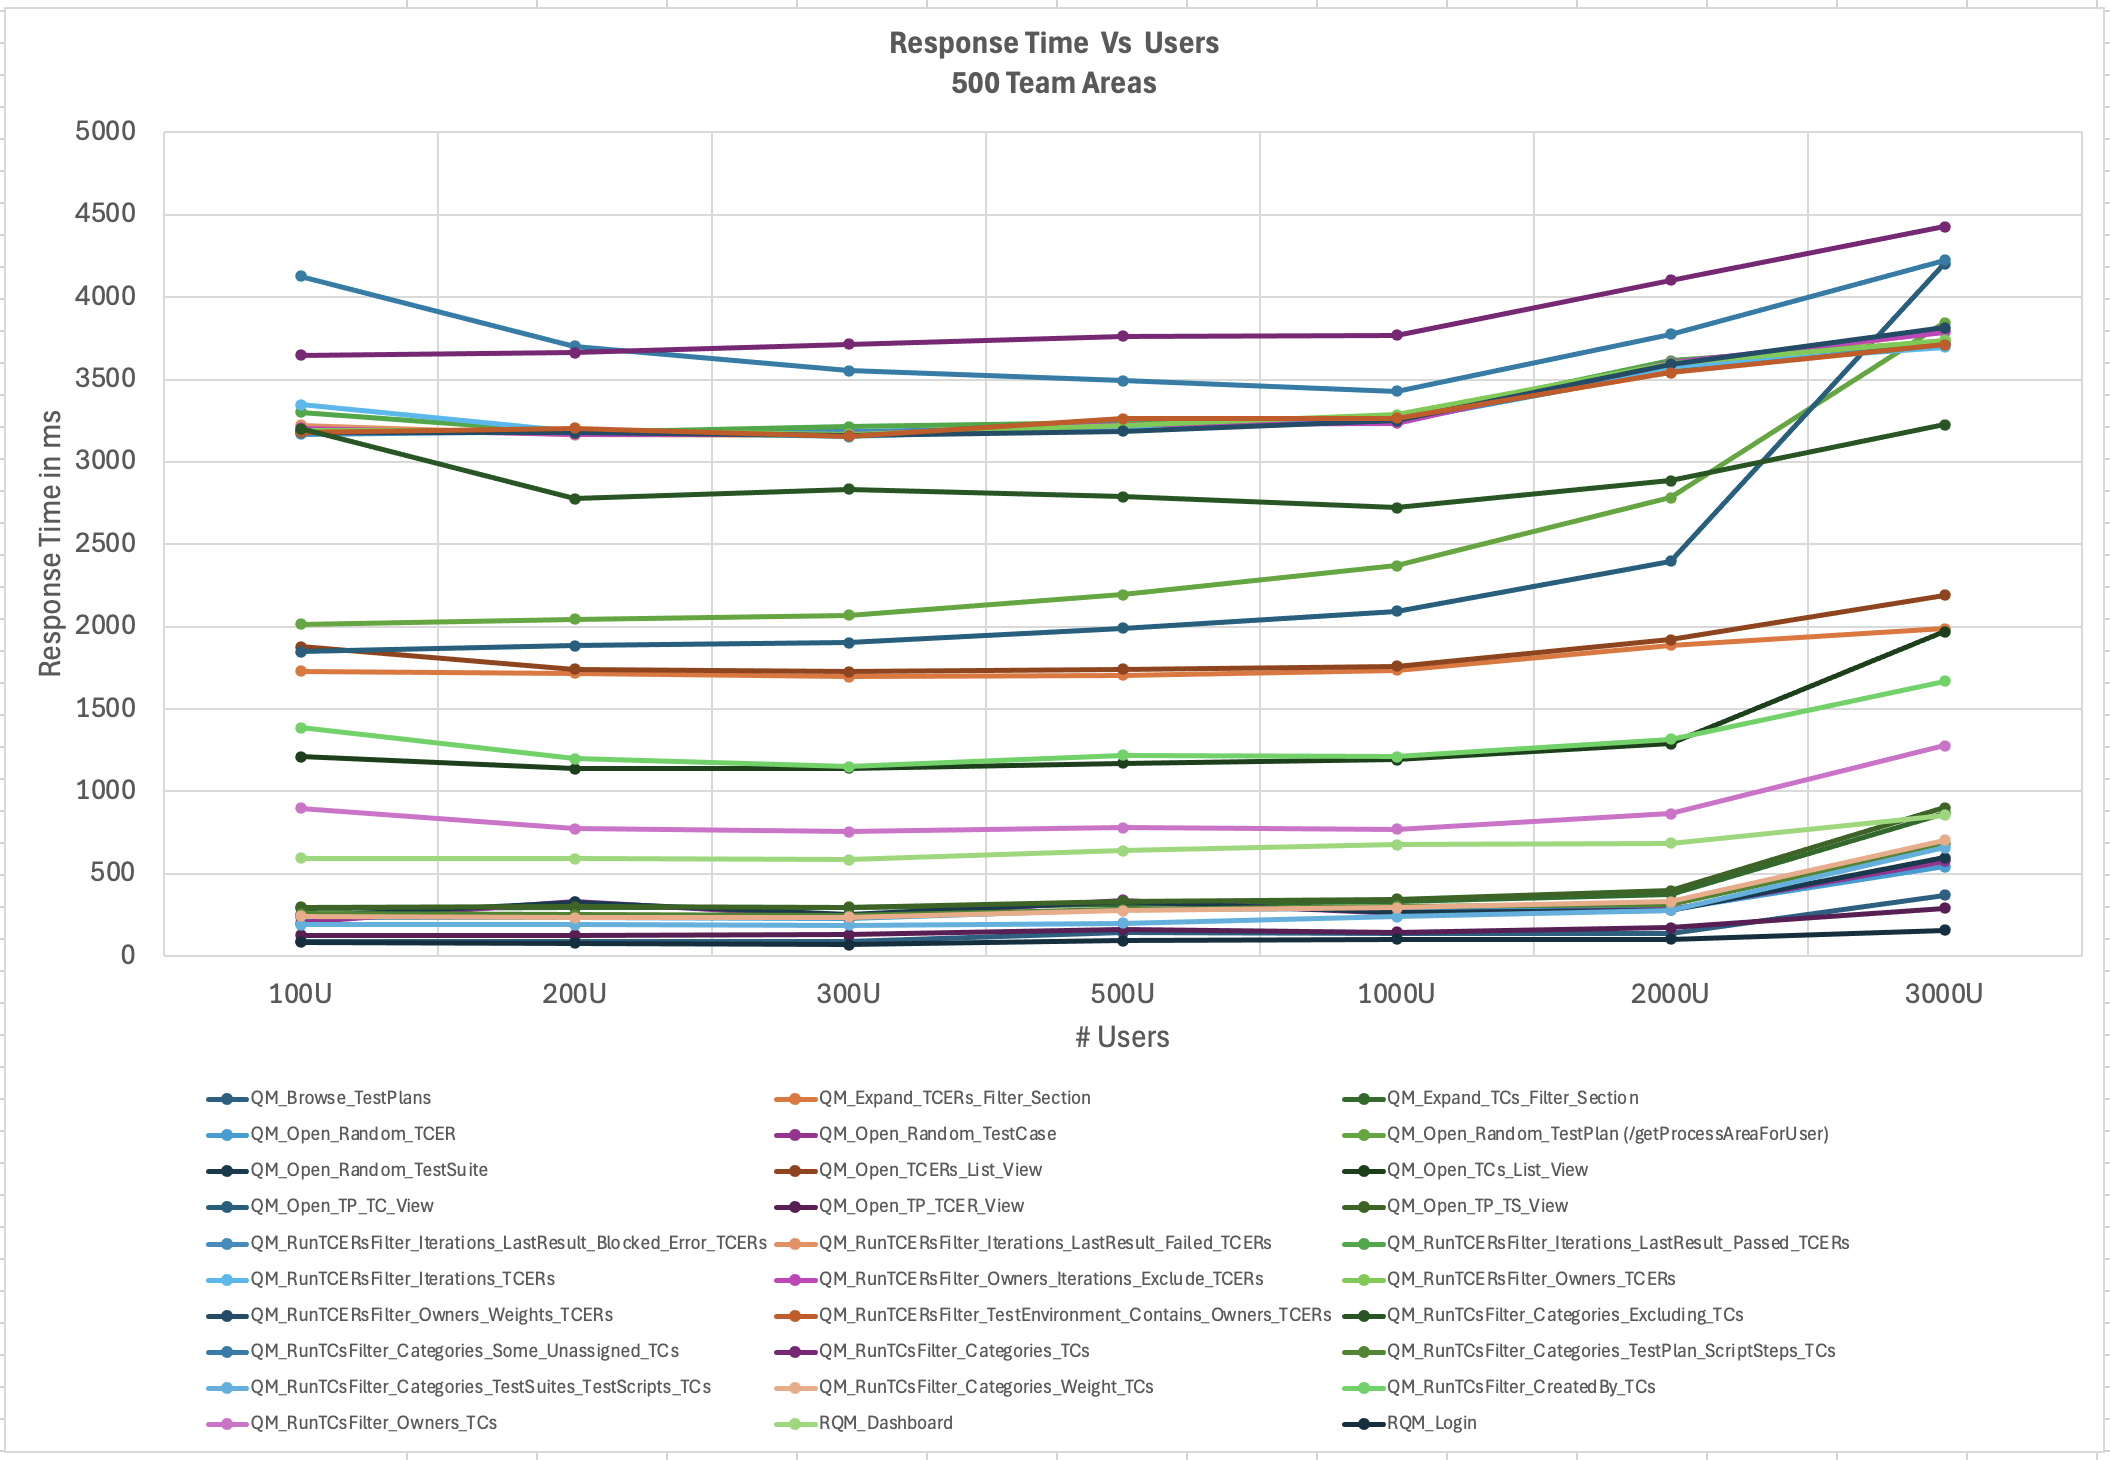
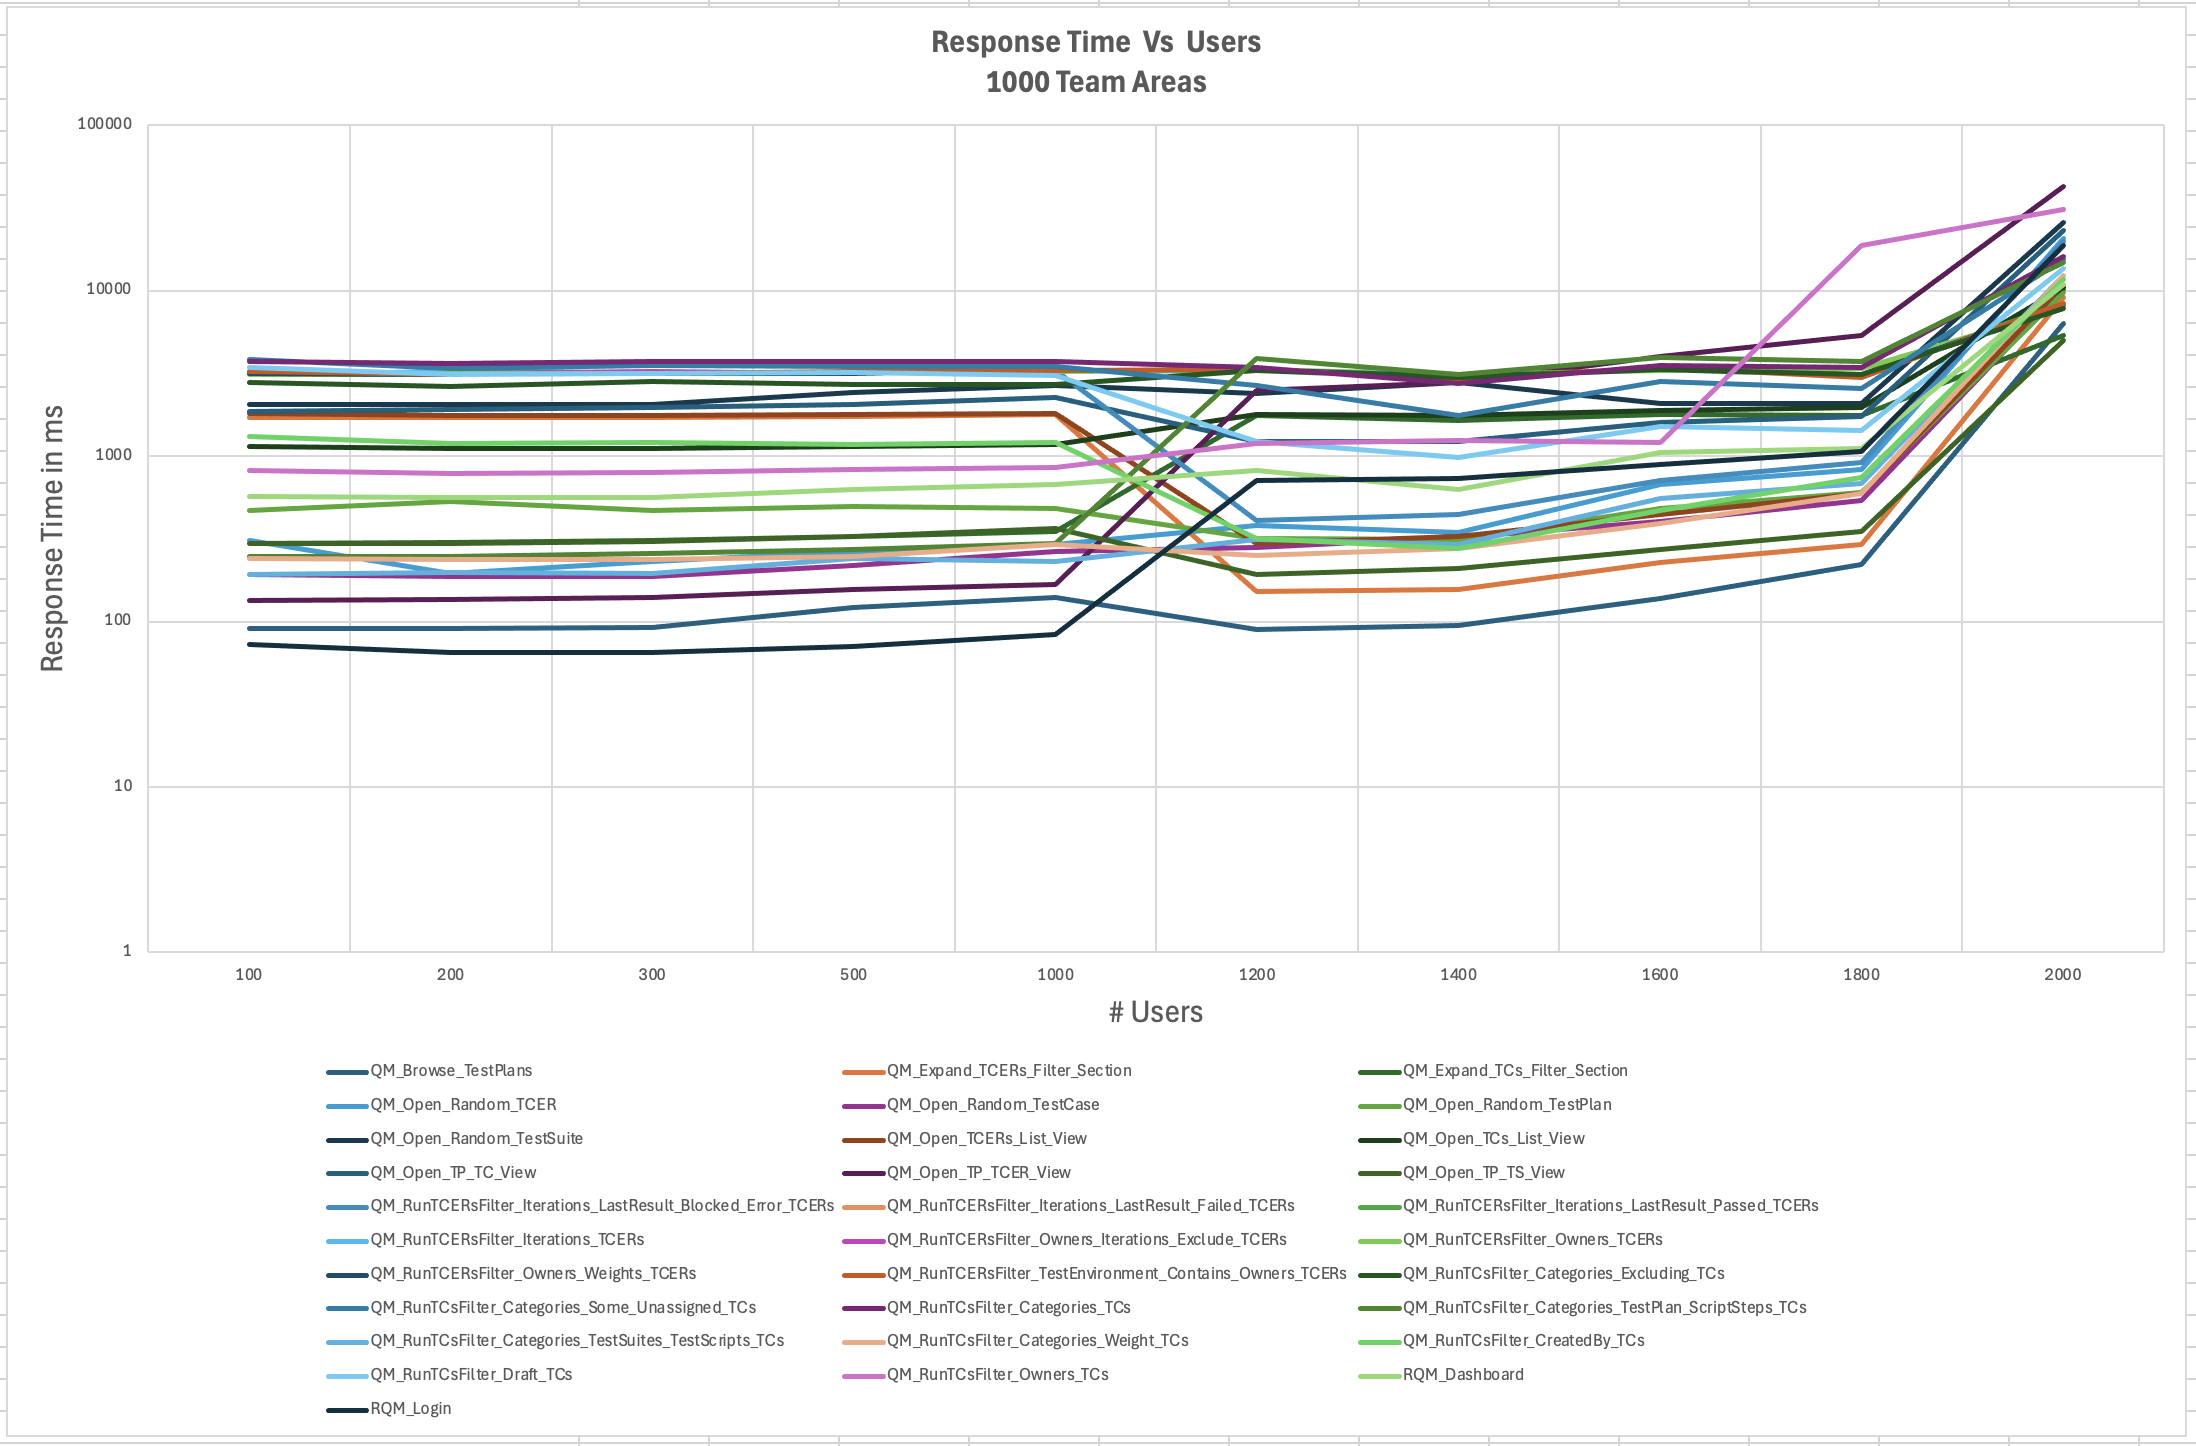
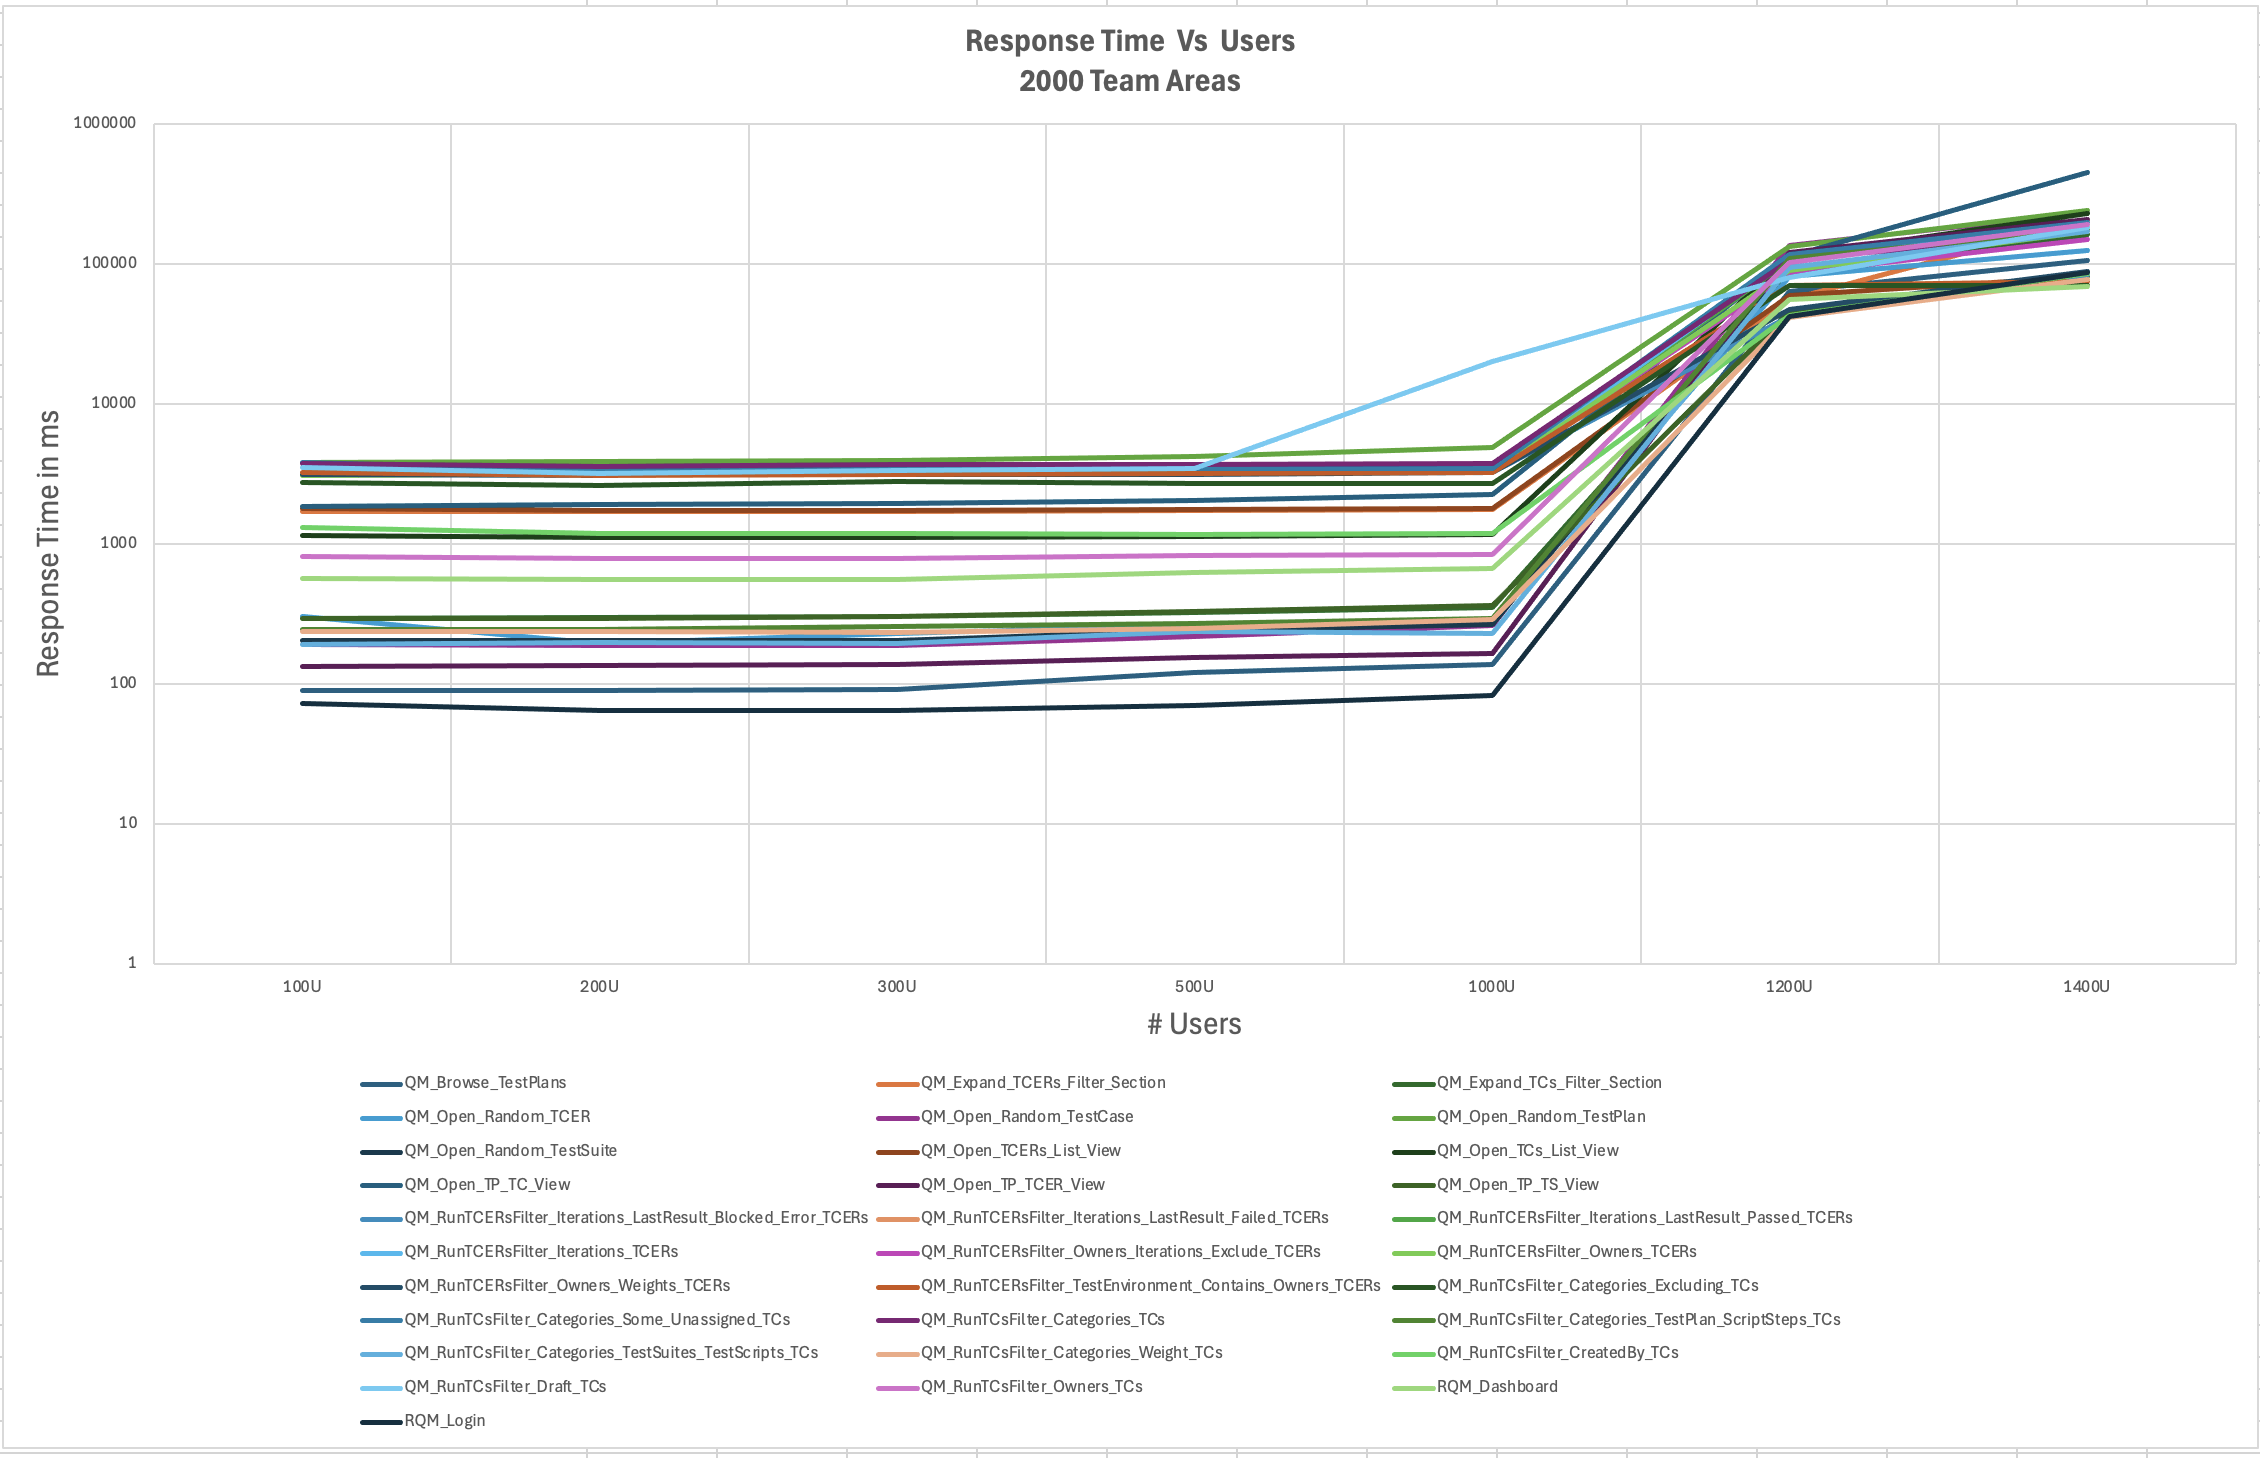
To establish operational sizing guidelines, dedicated load testing was conducted with varying numbers of team areas (500, 1,000, and 2,000 team areas) under increasing concurrent user counts. Because RAC SQL filters evaluate team hierarchy paths and memberships during query execution, team area density directly influences database query planning and memory structures. The testing revealed clear scaling thresholds:- 500 Team Areas:
- Tested up to 3,000 concurrent users.
- Response times remained flat and fast across the entire load spectrum.
- No measurable performance degradation was observed.
- Recommended Operational Limit: Up to 3,000 concurrent users.
- 1,000 Team Areas:
- Performance remained stable and well within acceptable thresholds up to approximately 1,800 concurrent users.
- As load approached 2,000 concurrent users, response times began to experience exponential growth due to increased database CTE resolution overhead and lock queues.
- Recommended Operational Limit: Up to 1,800 concurrent users.
- 2,000 Team Areas:
- Performance degradation became noticeable starting at 1,000 concurrent users.
- Elevated response times and query latency were consistently observed beyond 1,000 users as the high volume of team areas magnified the cost of hierarchy evaluation per query.
- Recommended Operational Limit: Up to 1,000 concurrent users.
Summary of Sizing Guidelines by Team Area Scale
| Team Area Count | Recommended User Limit | Observed Degradation Point | Status / Sizing |
|---|---|---|---|
| 500 Team Areas | Up to 3,000 Users | None observed up to 3,000U | Excellent Scalability |
| 1,000 Team Areas | Up to 1,800 Users | ~1,800 to 2,000 Users | Stable for Large Scale |
| 2,000 Team Areas | Up to 1,000 Users | ~1,000 Users | Plan Sizing Carefully |
Server CPU Utilization
Resource monitoring confirmed that neither the ETM application server nor the Oracle database server experienced CPU exhaustion during the 1,500 user scale test. Both Non-CM (RAC) and CM-Aware workloads exhibited similar, moderate CPU growth profiles.| Project Area Mode & Node | 10U | 100U | 250U | 500U | 750U | 1000U | 1500U |
|---|---|---|---|---|---|---|---|
| Non-CM Oracle DB Server | 1.9% | 2.6% | 4.5% | 6.0% | 8.0% | 9.5% | 12.4% |
| Non-CM ETM App Server | 1.4% | 1.7% | 2.0% | 3.0% | 4.8% | 6.1% | 8.7% |
| CM Oracle DB Server | 1.9% | 2.6% | 4.3% | 6.0% | 7.6% | 9.2% | 12.5% |
| CM ETM App Server | 1.4% | 1.7% | 1.6% | 2.5% | 3.4% | 4.4% | 6.1% |
The charts below show the CPU utilization curves on the ETM Application Server and Database Server as user load scaled from 10 to 1,500 concurrent users:
Detailed Response Time Analysis: Non-CM (RAC) vs CM-Aware
The multi-user benchmark measured 31 distinct user transactions and queries across both project area modes.1. Navigation & View Operations
| Transaction / Scenario | Mode | 10U (ms) |
100U (ms) |
250U (ms) |
500U (ms) |
1000U (ms) |
1500U (ms) |
|---|---|---|---|---|---|---|---|
| RQM_Login | Non-CM | 98.6 | 52.7 | 42.3 | 45.7 | 41.1 | 45.8 |
| CM | 104.2 | 50.8 | 42.0 | 42.0 | 42.0 | 43.7 | |
| RQM_Dashboard | Non-CM | 2,243.7 | 2,240.1 | 2,029.0 | 2,062.6 | 2,032.7 | 2,073.1 |
| CM | 2,027.2 | 2,063.6 | 2,031.0 | 1,960.1 | 1,967.2 | 2,028.8 | |
| QM_Browse_TestPlans | Non-CM | 303.8 | 235.7 | 237.3 | 229.7 | 227.9 | 236.2 |
| CM | 114.5 | 124.5 | 105.8 | 99.9 | 94.6 | 100.4 | |
| QM_Open_Random_TestPlan | Non-CM | 532.8 | 466.0 | 467.6 | 496.5 | 482.1 | 495.5 |
| CM | 590.6 | 614.9 | 609.5 | 599.7 | 599.1 | 619.8 | |
| QM_Open_Random_TestCase | Non-CM | 467.3 | 531.2 | 506.6 | 480.8 | 482.1 | 489.1 |
| CM | 308.0 | 493.6 | 310.2 | 283.2 | 257.5 | 263.0 | |
| QM_Open_Random_TestSuite | Non-CM | 409.5 | 495.4 | 438.8 | 411.5 | 405.9 | 417.9 |
| CM | 188.5 | 218.6 | 209.0 | 195.7 | 190.3 | 201.1 | |
| QM_Open_Random_TCER | Non-CM | 688.8 | 498.9 | 562.0 | 530.8 | 464.8 | 514.7 |
| CM | 419.8 | 605.2 | 380.7 | 390.1 | 374.9 | 349.1 | |
| QM_Open_TCERs_List_View | Non-CM | 355.5 | 306.5 | 305.5 | 313.9 | 320.6 | 328.5 |
| CM | 1,858.9 | 1,873.1 | 1,905.8 | 1,928.7 | 1,950.8 | 1,981.7 | |
| QM_Open_TCs_List_View | Non-CM | 1,319.4 | 1,151.2 | 1,140.6 | 1,168.1 | 1,177.7 | 1,191.1 |
| CM | 212.5 | 229.3 | 196.0 | 194.1 | 189.4 | 198.0 | |
| QM_Open_TP_TC_View | Non-CM | 1,439.7 | 1,382.4 | 1,386.7 | 1,415.2 | 1,419.0 | 1,442.5 |
| CM | 460.6 | 463.8 | 479.6 | 485.6 | 487.6 | 499.5 | |
| QM_Open_TP_TCER_View | Non-CM | 387.8 | 346.5 | 350.9 | 357.6 | 359.5 | 368.7 |
| CM | 181.5 | 175.0 | 174.7 | 176.3 | 176.4 | 178.2 | |
| QM_Open_TP_TS_View | Non-CM | 1,277.3 | 1,250.5 | 1,264.0 | 1,289.4 | 1,295.5 | 1,317.0 |
| CM | 167.3 | 158.9 | 161.2 | 162.4 | 161.9 | 165.5 | |
| QM_Expand_TCERs_Filter_Section | Non-CM | 288.1 | 268.3 | 268.0 | 283.3 | 281.6 | 290.4 |
| CM | 1,776.4 | 1,807.0 | 1,859.6 | 1,881.3 | 1,904.3 | 1,931.0 | |
| QM_Expand_TCs_Filter_Section | Non-CM | 1,690.8 | 1,665.3 | 1,692.2 | 1,719.7 | 1,727.6 | 1,753.2 |
| CM | 128.5 | 123.3 | 110.4 | 109.0 | 108.9 | 112.7 |
2. TCER Filter Operations
TCER filtering demonstrated high efficiency under RAC in Non-CM project areas, consistently executing in 280 ms to 380 ms. In CM-Aware project areas, TCER queries executed in the 1.7 s to 2.0 s range due to configuration-context resolution overhead across versioned configurations.| TCER Filter Transaction | Mode | 10U (ms) |
100U (ms) |
250U (ms) |
500U (ms) |
1000U (ms) |
1500U (ms) |
|---|---|---|---|---|---|---|---|
| Iterations | Non-CM | 378.0 | 293.8 | 285.2 | 292.3 | 291.1 | 297.5 |
| CM | 1,718.0 | 1,762.9 | 1,818.7 | 1,886.3 | 1,857.1 | 1,889.8 | |
| Last Result Passed | Non-CM | 368.0 | 295.2 | 285.0 | 288.9 | 288.2 | 298.6 |
| CM | 1,771.0 | 1,752.4 | 1,811.9 | 1,846.2 | 1,860.1 | 1,897.9 | |
| Last Result Failed | Non-CM | 299.0 | 299.7 | 286.1 | 319.5 | 292.1 | 297.4 |
| CM | 1,747.0 | 1,782.6 | 1,812.2 | 1,836.0 | 1,854.4 | 1,896.2 | |
| Blocked / Error | Non-CM | 357.0 | 296.9 | 289.5 | 292.5 | 306.7 | 296.7 |
| CM | 1,712.0 | 1,763.1 | 1,815.6 | 1,839.1 | 1,870.9 | 1,890.6 | |
| Owners | Non-CM | 332.0 | 291.9 | 285.9 | 291.8 | 290.6 | 299.8 |
| CM | 1,803.0 | 1,770.9 | 1,803.3 | 1,835.8 | 1,862.9 | 1,899.8 | |
| Owners + Weights | Non-CM | 351.0 | 296.2 | 286.5 | 290.0 | 292.1 | 307.7 |
| CM | 2,084.0 | 1,756.1 | 1,810.3 | 1,865.7 | 1,856.5 | 1,890.2 | |
| Owners Exclude Iterations | Non-CM | 287.0 | 287.2 | 286.7 | 293.3 | 289.5 | 306.5 |
| CM | 1,748.0 | 1,757.5 | 1,816.3 | 1,836.7 | 1,863.1 | 1,888.7 | |
| TestEnvironment + Owners | Non-CM | 321.0 | 279.1 | 289.5 | 292.1 | 293.0 | 306.3 |
| CM | 1,721.0 | 1,771.4 | 1,812.2 | 1,851.8 | 1,865.2 | 1,888.8 |
3. Test Case Filter Operations
In Test Case filtering, queries involving negative category filters (Categories Excluding) or unassigned status (Draft) in Non-CM RAC project areas require broader table scans and multi-join CTE evaluations across the large unversioned artifact repository. These operations took ~4.2–4.3 s at low load (cold cache) and stabilized at ~3.0–3.1 s at 1,500 users. In CM-Aware project areas, the versioned component scoping allows these queries to execute faster (~150 ms).| Test Case Filter Transaction | Mode | 10U (ms) |
100U (ms) |
250U (ms) |
500U (ms) |
1000U (ms) |
1500U (ms) |
|---|---|---|---|---|---|---|---|
| Categories Excluding | Non-CM | 4,358.0 | 3,543.5 | 3,052.0 | 3,148.2 | 3,036.2 | 3,076.8 |
| CM | 157.0 | 166.0 | 165.1 | 153.6 | 154.8 | 161.2 | |
| Draft Status | Non-CM | 4,223.0 | 3,451.3 | 3,118.1 | 3,178.3 | 3,072.2 | 3,102.5 |
| CM | 176.0 | 192.5 | 162.6 | 160.0 | 156.4 | 162.6 | |
| Created By | Non-CM | 2,218.0 | 2,111.6 | 2,021.0 | 2,059.7 | 2,022.5 | 2,065.5 |
| CM | 153.0 | 142.3 | 131.9 | 130.1 | 128.3 | 153.2 | |
| Categories (Some Unassigned) | Non-CM | 944.0 | 908.0 | 929.2 | 950.0 | 953.7 | 969.6 |
| CM | 269.0 | 265.2 | 241.0 | 231.9 | 227.2 | 288.9 | |
| Categories | Non-CM | — | 995.1 | 998.1 | 1,051.8 | 1,018.2 | 1,038.6 |
| CM | — | 172.8 | 149.2 | 142.9 | 141.1 | 157.7 | |
| Categories + TP ScriptSteps | Non-CM | 998.0 | 982.3 | 998.8 | 1,030.3 | 1,038.8 | 1,037.7 |
| CM | 142.0 | 162.7 | 159.9 | 142.9 | 142.6 | 151.5 | |
| Categories + TS + Scripts | Non-CM | 947.0 | 943.9 | 955.2 | 1,002.5 | 978.1 | 988.1 |
| CM | 144.0 | 157.9 | 133.5 | 125.4 | 126.7 | 131.9 | |
| Categories + Weight | Non-CM | 982.0 | 975.1 | 987.5 | 1,035.5 | 1,009.1 | 1,019.8 |
| CM | 89.0 | 87.9 | 78.3 | 72.8 | 72.2 | 75.8 | |
| Owners | Non-CM | 1,356.0 | 1,227.0 | 1,148.6 | 1,186.0 | 1,177.6 | 1,190.6 |
| CM | 159.0 | 148.4 | 129.2 | 132.5 | 148.0 | 152.3 |
Performance Limitations
During rigorous performance and single-user scale profiling, two existing Jazz Foundation Web UI services were identified as performance bottlenecks when the total number of project areas, team areas, and user memberships in an environment becomes very large. Important Technical Context: It is important to emphasize that this performance degradation is not caused by RAC code changes. No modifications were made to either of these services as part of the Read Access Control feature delivery. However, because adopting the RAC feature naturally encourages organizations to create and configure more Team Areas to partition artifact access, the total volume of team areas in an enterprise repository increases. Because these two preexisting foundation services are designed to traverse, serialize, and return complete process area hierarchies and user memberships, their execution latency is directly dependent on the total count of project areas and team areas in the repository. To provide transparent guidance for architecture, capacity planning, and deployment design, the operational characteristics of these two services are detailed below. 1. Service: /processAreaHierarchiesWithApplicationContext
- Full Service Endpoint:
/qm/service/com.ibm.team.process.internal.service.web.IProcessWebUIService/processAreaHierarchiesWithApplicationContext - When Triggered: Executed automatically by the web client whenever a user loads or refreshes an ETM Project Area Dashboard.
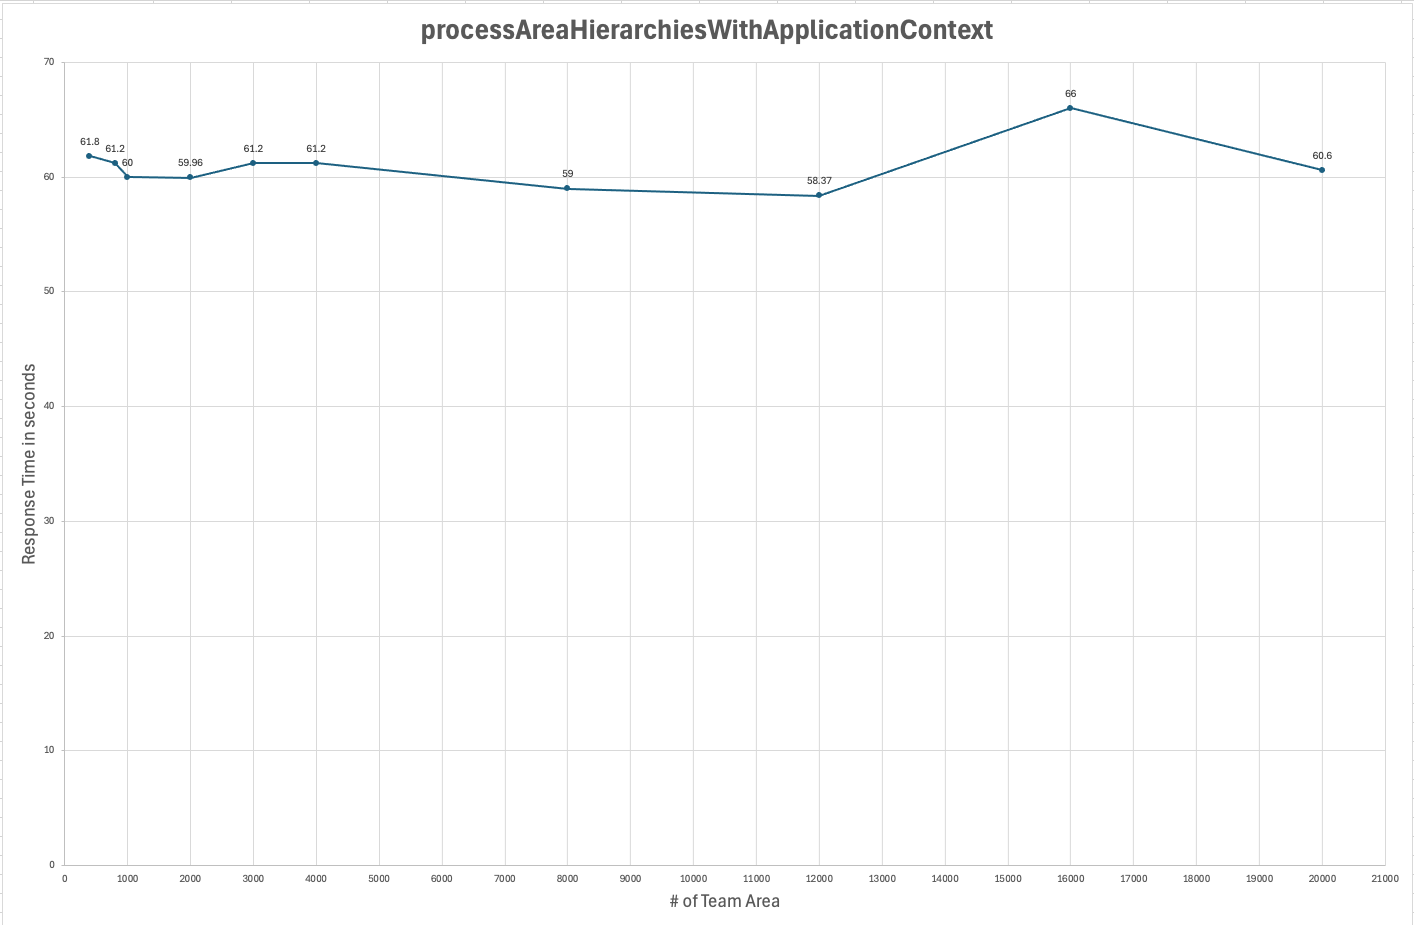
- Behavior & Performance Impact: This service computes the complete process area hierarchy (all project areas and recursive team areas) associated with the application context. When an environment contains thousands of project areas and deeply nested team areas, this service experiences significant latency—taking up to ~1 minute (60 seconds) to return.
- Impact on End-User Experience: The initial dashboard loading spinner remains active for extended durations, degrading the perceived performance of project dashboards.
processAreaHierarchiesWithApplicationContext as the team area count increases:
2. Service: /processAreasForUser
- Full Service Endpoint:
/qm/service/com.ibm.team.process.internal.service.web.IProcessWebUIService/processAreasForUser - When Triggered: Triggered during user navigating to artifact editors or detail views (such as opening a Test Plan, Test Case, or TCER).
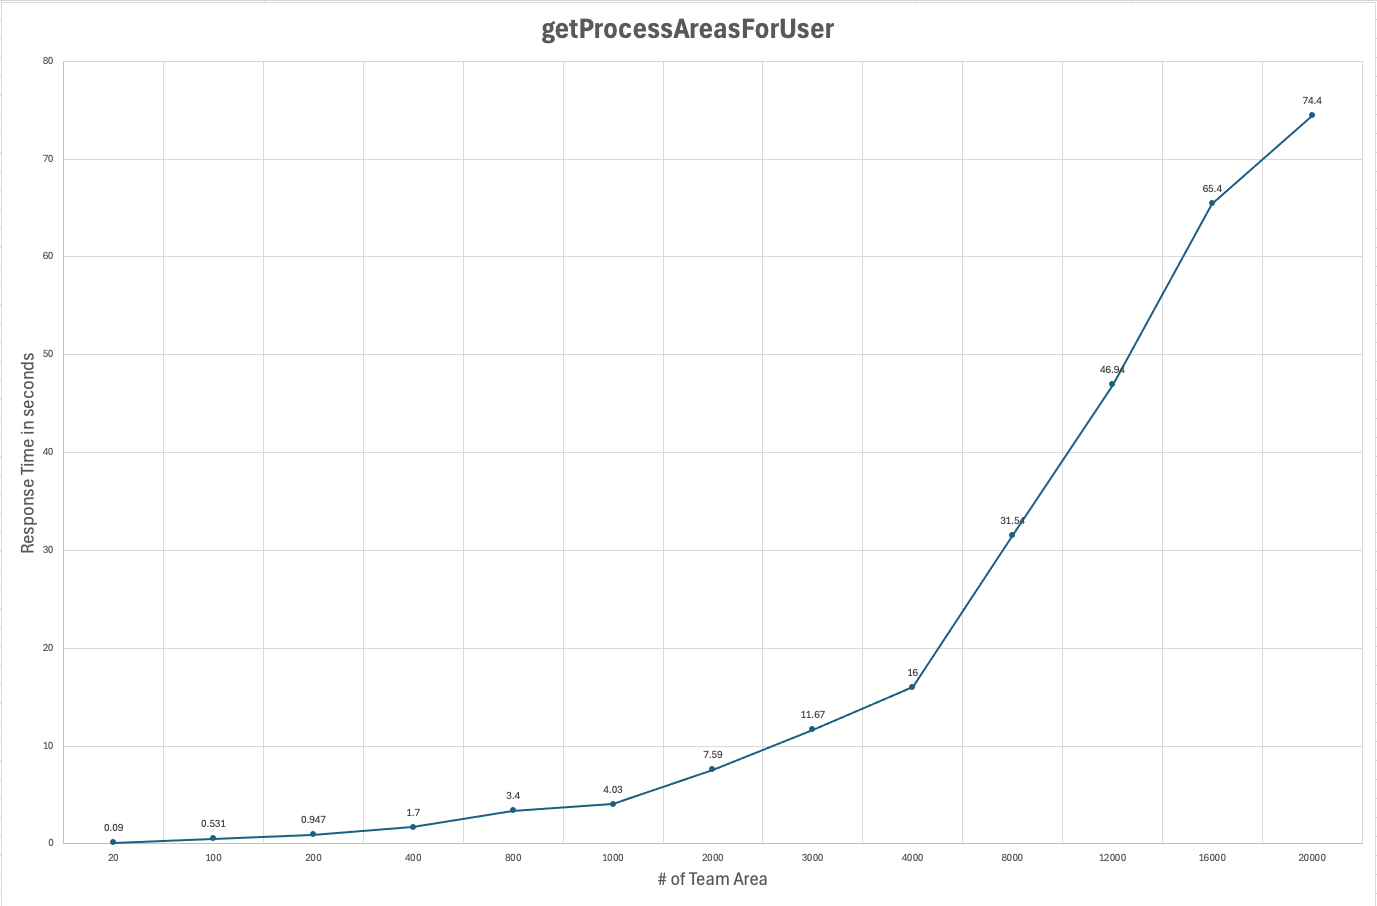
- Behavior & Performance Impact: This service fetches and serializes all project areas and team areas to which the logged-in user is explicitly assigned. As a user's assigned team area count grows (e.g. users belonging to hundreds of team areas across large enterprise deployments), the payload generation and permission resolution time scale linearly.
- Impact on End-User Experience: Introduces incremental latency on individual artifact transitions and initial navigation clicks for users with broad team memberships.
processAreasForUser as a function of the user's assigned team area count:
Recommendations
The performance degradation in both services stems from recursive hierarchy traversal and process model serialization in the Jazz Foundation layer when handling massive team area sets. Recommendations & Best Practices:- Team Area Sizing: Keep total team areas per project area within the tested sweet spot (500 to 1,000 team areas). Where larger counts are required, maintain user concurrency within the recommended limits (1,000 users for 2,000 team areas).
- Principle of Least Privilege in Team Membership: Avoid assigning individual user accounts or service accounts globally to hundreds of team areas. Users should only be added to the specific team areas where they actively participate.
- Dashboard Optimization: Avoid heavy process-area-dependent widgets on personal and project dashboards where large team hierarchies exist.
Additional Details on the Data Shape
To provide full context on the repository size used during testing, the breakdown of artifact distributions across project areas and overall database table volumes in the ETM repository is detailed below. Repository Overview:- Total Project Areas: 2,040
- Total Team Areas: 20,200
- Total Artifact Count in Repository Version Table: 216,162,299 artifacts
Artifact Counts in repository_version Table
Artifact Type (repository_version) |
Count |
|---|---|
| com.ibm.rqm.execution#ExecutionElementResult | 115,481,548 |
| com.ibm.rqm.execution#ExecutionResult | 28,870,387 |
| com.ibm.rqm.planning#ExecutionElement2 | 19,569,260 |
| com.ibm.rqm.execution#TestcaseExecutionRecord | 18,525,548 |
| com.ibm.rqm.planning#ManualExecutionScriptStepLookup | 4,904,187 |
| com.ibm.rqm.deployment#QualityApproval | 4,890,719 |
| com.ibm.rqm.planning#VersionedExecutionScript | 4,884,836 |
| com.ibm.rqm.planning#ManualExecutionScript | 4,884,836 |
| com.ibm.rqm.planning#VersionedTestCase | 4,881,583 |
| com.ibm.rqm.planning#TestCase | 4,881,583 |
| com.ibm.rqm.execution#ExecutionResultGroup | 2,438,100 |
| com.ibm.rational.test.lm.sequencer#ExecutionSequence | 779,917 |
| com.ibm.rqm.planning#TestSuite | 550,885 |
| com.ibm.rqm.planning#VersionedTestSuite | 550,885 |
| com.ibm.rqm.execution#TestSuiteExecutionRecord | 550,330 |
| com.ibm.rqm.process#TestPhase | 316,022 |
| com.ibm.rational.test.lm#AssetConfiguration | 135,386 |
| com.ibm.rqm.planning#VersionedTestPlan | 22,721 |
| com.ibm.rqm.planning#TestPlan | 22,721 |
| com.ibm.rqm.process#SizingRecord | 22,144 |
| com.ibm.team.links#AuditableLink | 9,680 |
| com.ibm.rqm.risk#Risk | 21 |
| Total Artifact Count | 216,162,299 artifacts |
Test Case Distribution by Project Area
| Project Area | Test Case Count |
|---|---|
| CLM603_QM | 2,798,186 |
| ETM_Project_CM_500K_10KUsers_RAC | 24,600 |
| ETM_Project_CM_500K_RAC | 19,800 |
| ETM_Project_Non-CM_500K_10KUsers_RAC | 18,600 |
| ETM_Project_Non-CM_500K_RAC | 11,400 |
| ETM_Project_CM_50K_RAC | 3,500 |
| ETM_Project_Non-CM_50K_RAC | 3,000 |
| ETM_ReconcileTest_ConfigurationManagement_Disable | 806 |
| QM_ReconcileTest | 800 |
| QM_ReconcileTest_WithConfigurationManagement | 465 |
| ETM_Project_RAC_1 | 8 |
| ETM_Link_Test | 2 |
| JAF_Services_Exploration_CM | 1 |
| ETM Sev 1 test | 1 |
Test Suite Distribution by Project Area
| Project Area | Test Suite Count |
|---|---|
| CLM603_QM | 342,720 |
| ETM_Project_CM_500K_10KUsers_RAC | 2,520 |
| ETM_Project_CM_500K_RAC | 1,980 |
| ETM_Project_Non-CM_500K_10KUsers_RAC | 1,785 |
| ETM_Project_Non-CM_500K_RAC | 1,140 |
| ETM_Project_CM_50K_RAC | 400 |
| ETM_Project_Non-CM_50K_RAC | 300 |
Test Case Execution Record (TCER) Distribution by Project Area
| Project Area | TCER Count |
|---|---|
| CLM603_QM | 10,436,440 |
| ETM_Project_CM_500K_10KUsers_RAC | 133,991 |
| ETM_Project_CM_500K_RAC | 107,365 |
| ETM_Project_Non-CM_500K_10KUsers_RAC | 98,208 |
| ETM_Project_Non-CM_500K_RAC | 62,588 |
| ETM_Project_CM_50K_RAC | 19,158 |
| ETM_Project_Non-CM_50K_RAC | 16,479 |
| ETM_Project_RAC_1 | 8 |
| JAF_Services_Exploration_CM | 1 |
Appendix: Abbreviations and Terminology
| Abbreviation | Description / Full Form |
|---|---|
| ETM | IBM Engineering Test Management (formerly Rational Quality Manager / RQM) |
| RAC | Read Access Control (using Jazz Team Areas for granular artifact visibility) |
| TCER | Test Case Execution Record |
| TSER | Test Suite Execution Record |
| TP / TC / TS | Test Plan / Test Case / Test Suite |
| Non-CM | Non-Configuration Management enabled project area (traditional unversioned project) |
| CM | Configuration Management (versioned, baseline, and stream-aware project area) |
| JAF | Jazz Foundation Architecture / Services |
| JTS | Jazz Team Server |
| RPT | Rational Performance Tester (workload generator tool) |
| CTE | Common Table Expression (SQL construct used for recursive hierarchy resolution) |
| ITAR | International Traffic in Arms Regulations (export control compliance framework) |
| AWR | Automatic Workload Repository (Oracle Database performance reporting engine) |
| NMON | Nigel's Monitor (operating system resource and performance monitor for Linux/AIX) |
References


 Copyright © by IBM and non-IBM contributing authors. All material on this collaboration platform is the property of the contributing authors.
 Contributions are governed by our Terms of Use. Please read the following disclaimer.
Dashboards and work items are no longer publicly available, so some links may be invalid. We now provide similar information through other means. Learn more here.