Engineering Lifecycle Management Wiki - Deployment
Deployment Web
Planning and design
Installing and upgrading
Migrating and evolving
Integrating
Administering
Monitoring
Troubleshooting
Community information and contribution guidelines
Create new topic
Topic list
Search
Advanced search
Notify
RSS
Atom
Changes
Statistics
Web preferences
Edit
Attach
P
rintable
TWiki
>
Deployment Web
>
DeploymentPlanningAndDesign
>
PerformanceDatasheetsAndSizingGuidelines
>
ELMPerformanceOnCloud
Revision 20 - 2025-04-04 - 20:28:17 -
VaughnRokosz
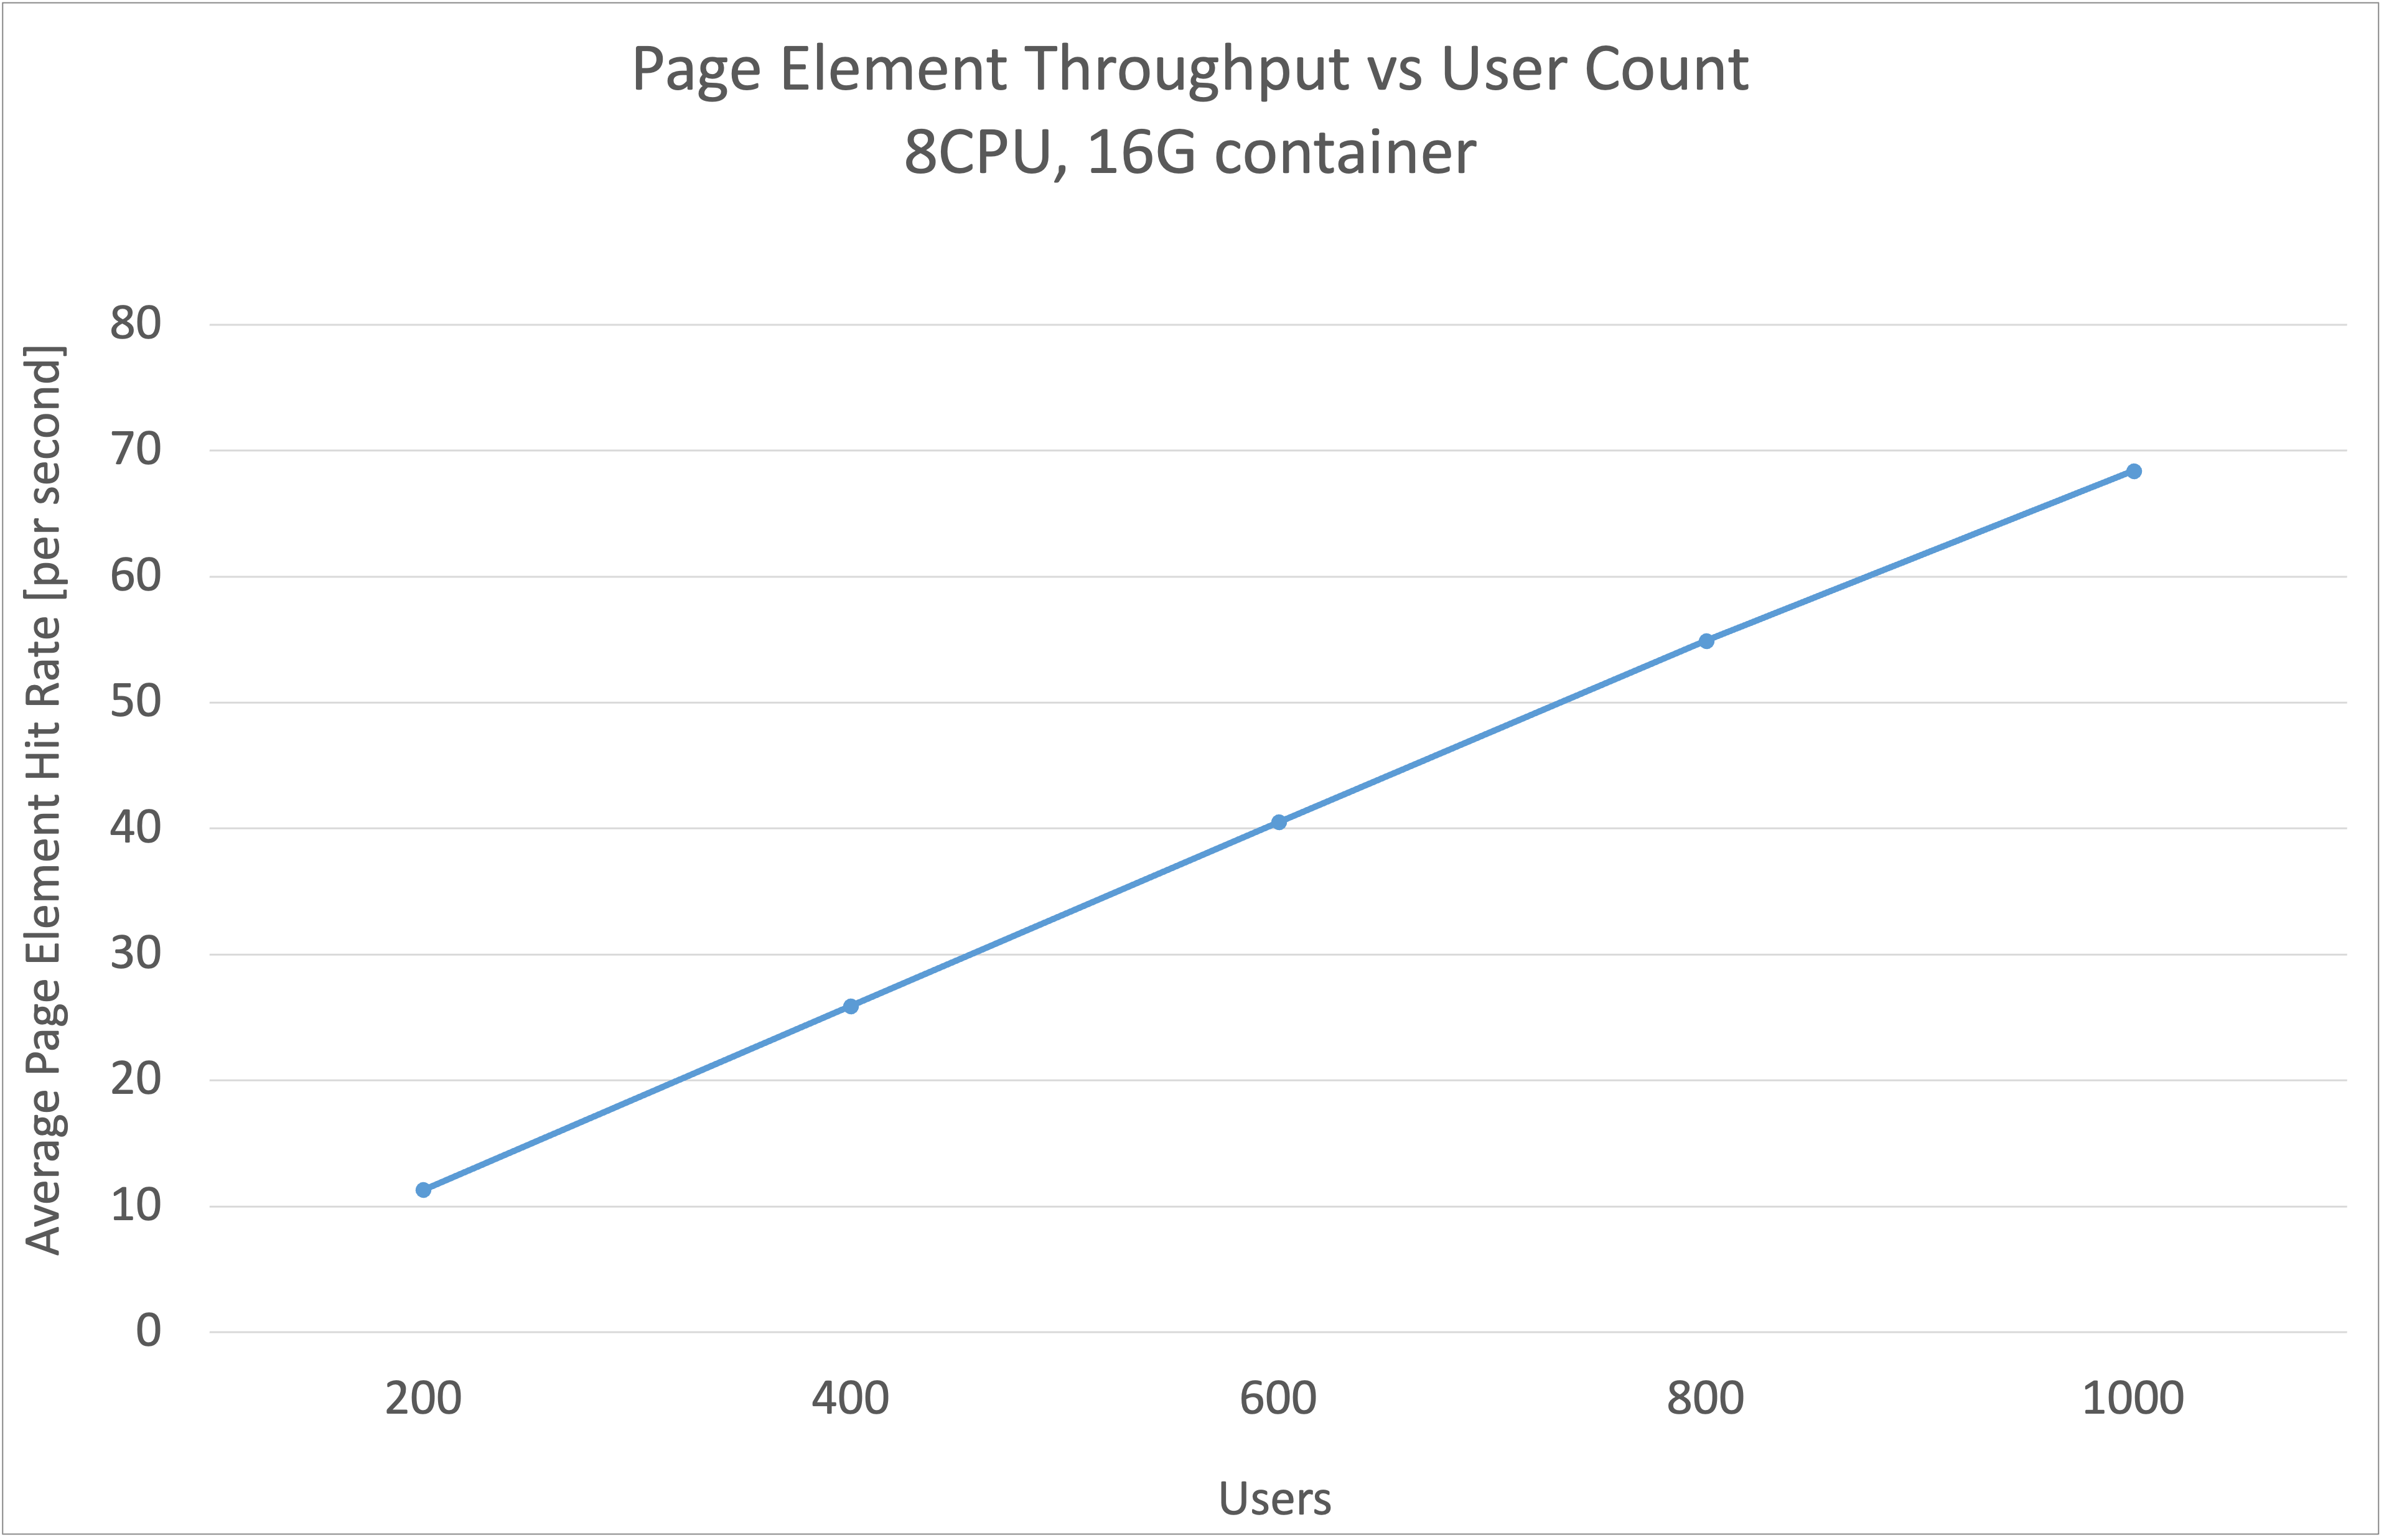
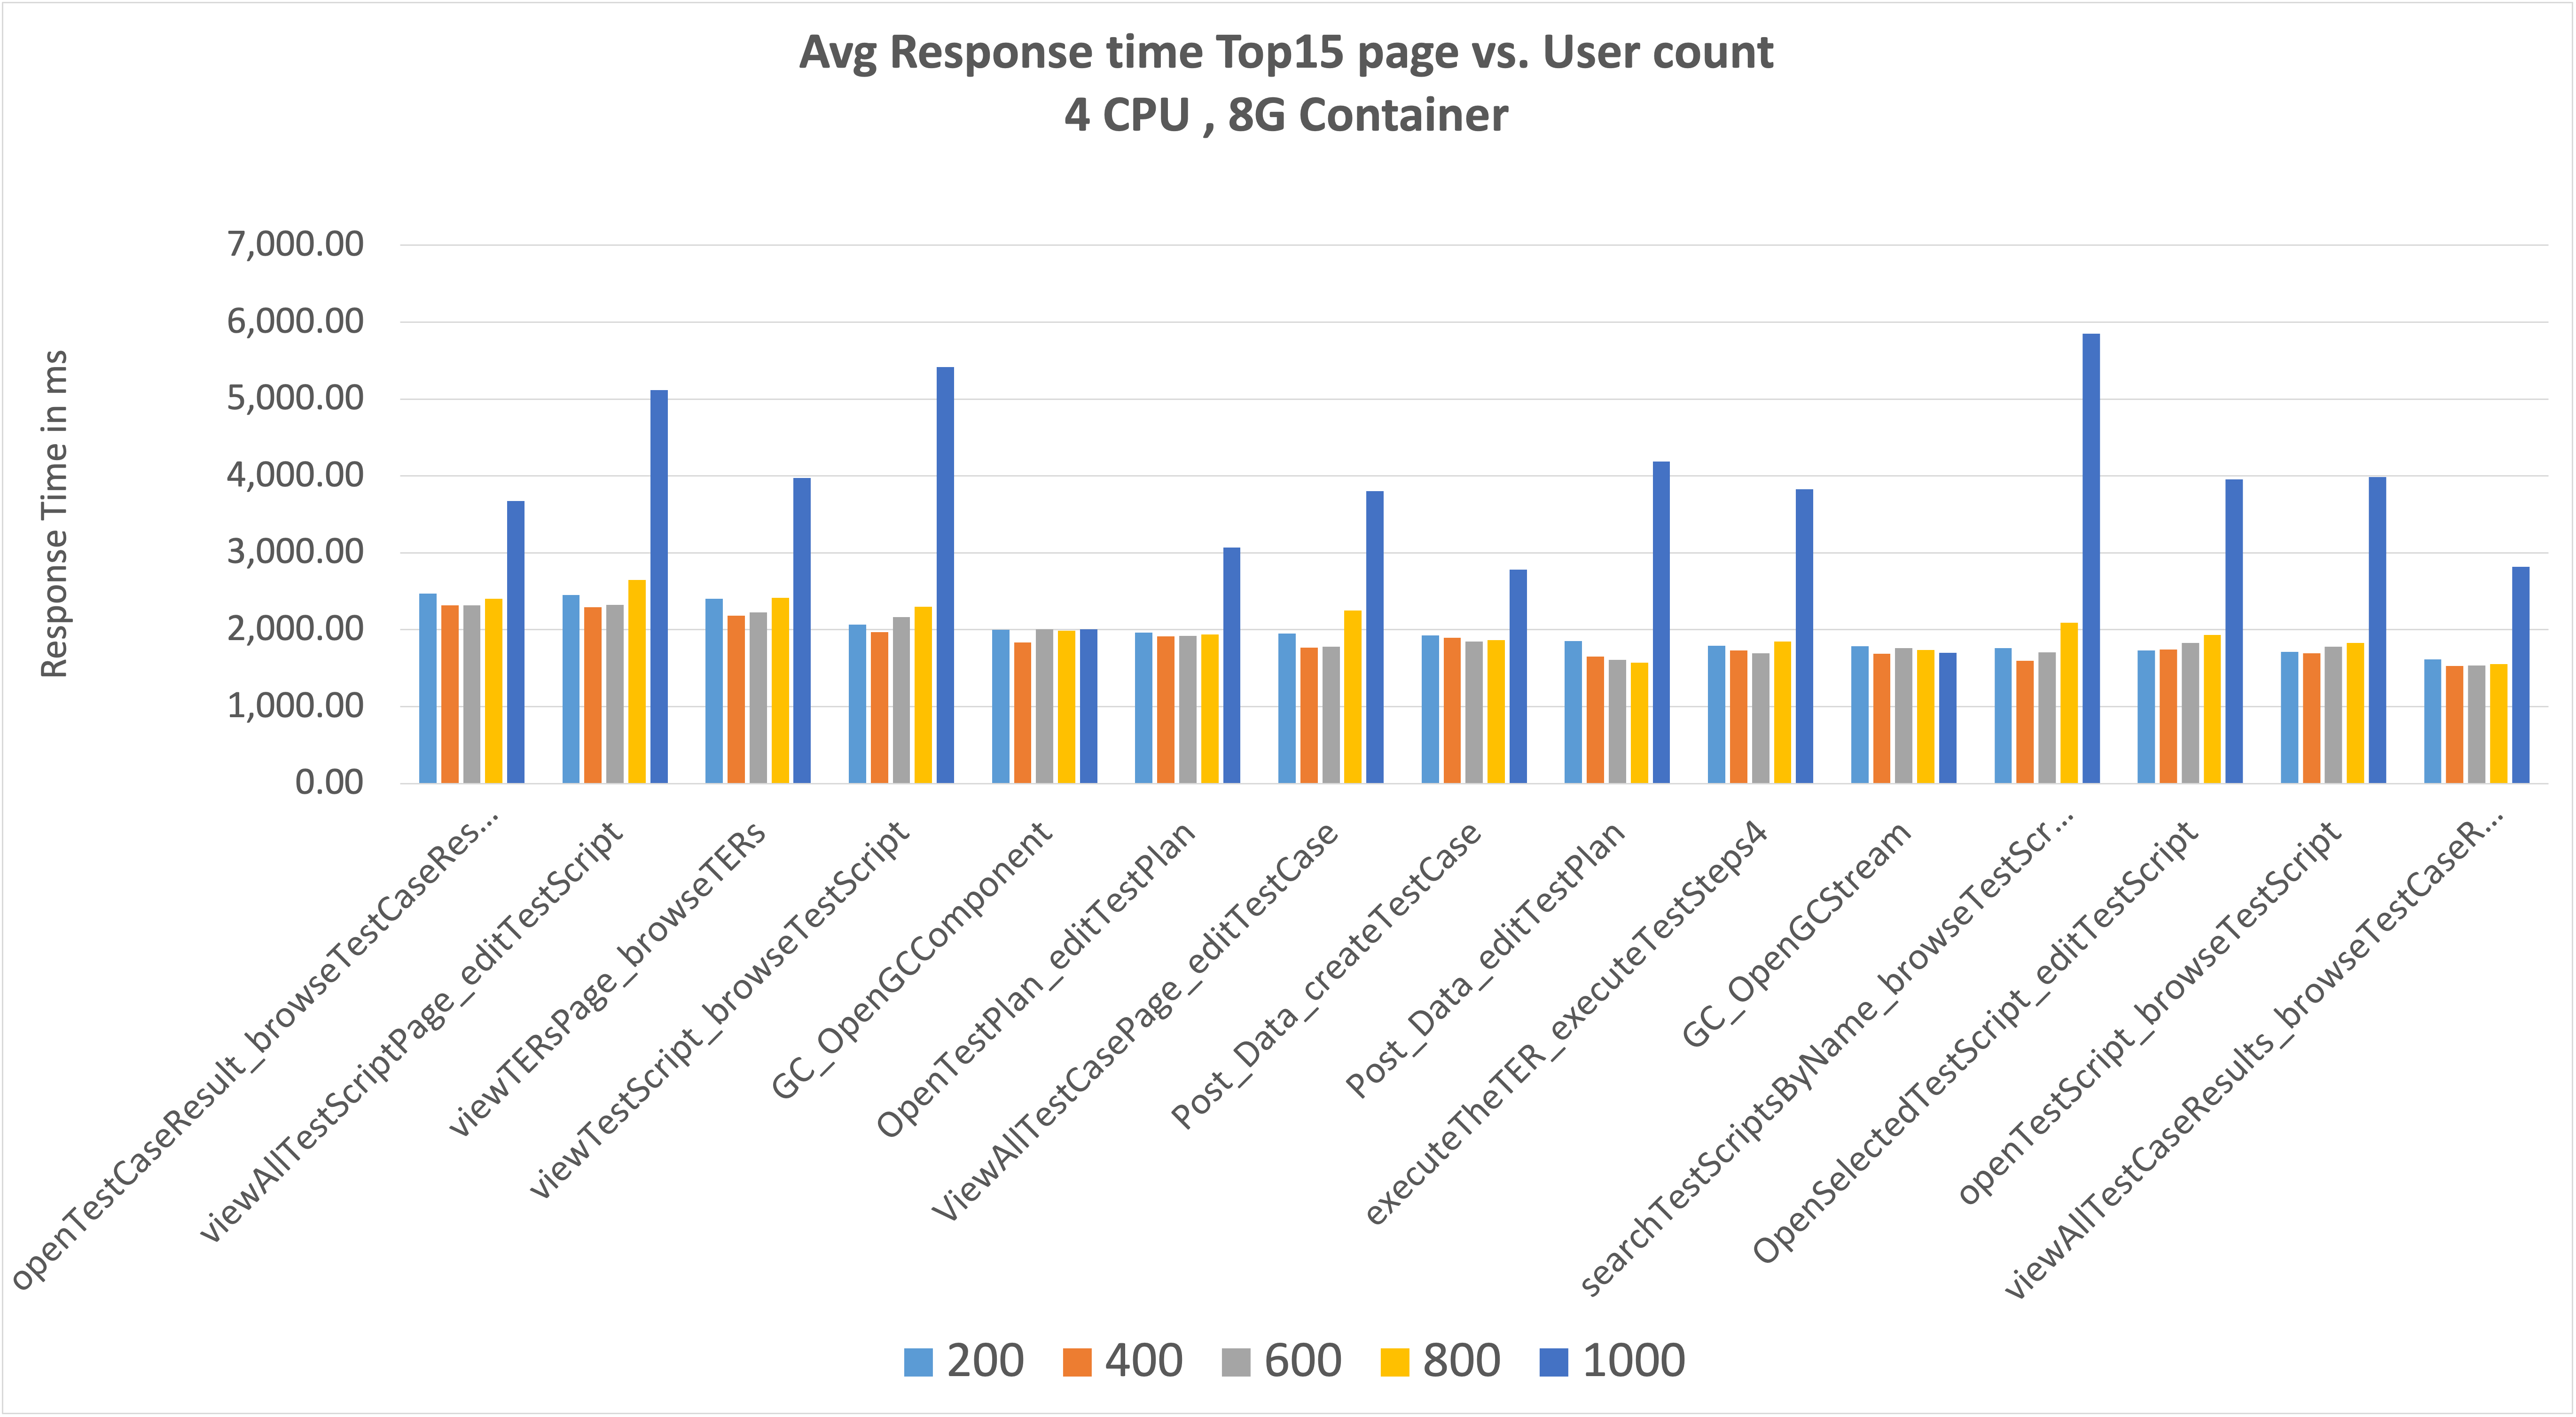
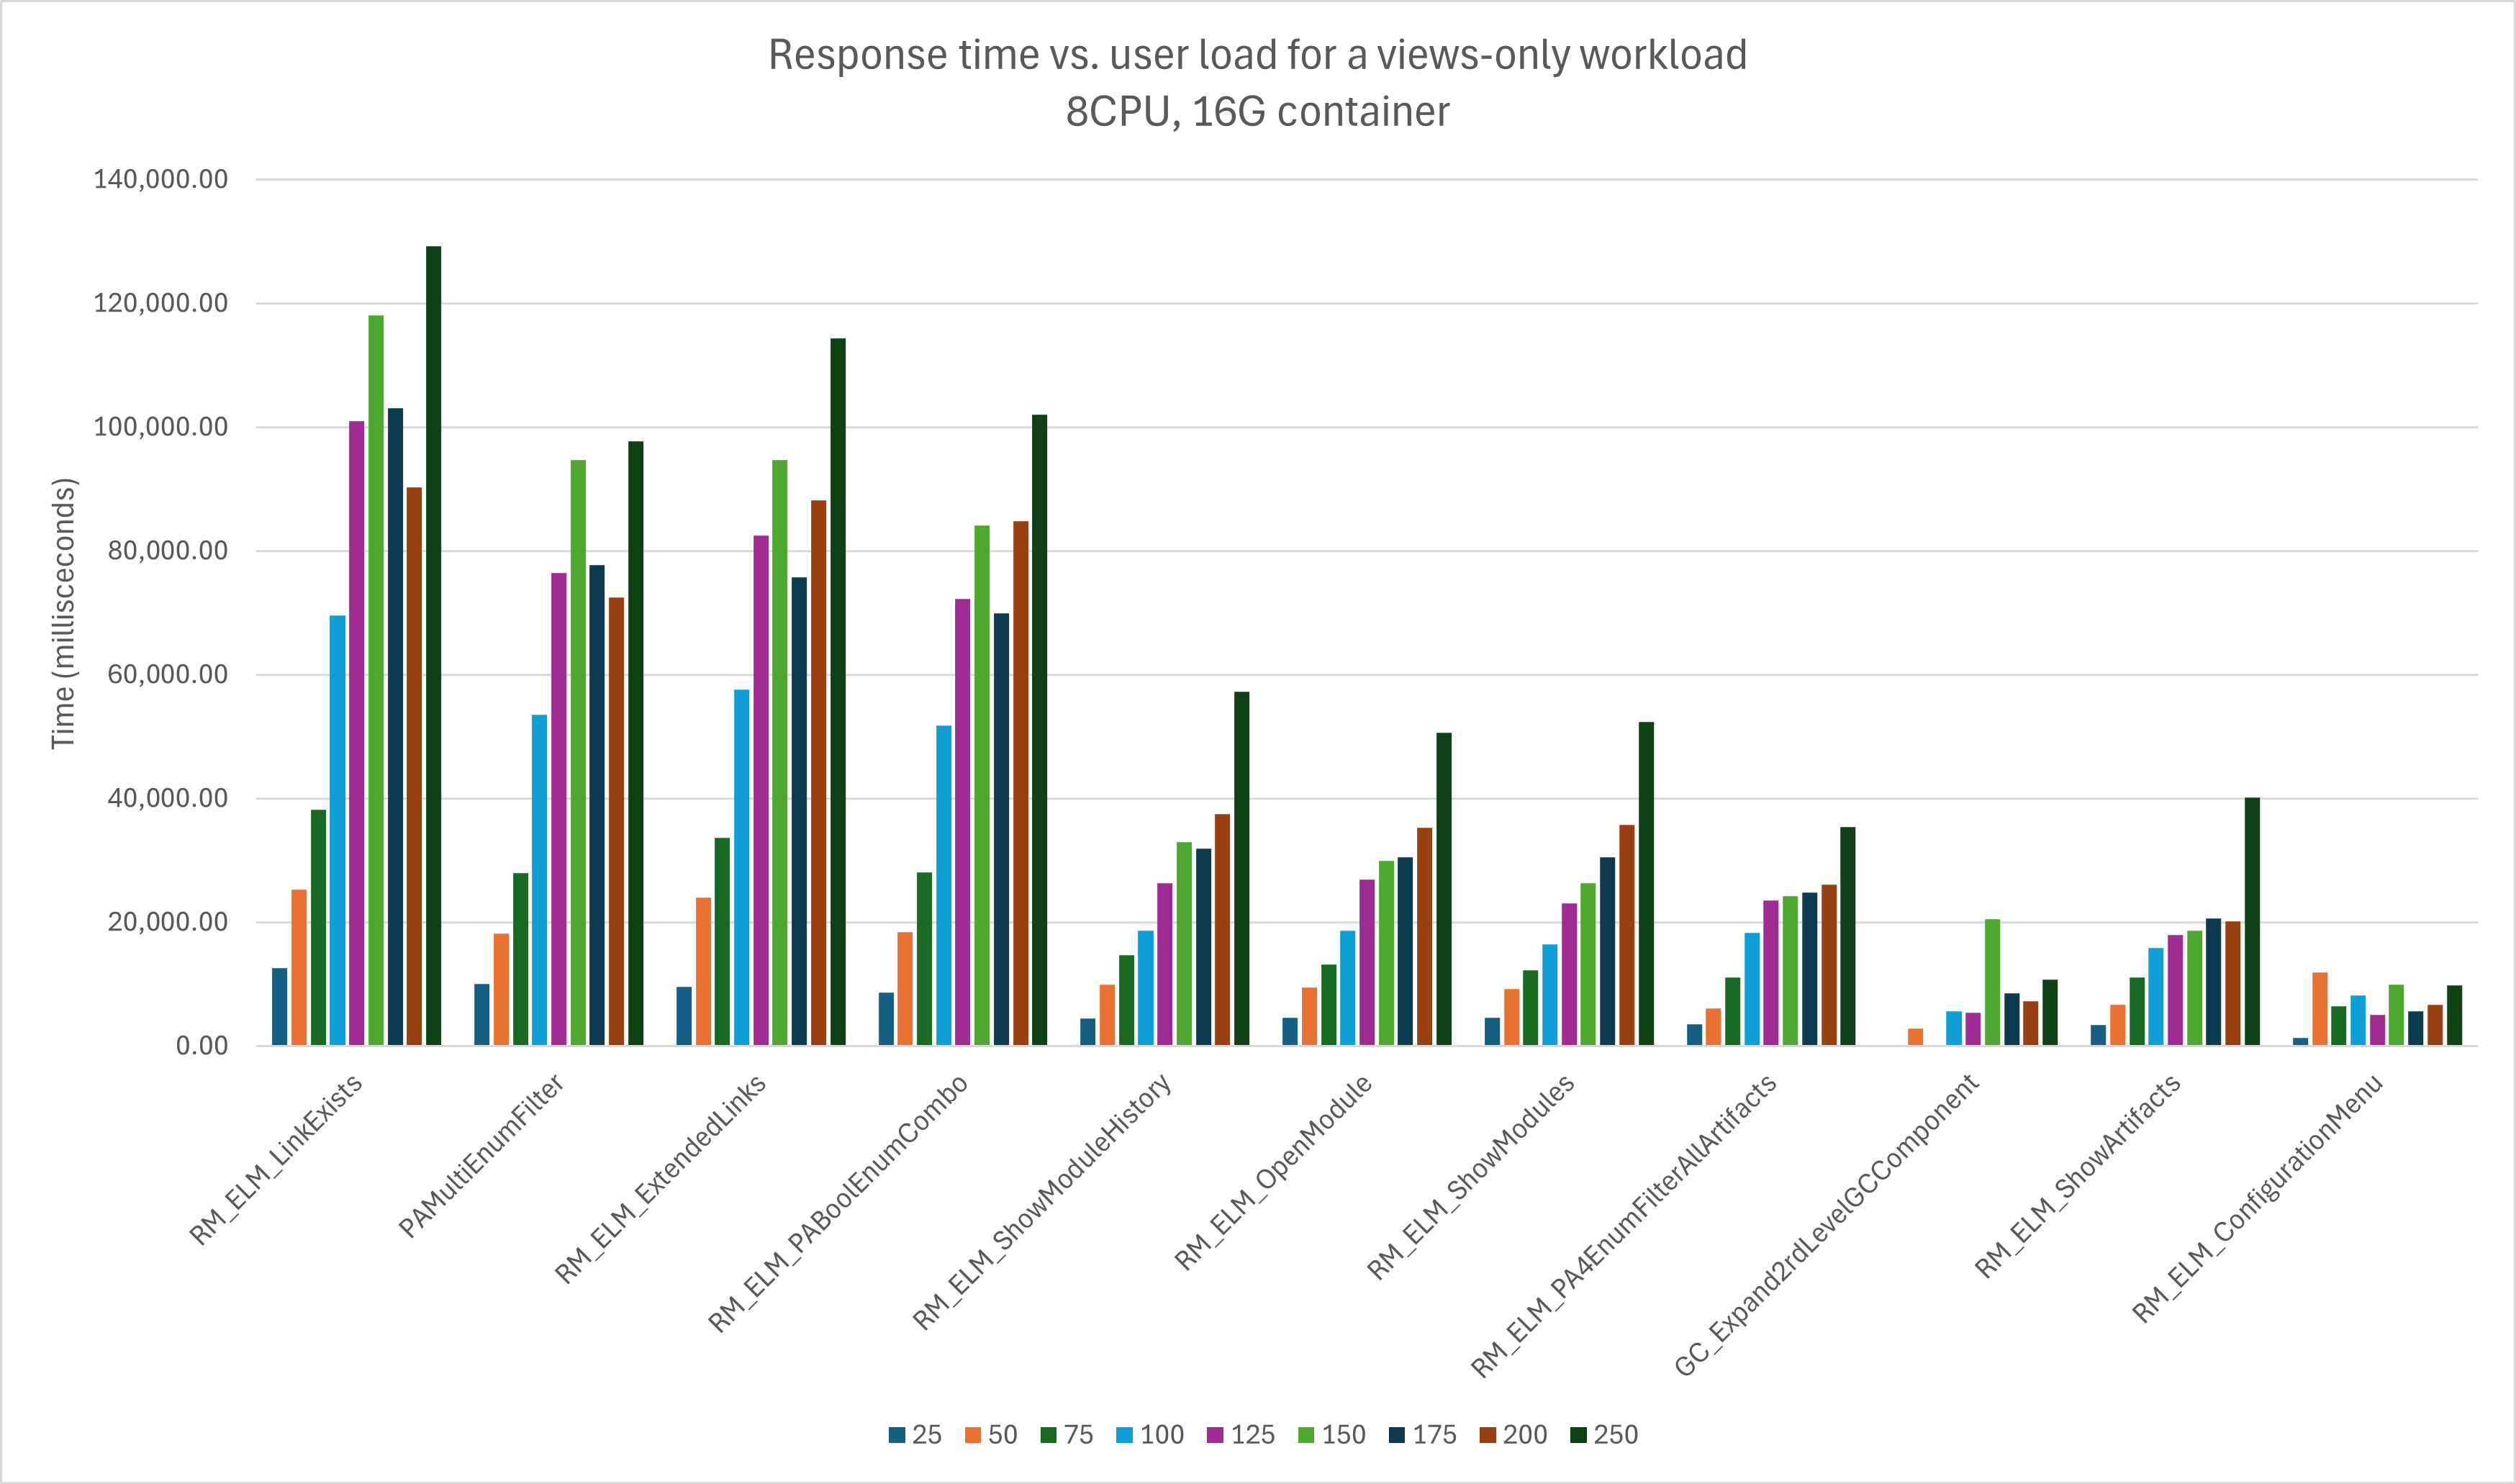
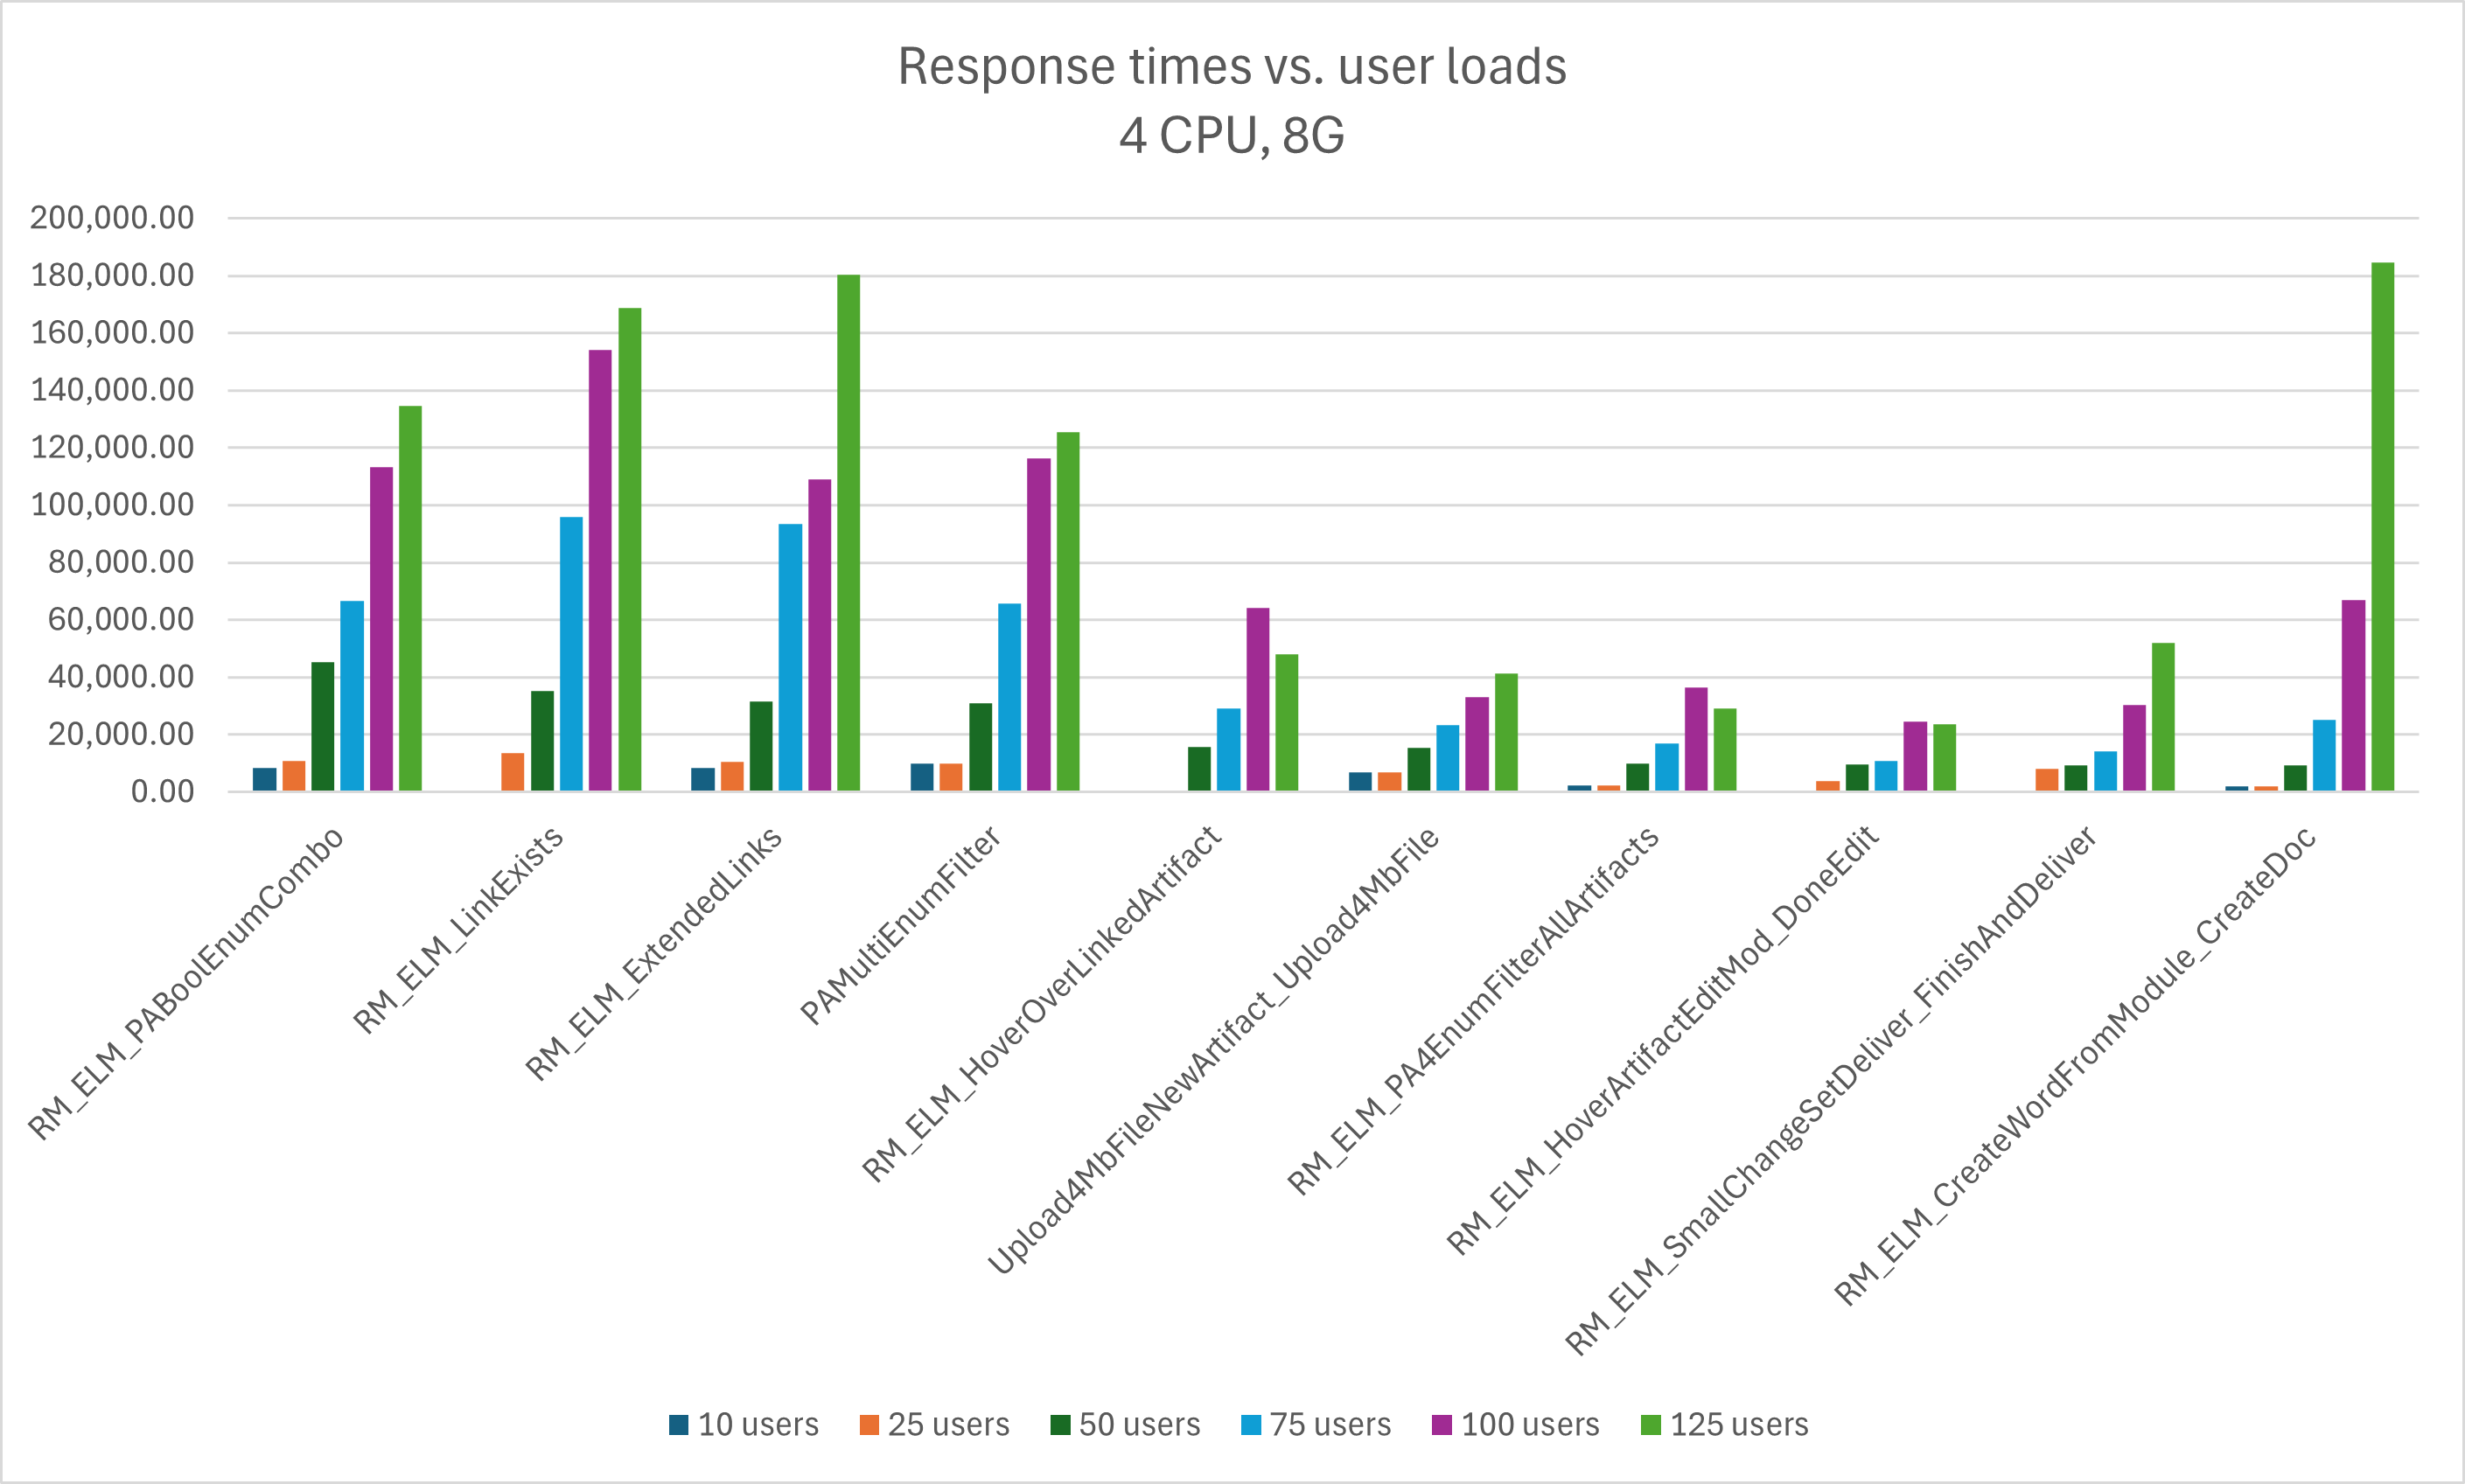
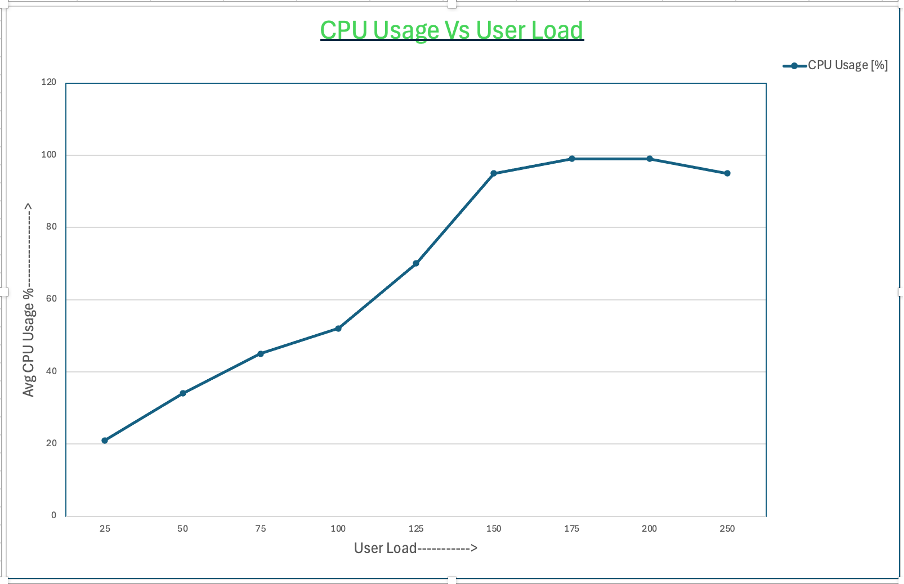
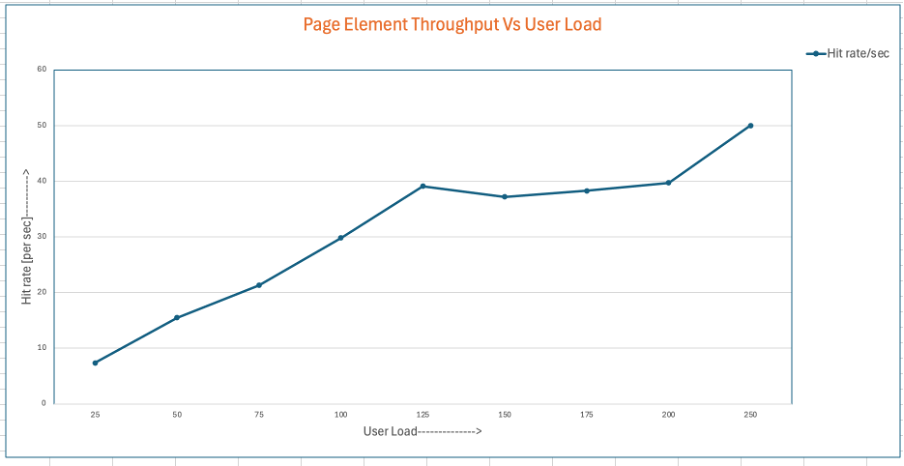
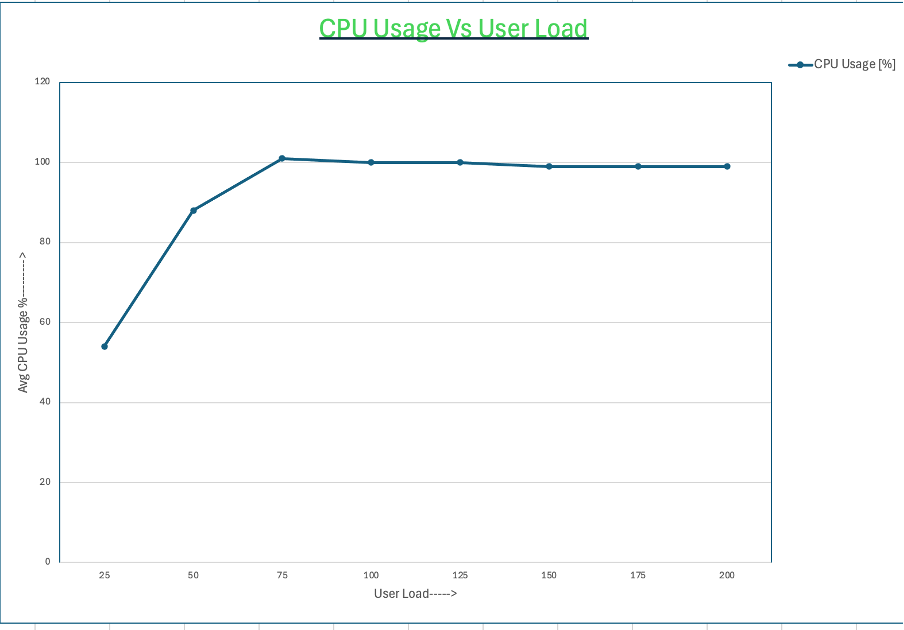
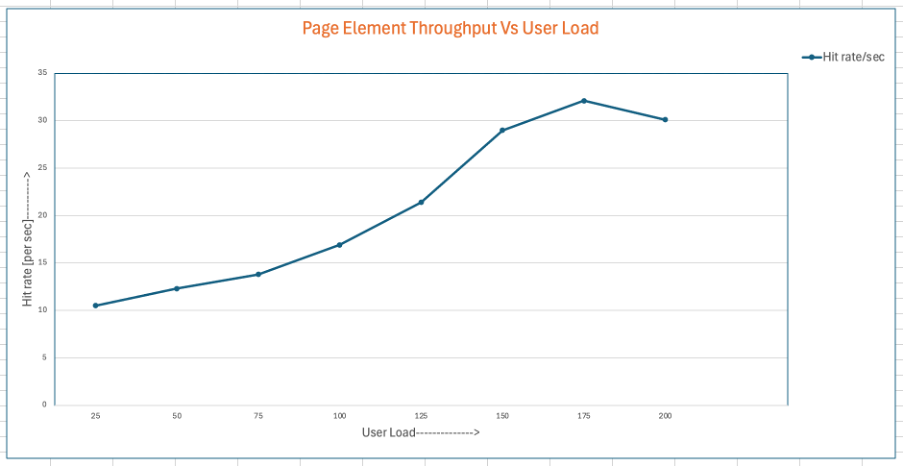
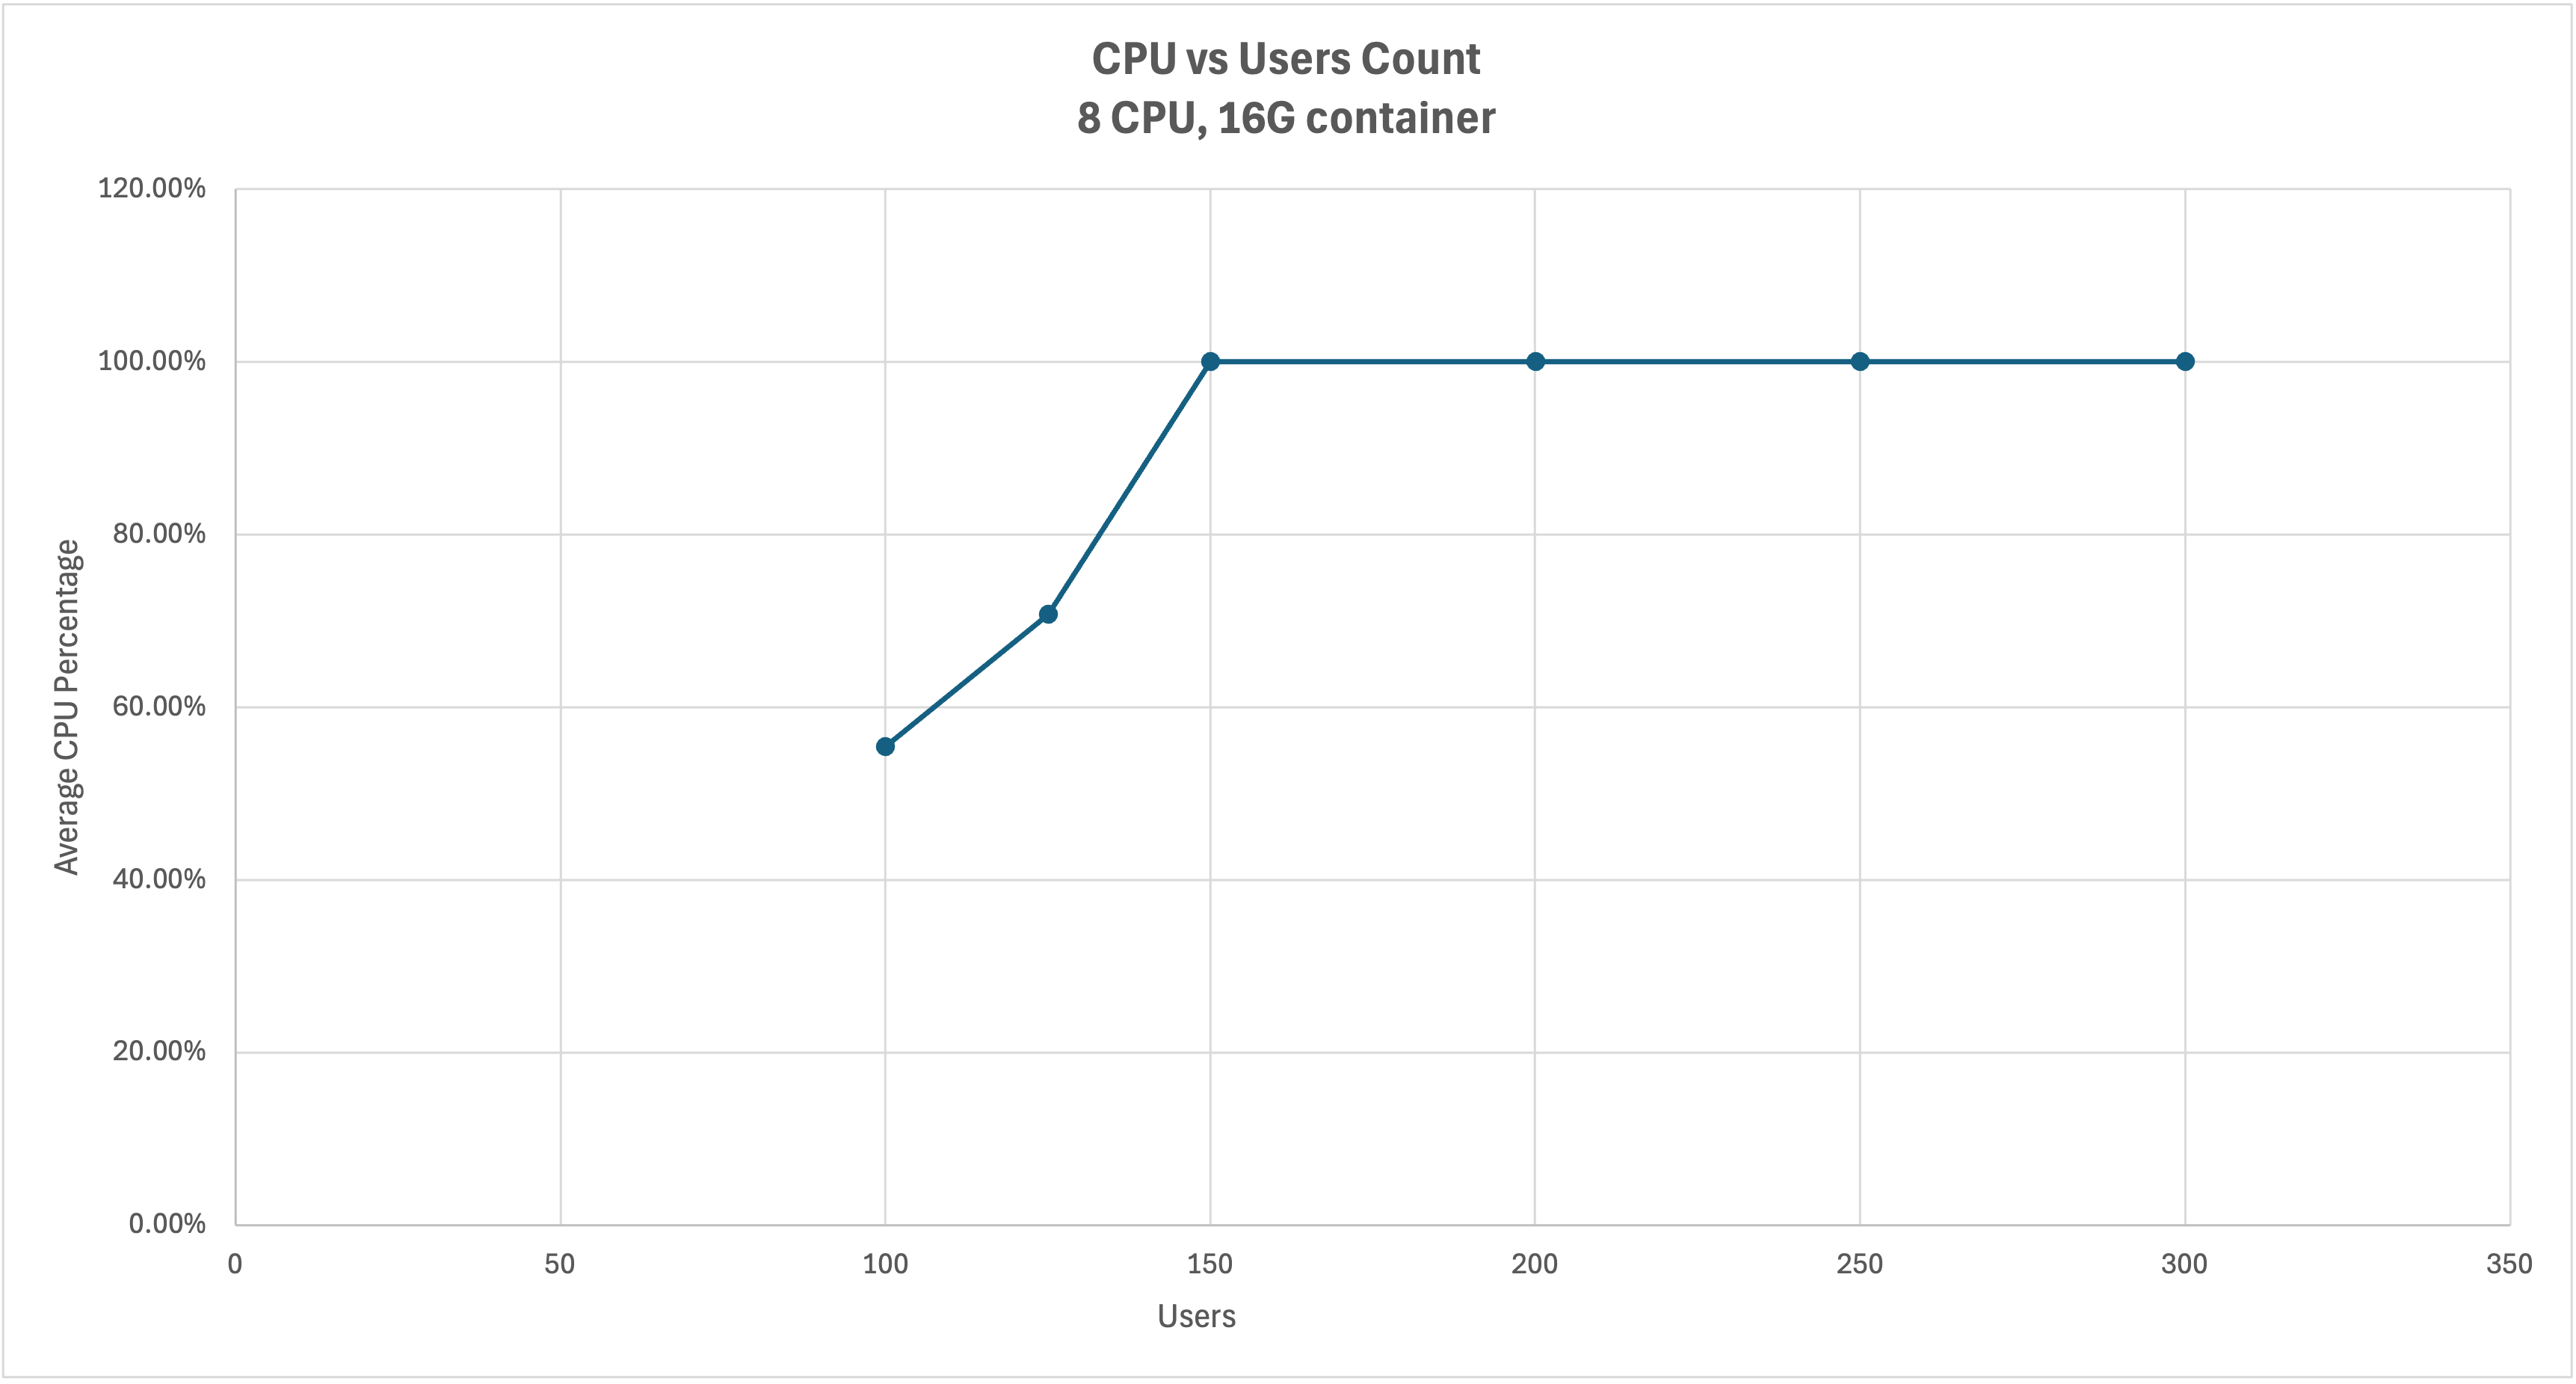
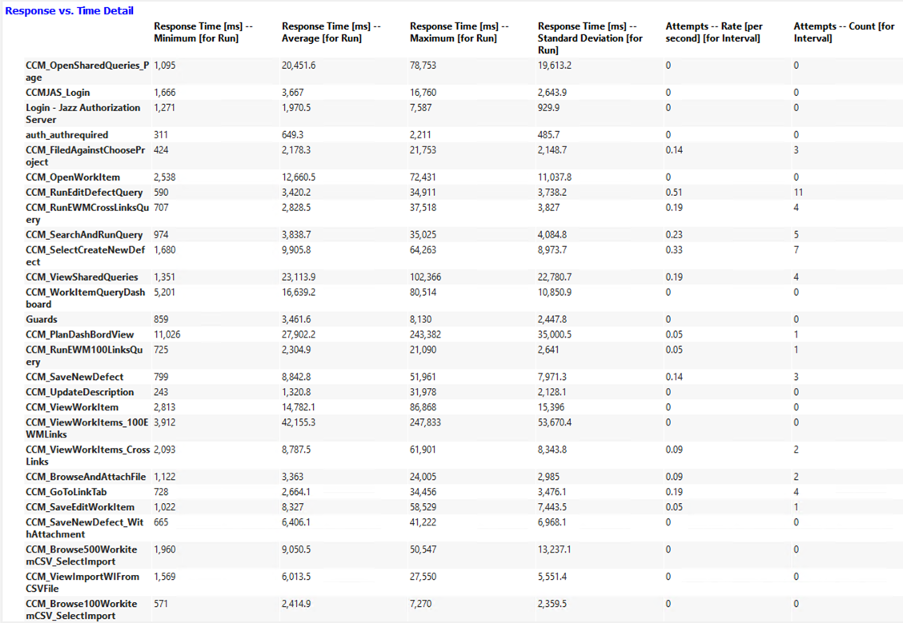
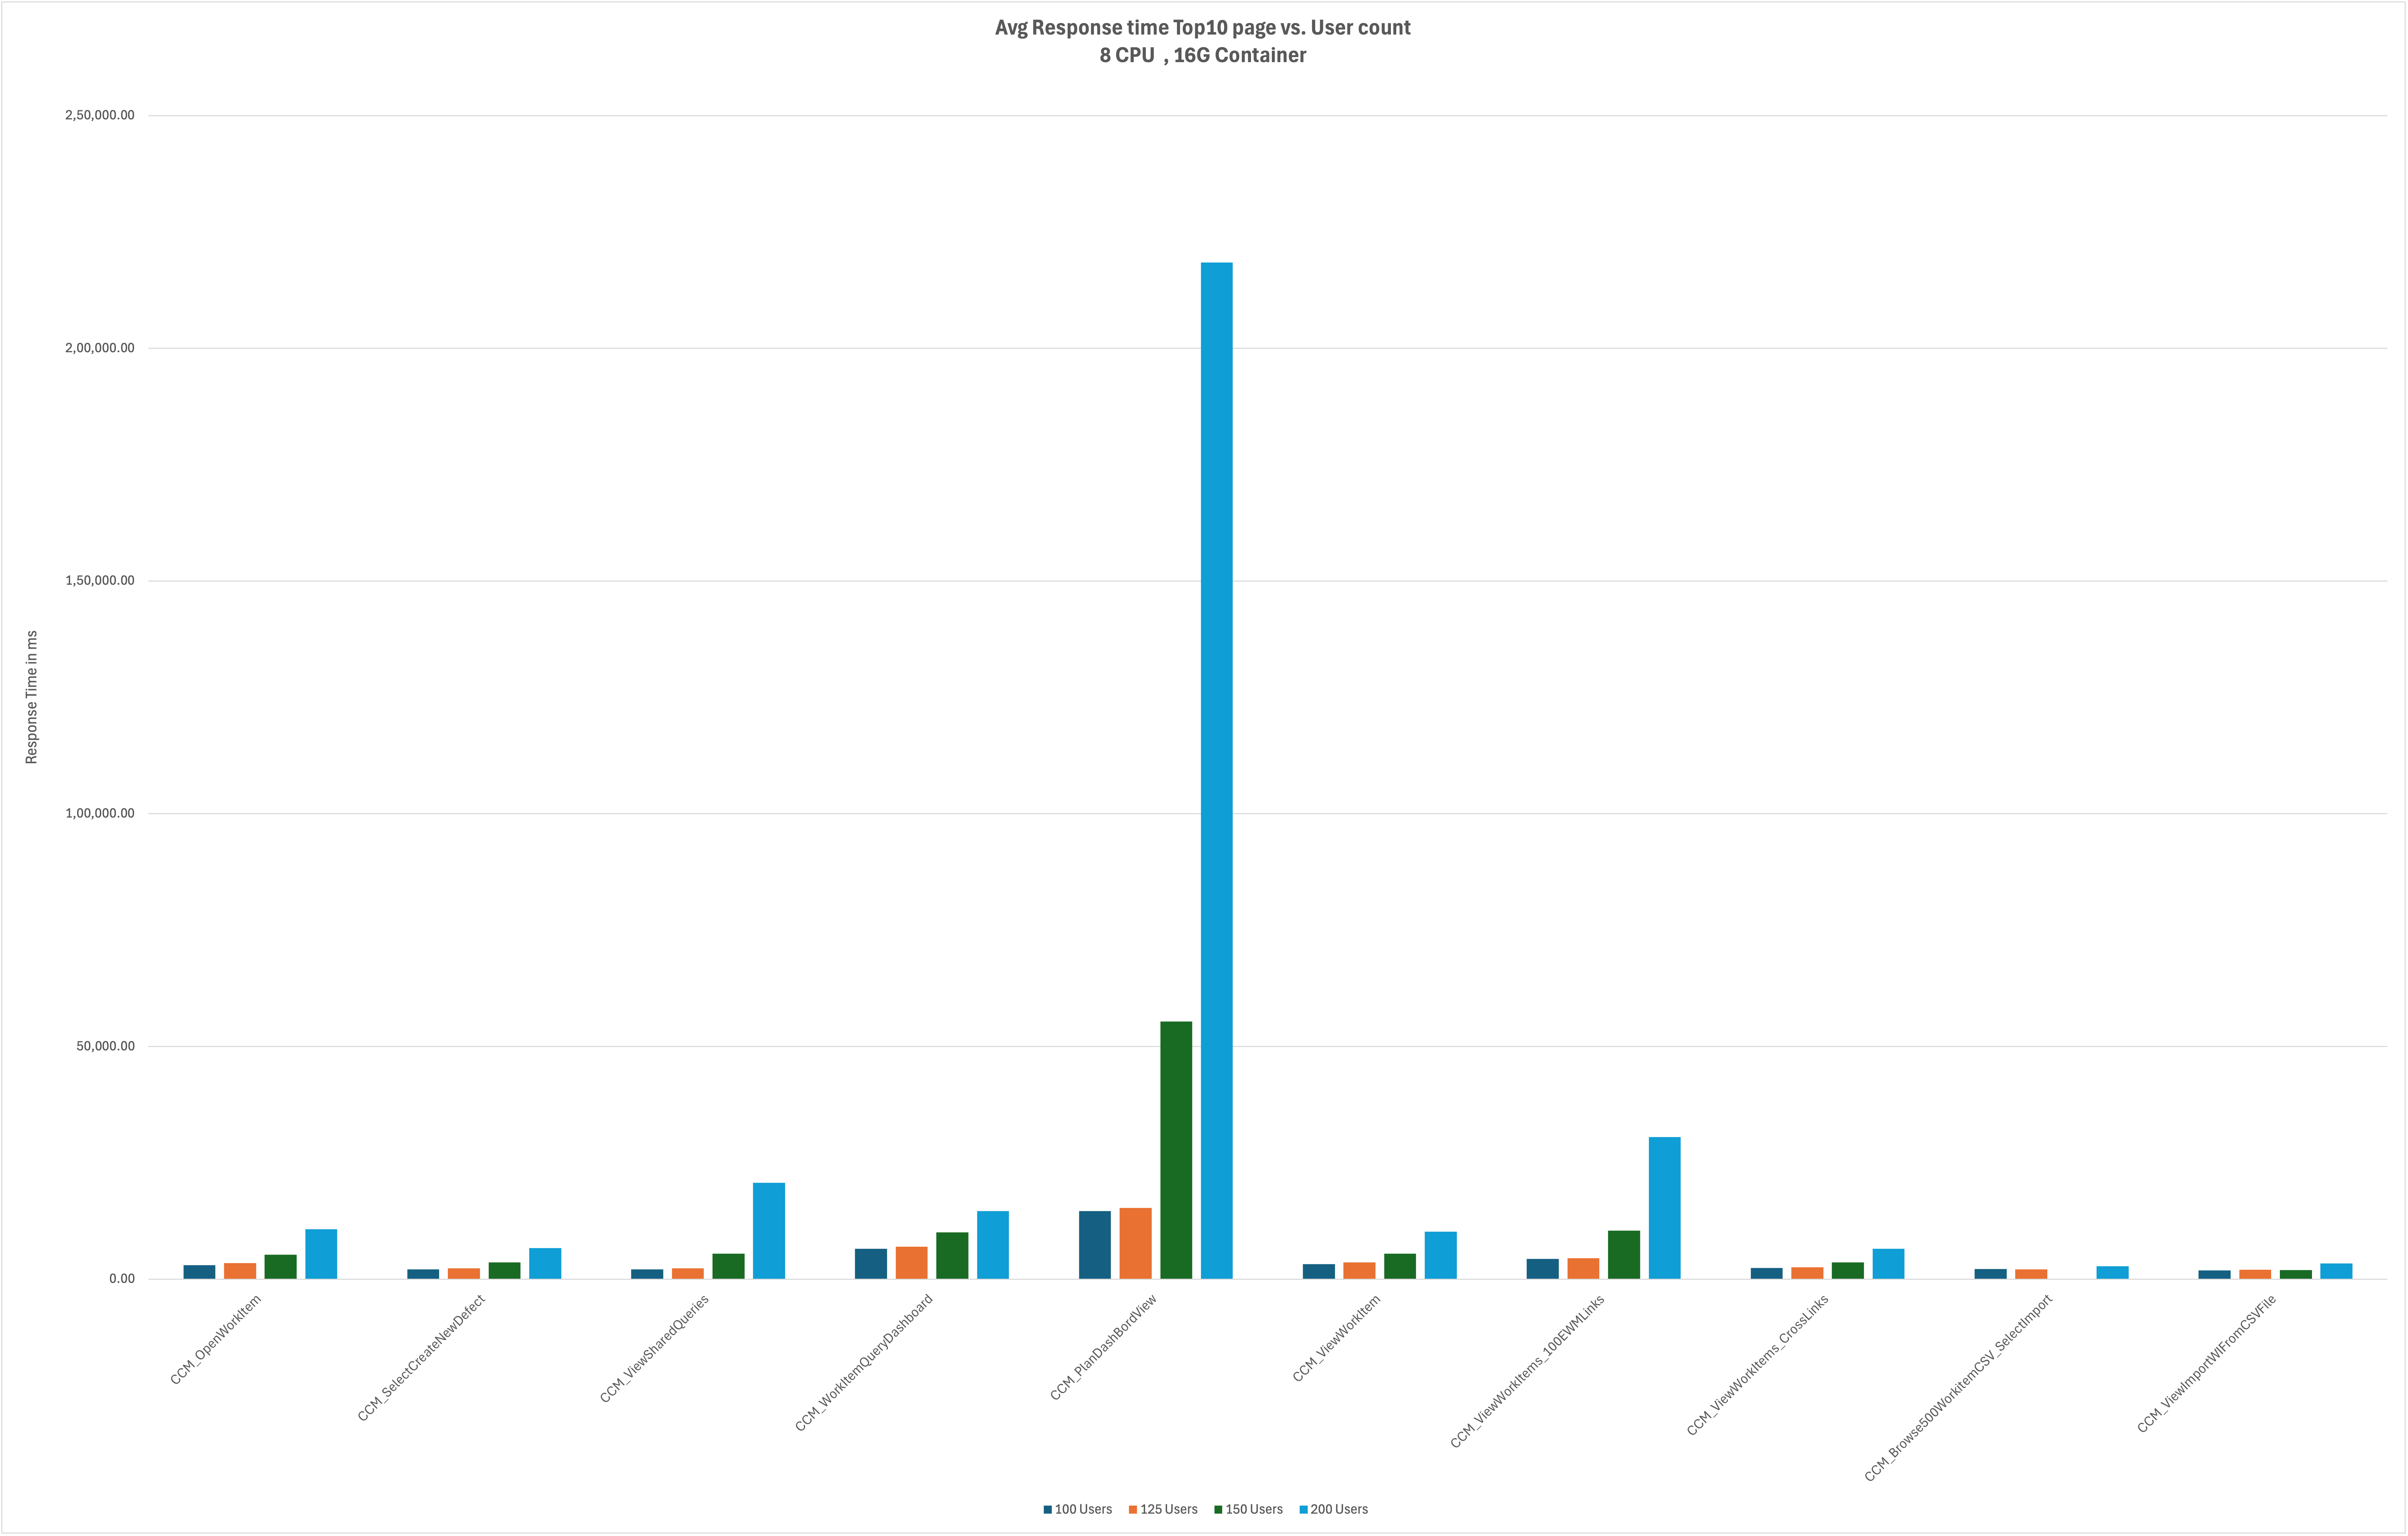
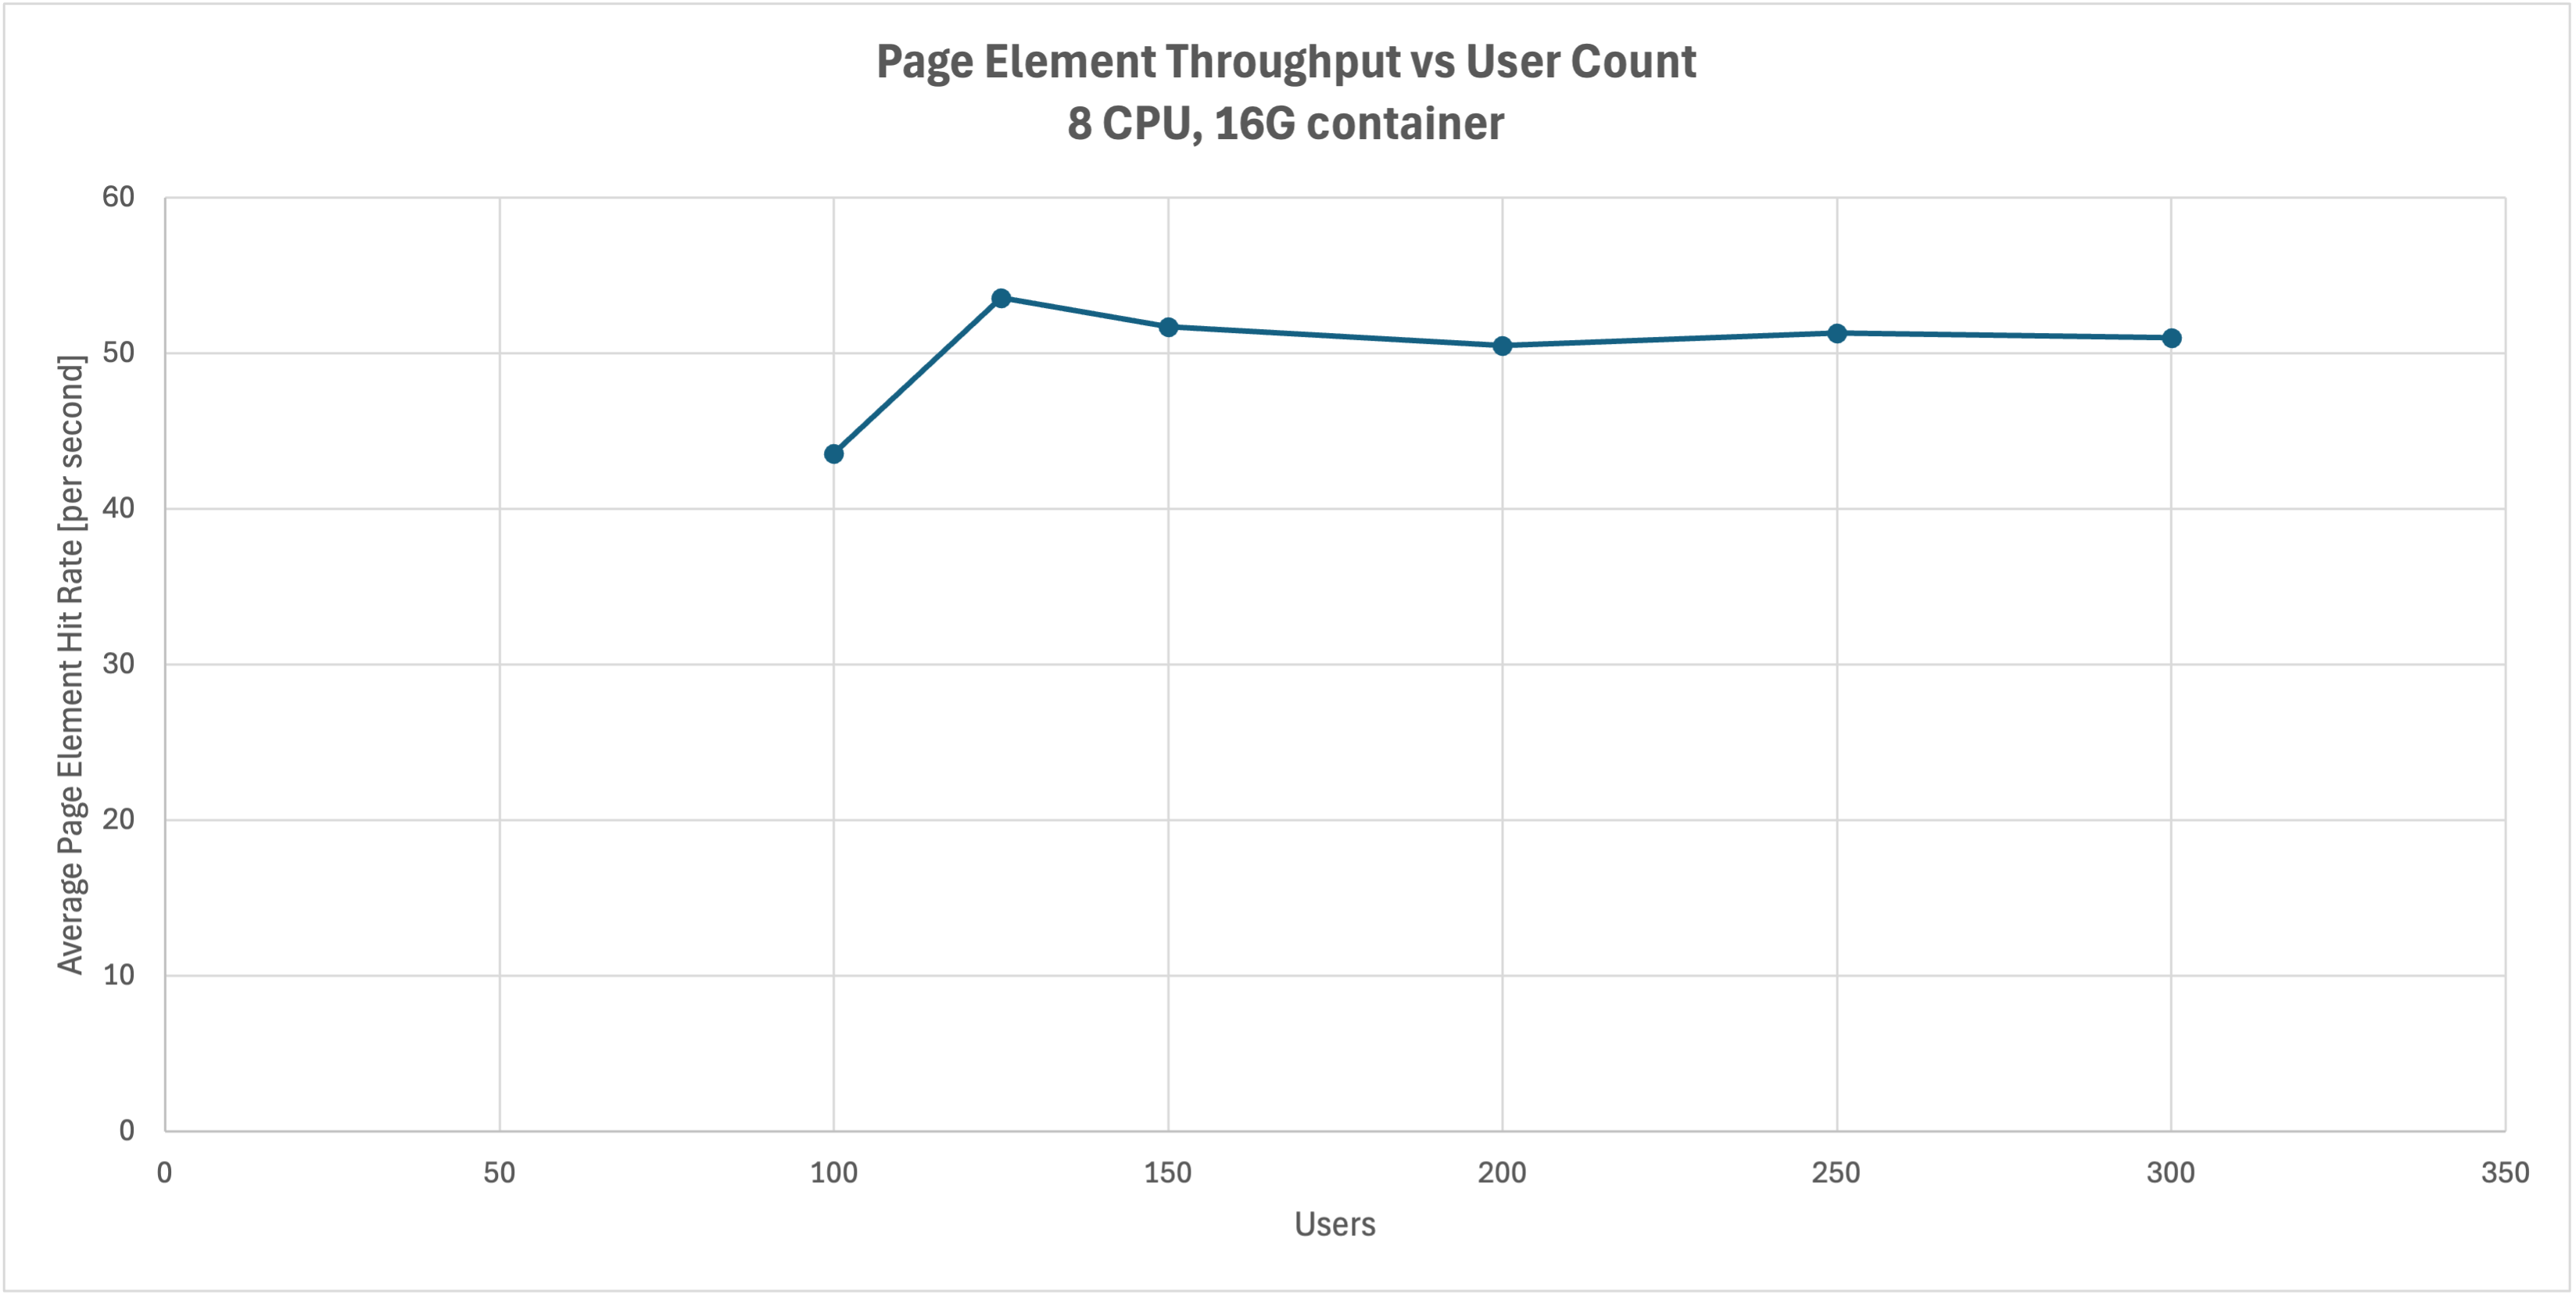
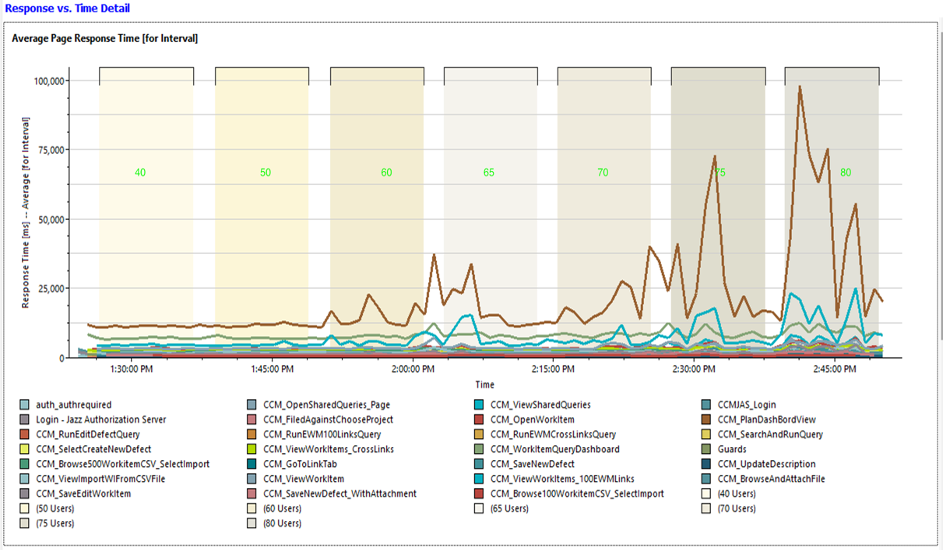
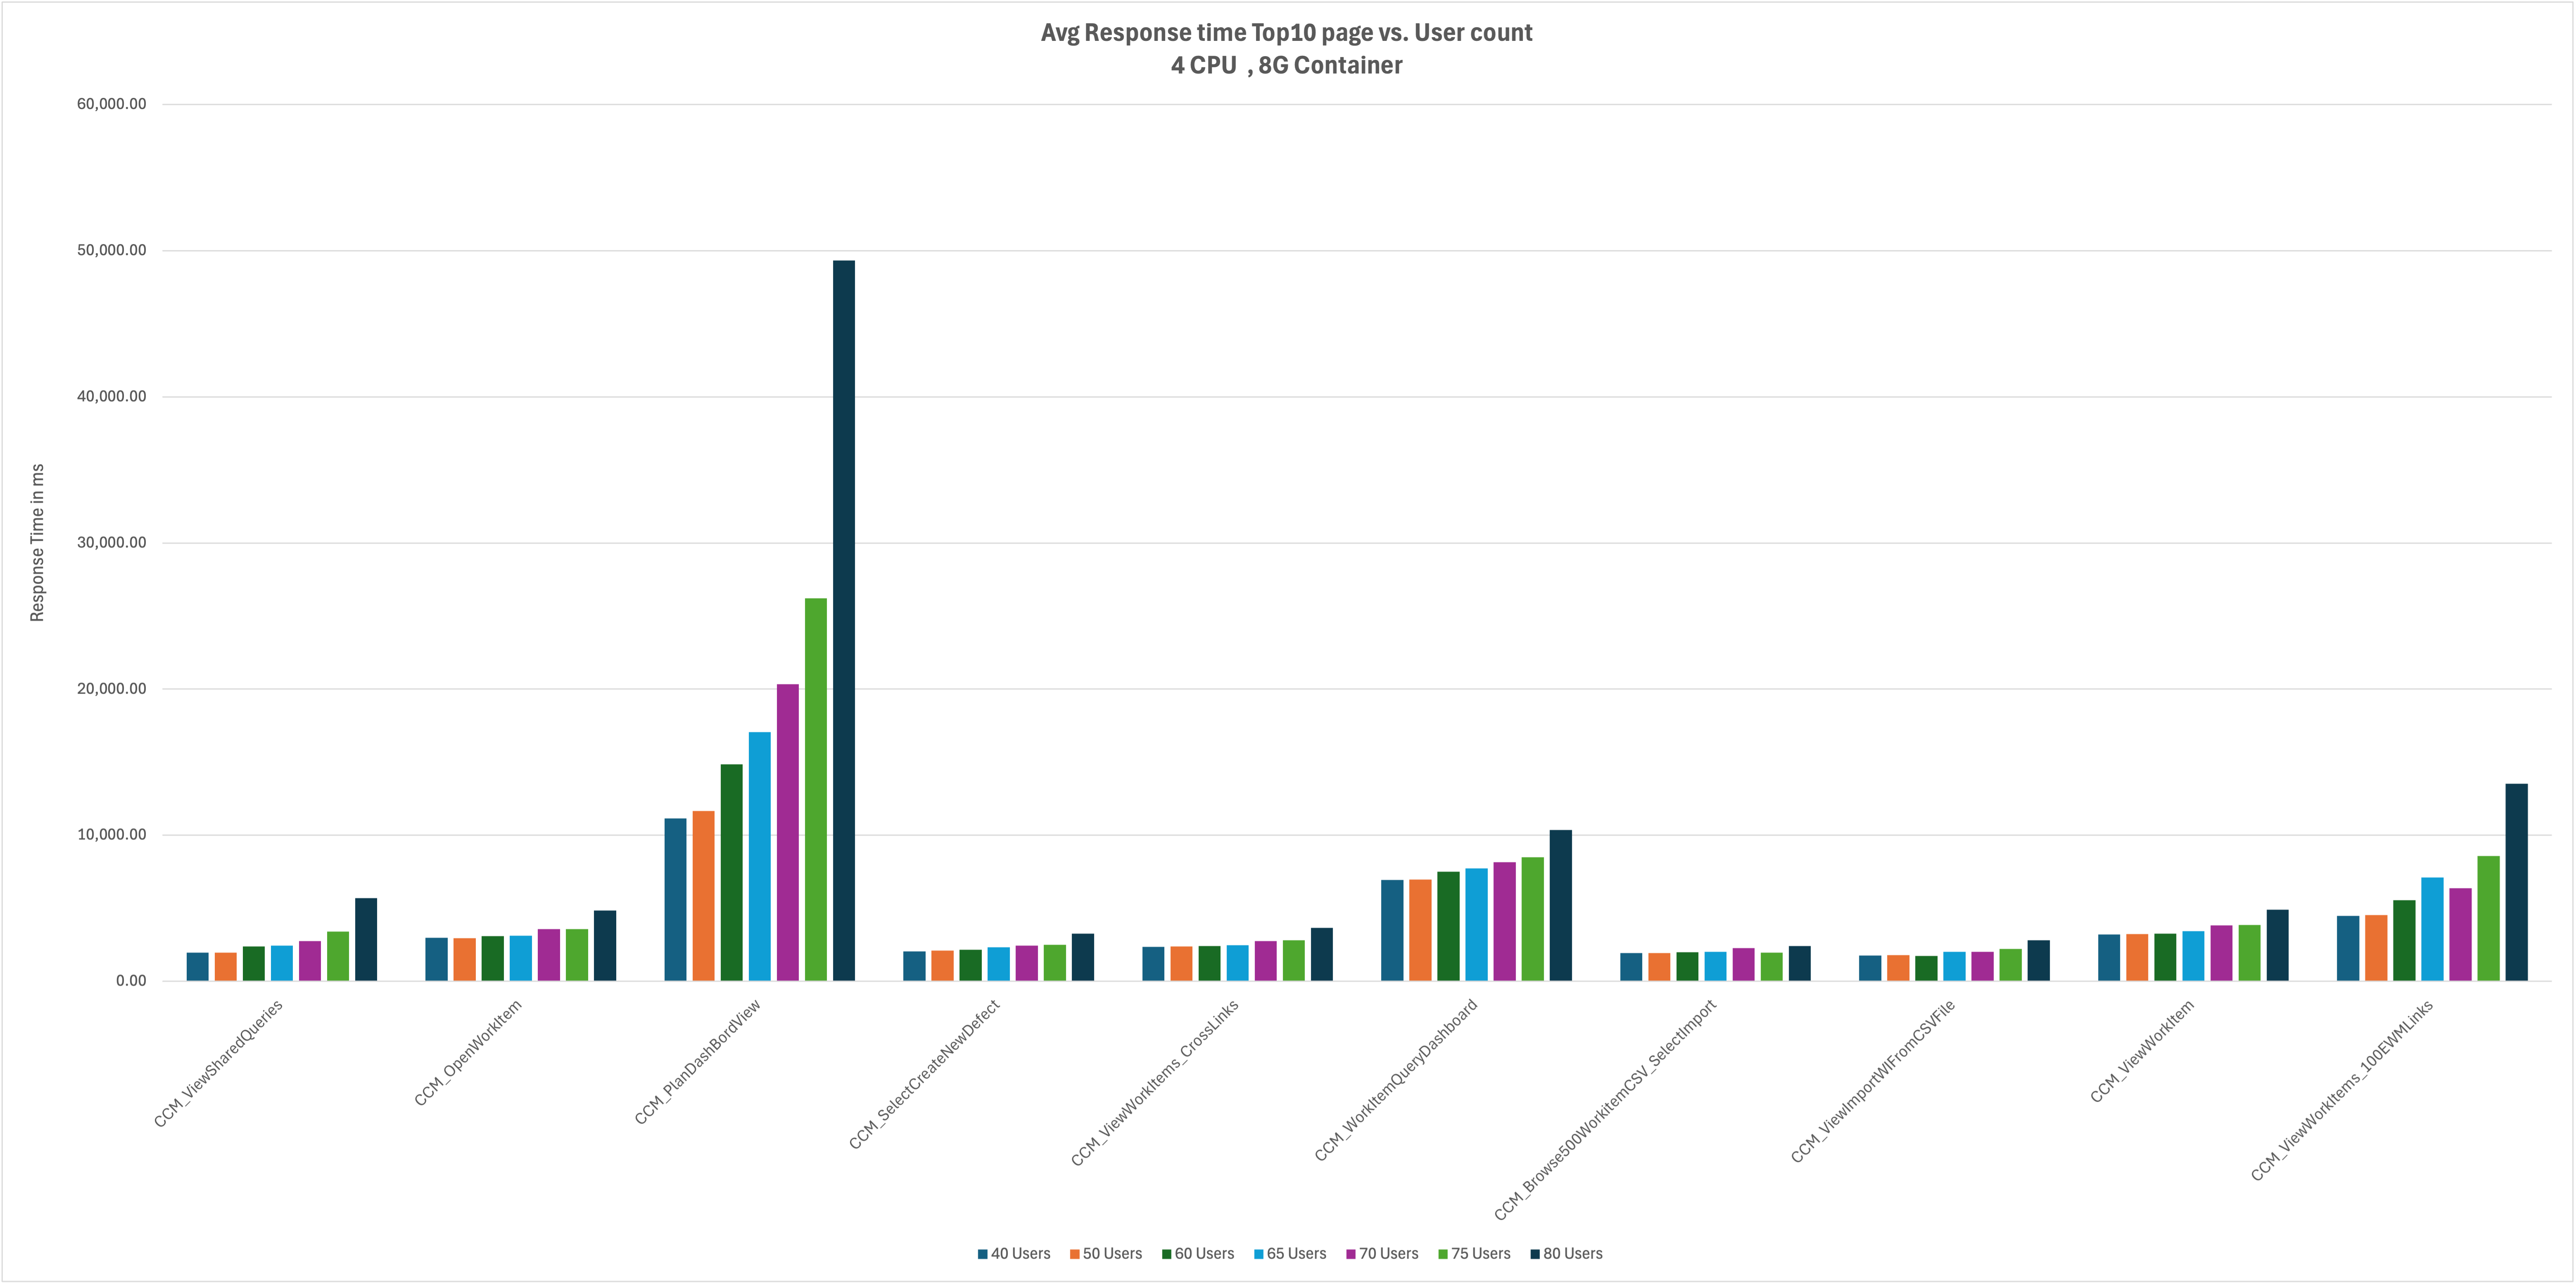
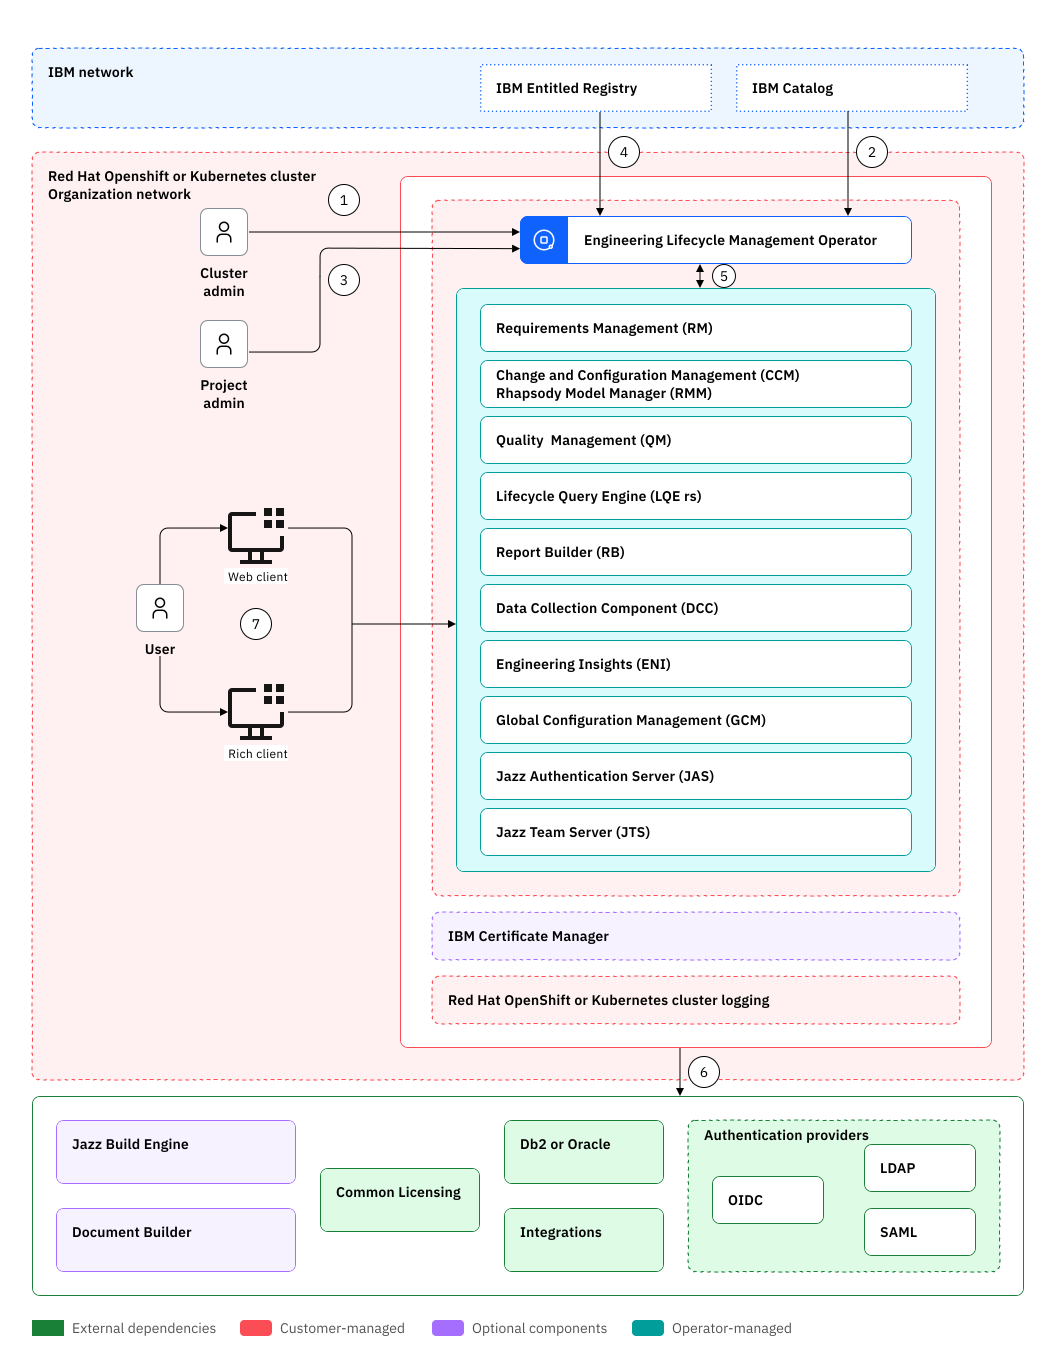
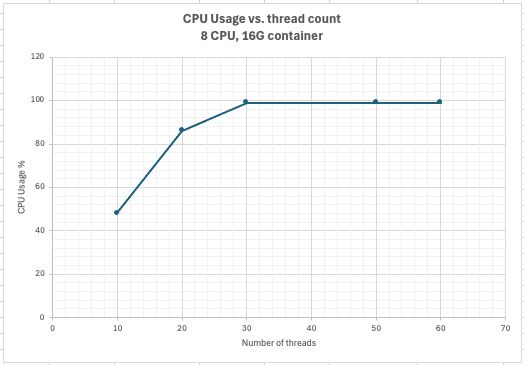
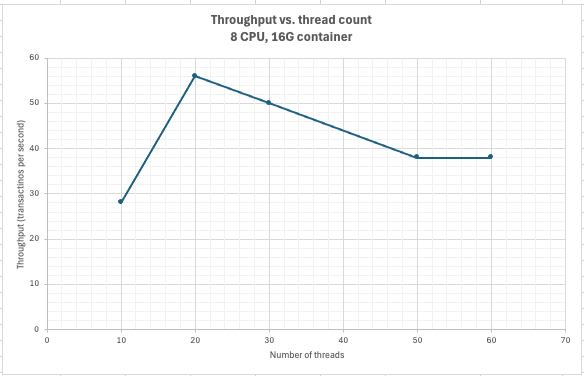
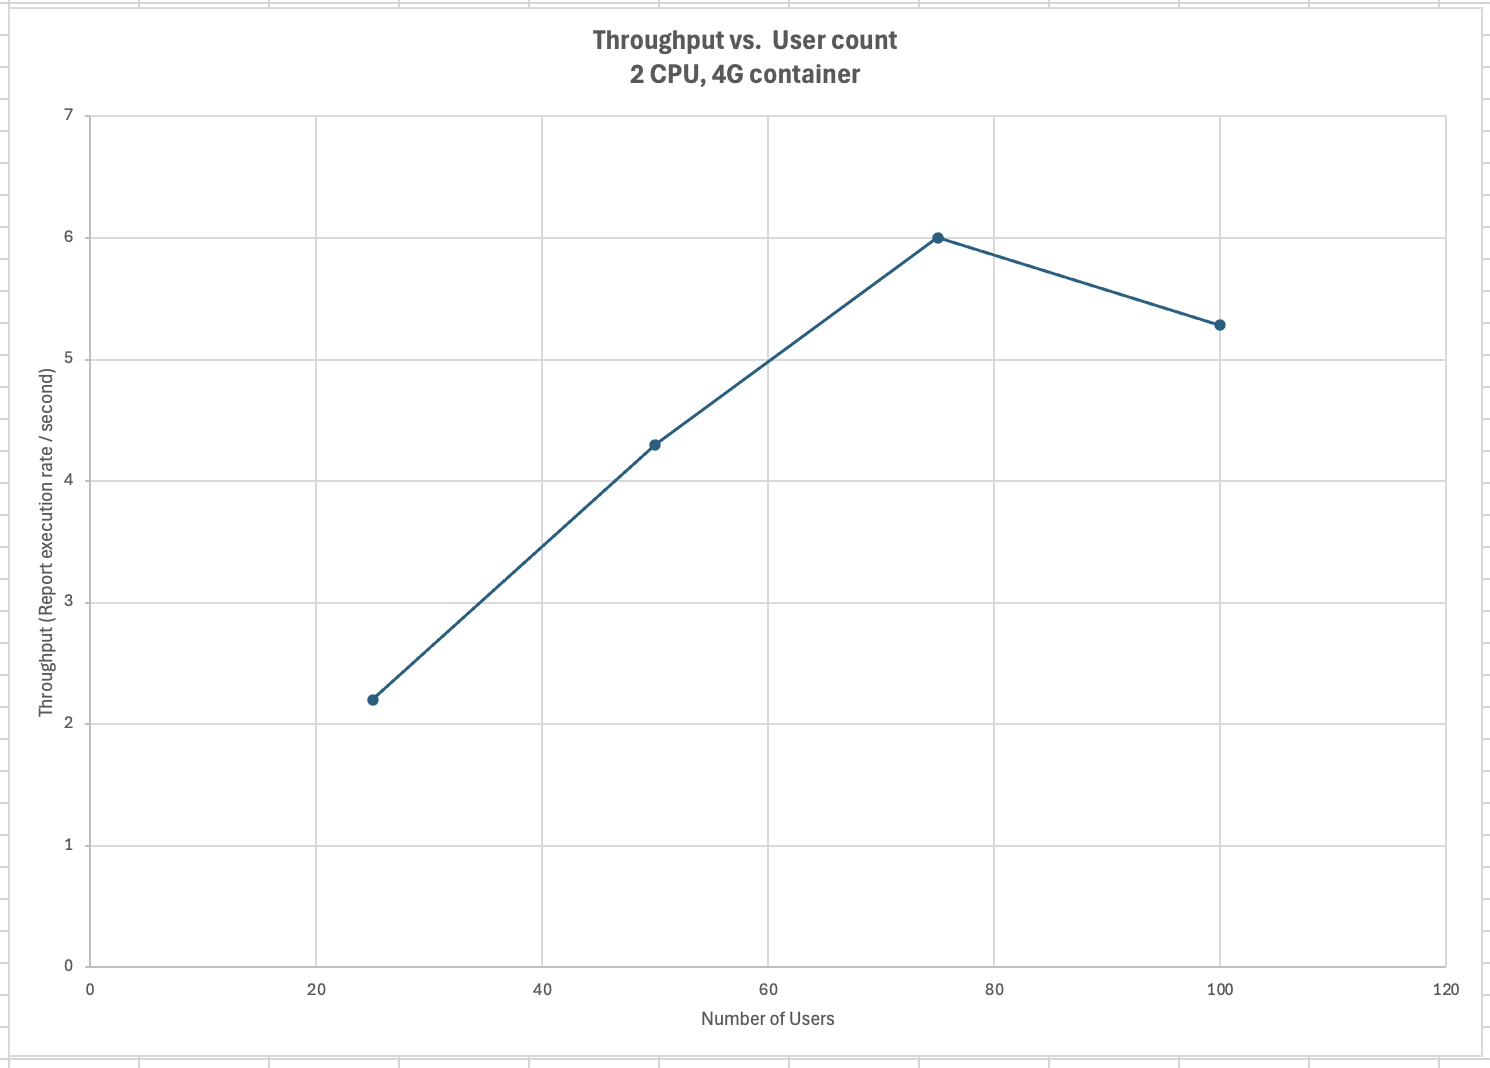
<div id="header-title" style="padding: 10px 15px; border-width:1px; border-style:solid; border-color:#FFD28C; background-image: url(<nop>https://jazz.net/wiki/pub/Deployment/WebPreferences/TLASE.jpg); background-size: cover; font-size:120%"> ---+!! Load testing for ELM on Hybrid Cloud v1.0<img src="https://jazz.net/wiki/pub/Deployment/WebPreferences/todo.png" alt="todo.png" width="50" height="50" align="right"> %DKGRAY% Authors: Main.VaughnRokosz, Main.SameerkumarKalaria, Main.RamnarayanKumar, Main.JayrajsinhGohil, Main.PriyankaKarande, Main.AjayTaran<br> Build basis: 7.1 %ENDCOLOR%</div></sticky> <!-- Page contents top of page on right hand side in box --> <sticky><div style="float:right; border-width:1px; border-style:solid; border-color:#DFDFDF; background-color:#F6F6F6; margin:0 0 15px 15px; padding: 0 15px 0 15px;"> %TOC{title="Page contents"}% </div></sticky> <sticky><div style="margin:15px;"></sticky> ---+ Introduction IBM® Engineering Lifecycle Management (ELM) consists of a set of interconnected web applications on multiple physical or virtual server instances. Engineering Lifecycle Management on Hybrid Cloud v1.0 provides [[https://www.redhat.com/en/topics/containers/whats-a-linux-container][containers]] of ELM applications coupled with an operator that offers the ability to quickly deploy ELM on any of the following environments: * Red Hat® !OpenShift® cluster platform (on-premise) * Red Hat !OpenShift cluster on IBM Cloud® * IBM Cloud Kubernetes Services * Other !OpenShift or Kubernetes services in private clouds, or on-premises This article provides the results of performance testing for Engineering Lifecycle Management (ELM) applications using the IBM Cloud Kubernetes service. The objectives of the performance testing were to: * Verify container sizes for small and medium deployments per the [[https://jazz.net/wiki/bin/view/Deployment/ELMSizingOverview71][ELM 7.1 sizing overview]] * Identify bottlenecks ---++ Summary of results The supported user loads for the applications are shown below. In this table, the "Model" column is the number of users defined for the small and medium deployments in the [[https://jazz.net/wiki/bin/view/Deployment/ELMSizingOverview71][ELM 7.1 sizing overview]]. The "Actual" column is the user loads that could be handled during the testing. Higher user loads can be tolerated but response times will be degraded. <img src="https://jazz.net/wiki/pub/Deployment/ELMPerformanceOnCloud/SizingSummary.png" width="350"/> The limiting factor is the number of CPUs assigned to the container. Once the CPU usage reaches 100%, response times degrade. For Report Builder, disk speed is also a bottleneck. Abbreviations: * JTS: Jazz Team Server * JAS: Jazz Authorization Server * GCM: Global Configuration Management * EWM: Engineering Workflow Management * ERM: Engineering Requirements Management DOORS Next * ETM: Engineering Test Management * Jazz Reporting components * DCC: Data Collection Component (part of Jazz Reporting Service) * RB: Report Builder (part of Jazz Reporting Service) * LQE rs: Lifecycle Query Engine (Relational store) * LDX rs: Link Index Provider (Relational store) - service provided by LQE in ELM on HC v1.0 * PUB: PUB Document Builder * ENI: Engineering Lifecycle Optimization - Engineering Insights ---++!! Standard disclaimer %INCLUDE{"PerformanceDatasheetDisclaimerEndToEnd"}% ---++ Test environment The high level architecture for Engineering Lifecycle Management on Hybrid Cloud is shown below. <img src="https://jazz.net/wiki/pub/Deployment/ELMPerformanceOnCloud/HybridCloudArchitecture.png" width="900"/> The performance test environment was an instance of this architecture hosted in the IBM Cloud, using the IBM Cloud Kubernetes service. The Kubernetes cluster was configured with 8 worker nodes. Each worker node was configured with 32 CPU and 128G of RAM. A bare metal database server running Oracle 19c was used for the application databases. This server was configured with 1 terabyte of RAM and 96 CPUs. A RAID array of 16 NVME drives was used for the Oracle storage subsystem. The performance tests focused on the ELM application containers, and applied load to containers of different sizes. The tests did not explicitly test the ELM operator or other parts of the IBM Cloud infrastructure. ---++ Test data The repositories used for testing were of medium size: * 1 million ERM artifacts * 1 million ETM artifacts * 100,000 EWM work items The size of the application databases were: <table border="1" cellpadding="5" cellspacing="0" style="border-collapse: collapse; text-align: center; font-family: Arial, sans-serif; width: 30%;"> <thead> <tr style="background-color: #cc5500; color: white;"> <th>Application</th> <th>Database size (GB)</th> </tr> </thead> <tbody> <tr> <td>ERM DOORS Next</td> <td>240</td> </tr> <tr> <td>LQE</td> <td>203</td> </tr> <tr> <td>EWM</td> <td>98</td> </tr> <tr> <td>ETM</td> <td>67</td> </tr> </tbody> </table> ---+ ERM container testing This section provides analysis of the performance testing conducted for IBM Engineering Requirements Management DOORS Next. Two configurations were tested: * A small container (4 CPUs, 8G RAM) * A medium container (8 CPUs, 16G RAM) ---++!! Workload description Two workloads were used in the testing: * A standard workload that simulates a wide range of ERM operations * A views-only workload that simulates opening module views with varying filters There were two variants of each of these workloads: one with link validity enabled, and one with link validity disabled. All workloads were executed in a global configuration having 250 contributions. ---++ Summary of results The test results are summarized below: <table border="1" cellpadding="5" cellspacing="0" style="border-collapse: collapse; text-align: center; font-family: Arial, sans-serif; width: 50%;"> <thead> <tr style="background-color: #cc5500; color: white;"> <th><b>Workload</b></th> <th><b>Link Validity</b></th> <th><b>Small (4CPU, 8G RAM)</b></th> <th><b>Medium (8CPU, 16G RAM)</b></th> </tr> </thead> <tbody> <tr> <td><b>Standard</b></td> <td>Enabled</td> <td>25 users</td> <td>125 users</td> </tr> <tr> <td><b>Standard</b></td> <td>Disabled</td> <td>50 users</td> <td>200 users</td> </tr> <tr> <td><b>Views only</b></td> <td>Enabled</td> <td>25 users</td> <td>50 users</td> </tr> <tr> <td><b>Views only</b></td> <td>Disabled</td> <td>50 users</td> <td>100</td> </tr> </tbody> </table> <br> The bottleneck is CPU. Adding more CPUs allows the container to support a higher user load. <br> Note that the workloads simulate opening module views that display link columns. If link validity is enabled, there is additional CPU load and the max user load is slightly lower than when link validity is disabled. ---++ Small container The small ERM container was configured with 4 CPUs and 8G of RAM. ---+++!! Performance analysis - standard workload The test results from executing the standard workload are shown below. <ol> <li><b>Performance Stability</b> <ul> <li>Performance degrades (sometimes significantly) when the user load exceeds 25-50 users</li> <li>With link validity disabled, the system performs well until 50-75 users</li> </ul> </li> <li><b>CPU Utilization</b> <ul> <li>CPU reaches 100% between 75 and 100 users</li> </ul> </li> <li><b>Response Time</b> <ul> <li>Response time increases significantly between 25 and 50 users</li> <li>Response time increases significantly between 50 and 75 users when link validity is disabled</li> </ul> </li> <li><b>Throughput</b> <ul> <li>Maximum throughput is 20 transactions per second </ul> </li> <li><b>Conclusion</b> <ul> <li>The small environment can handle workloads up to 25 users (50 users when link validity is disabled). The bottleneck is CPU. </ul> </li> </ol> </body> </html> *CPU* <table border="1" cellpadding="5" cellspacing="0" style="border-collapse: collapse; text-align: center; font-family: Arial, sans-serif; width: 20%;"> <thead> <tr style="background-color: #cc5500; color: white;"> <th>User Load</th> <th>Average CPU Usage</th> <th>CPU Usage Percentage</th> </tr> </thead> <tbody> <tr> <td>10</td> <td>1.35</td> <td>34%</td> </tr> <tr> <td>25</td> <td>2.35</td> <td>59%</td> </tr> <tr> <td>50</td> <td>3.18</td> <td>80%</td> </tr> <tr> <td>75</td> <td>3.79</td> <td>95</td> </tr> <tr> <td>100</td> <td>3.98</td> <td>100%</td> </tr> <tr> <td>125</td> <td>4</td> <td>100%</td> </tr> </tbody> </table> <br> <img src="https://jazz.net/wiki/pub/Deployment/ELMPerformanceOnCloud/ERM_ReadWrite_SmallCPUvsUsers_withLinkValidity.png" width="700"/> *Response Times* Response times increase between 25 and 50 users. At 75 users, when the CPU is 100% utilized, response times for many operations are over 1 minute. <img src="https://jazz.net/wiki/pub/Deployment/ELMPerformanceOnCloud/ERMSmallRespLV.png" width="700"/> *Throughput* <img src="https://jazz.net/wiki/pub/Deployment/ELMPerformanceOnCloud/ERM_ReadWrite_SmallPageElementThroughputVsUserLoad_withLinkValidity.png" width="700"/> ---+++!! Performance analysis - views-only workload The test results from executing a views-only workload are shown below. <ol> <li><b>Performance Stability</b> <ul> <li>Response times are reasonable up to 25 users</li> </ul> </li> <li><b>CPU Utilization</b> <ul> <li>CPU reaches 100% at 75 users.</li> </ul> </li> <li><b>Response Time</b> <ul> <li>Response times for many views are longer than 1 minute at 50 users</li> </ul> </li> <li><b>Conclusion</b> <ul> <li>The small container can handle workloads effectively only up 25 users. If link validity is disabled, the small container can support up to 50 users. CPU is the bottleneck.</li> </ul> </li> </ol> </body> </html> *CPU* <table border="1" cellpadding="5" cellspacing="0" style="border-collapse: collapse; text-align: center; font-family: Arial, sans-serif; width: 20%;"> <thead> <tr style="background-color: #cc5500; color: white;"> <th>User Load</th> <th>Average CPU Usage</th> <th>CPU Usage Percentage</th> </tr> </thead> <tbody> <tr> <td>25</td> <td>2.14</td> <td>54%</td> </tr> <tr> <td>50</td> <td>3.51</td> <td>88%</td> </tr> <tr> <td>75</td> <td>4</td> <td>100</td> </tr> <tr> <td>100</td> <td>3.98</td> <td>100%</td> </tr> <tr> <td>125</td> <td>3.99</td> <td>100%</td> </tr> <tr> <td>150</td> <td>3.97</td> <td>99%</td> </tr> <tr> <td>175</td> <td>3.97</td> <td>99%</td> </tr> <tr> <td>200</td> <td>3.97</td> <td>99%</td> </tr> </tbody> </table> <br> <img src="https://jazz.net/wiki/pub/Deployment/ELMPerformanceOnCloud/ERM_ViewsOnly_SmallCPUvsUsers_withLinkValidity.png" width="700"/> *Response Time* <img src="https://jazz.net/wiki/pub/Deployment/ELMPerformanceOnCloud/ERMSmallViewsResp.png" width="700"/> *Throughput* <img src="https://jazz.net/wiki/pub/Deployment/ELMPerformanceOnCloud/ERM_ViewsOnly_Throughput_withLinkValidity.png" width="700"/> <br> </br> ---++ Medium container The medium container for ERM was configured with 8 CPUs and 16G of RAM. ---+++!! Performance analysis - standard workload <ol> <li><b>Performance Stability</b> <ul> <li>Response times are stable up to 125 users </li> <li>Some operations (especially view loading) are degraded at 150 users</li> </ul> </li> <li><b>CPU Utilization</b> <ul> <li>CPU reaches 100% between 150 and 175users</li> </ul> </li> <li><b>Throughput</b> <ul> <li>Throughput reaches a maximum of 40 transactions per second at 125 users</li> </ul> </li> <li><b>Conclusion</b> <ul> <li>The medium container can handle workloads up to 125 users. If link validity is disabled, the medium container can handle 200 users.</li> </ul> </li> </ol> </body> </html> *CPU* <table border="1" cellpadding="5" cellspacing="0" style="border-collapse: collapse; text-align: center; font-family: Arial, sans-serif; width: 20%;"> <thead> <tr style="background-color: #cc5500; color: white;"> <th>User Load</th> <th>Average CPU Usage</th> <th>Percentage</th> </tr> </thead> <tbody> <tr> <td>25</td> <td>1.64</td> <td>21%</td> </tr> <tr> <td>50</td> <td>2.69</td> <td>34%</td> </tr> <tr> <td>75</td> <td>3.56</td> <td>45%</td> </tr> <tr> <td>100</td> <td>4.18</td> <td>52%</td> </tr> <tr> <td>125</td> <td>5.56</td> <td>70%</td> </tr> <tr> <td>150</td> <td>7.6</td> <td>95%</td> </tr> <tr> <td>175</td> <td>7.88</td> <td>99%</td> </tr> <tr> <td>200</td> <td>7.9</td> <td>99%</td> </tr> <tr> <td>250</td> <td>7.6</td> <td>95%</td> </tr> </tbody> </table> <br> <img src="https://jazz.net/wiki/pub/Deployment/ELMPerformanceOnCloud/ERM_ReadWrite_MediumCPUvsUsers_withLinkValidity.png" width="700"/> *Response Time* <img src="https://jazz.net/wiki/pub/Deployment/ELMPerformanceOnCloud/ERMMedStandardRespTime.png" width="700"/> *Throughput* <img src="https://jazz.net/wiki/pub/Deployment/ELMPerformanceOnCloud/ERM_ReadWrite_MediumPageElementThroughputVs-UserLoad_withLinkValidity.png" width="700"/> ---+++!! Performance analysis - views-only workload <ol> <li><b>Performance Stability</b> <ul> <li>Response times degrade as the load increases, with some operations taking over a minute above 75 users</li> </ul> </li> <li><b>CPU Utilization</b> <ul> <li>CPU reaches 100% between 150 and 175 users</li> </ul> </li> <li><b>Throughput</b> <ul> <li>Throughput levels out at 28 transactions per second at 100 users</li> </ul> </li> <li><b>Conclusion</b> <ul> <li>The medium container environment can between 50 and 75 users when running a workload consisting of view loading</li> </ul> </li> </ol> </body> </html> *CPU* <table border="1" cellpadding="5" cellspacing="0" style="border-collapse: collapse; text-align: center; font-family: Arial, sans-serif; width: 20%;"> <thead> <tr style="background-color: #cc5500; color: white;"> <th>User Load</th> <th>Average CPU Usage</th> <th>Percentage</th> </tr> </thead> <tbody> <tr> <td>25</td> <td>2.38</td> <td>30%</td> </tr> <tr> <td>50</td> <td>3.91</td> <td>49%</td> </tr> <tr> <td>75</td> <td>4.94</td> <td>62%</td> </tr> <tr> <td>100</td> <td>6.77</td> <td>85%</td> </tr> <tr> <td>125</td> <td>6.95</td> <td>87%</td> </tr> <tr> <td>150</td> <td>7.66</td> <td>96%</td> </tr> <tr> <td>175</td> <td>7.82</td> <td>98%</td> </tr> <tr> <td>200</td> <td>7.88</td> <td>99%</td> </tr> <tr> <td>250</td> <td>6.58</td> <td>82%</td> </tr> </tbody> </table> <br> <img src="https://jazz.net/wiki/pub/Deployment/ELMPerformanceOnCloud/ERM_ReadOnly_MediumCPUvsUsers_withLinkValidity.png" width="700"/> *Response Time* <img src="https://jazz.net/wiki/pub/Deployment/ELMPerformanceOnCloud/ERMMedViewsOnlyLV.png" width="700"/> *Throughput* <img src="https://jazz.net/wiki/pub/Deployment/ELMPerformanceOnCloud/ERM_ReadOnly_MediumPageElementThroughputVsUserLoad_withLinkValidity.png" width="700"/> ---+ ETM container testing This section provides analysis of the performance testing conducted for ETM. Two configurations were tested: * A small container (4 CPUs, 8G RAM) * A medium container (8 CPUs, 16G RAM) ---++ Summary of results <table border="1" cellpadding="5" cellspacing="0" style="border-collapse: collapse; text-align: center; font-family: Arial, sans-serif; width: 50%;"> <thead> <tr style="background-color: #cc5500; color: white;"> <th><b>Metric</b></th> <th><b>Small container</b></th> <th><b>Medium container</b></th> </tr> </thead> <tbody> <tr> <td><b>CPU Utilization</b></td> <td>100% at 900 users</td> <td>30% at 1000 users</td> </tr> <tr> <td><b>Response Time</b></td> <td>Response times increase above 900 users</td> <td>Response time is stable</td> </tr> <tr> <td><b>Throughput</b></td> <td>65 transactions per second at 900 users</td> <td>75 transactions per second at 1000 users</td> </tr> </tbody> </table> <br> The bottleneck is CPU for the small container tests. The medium container handled 1000 users without problems. The workload for the cloud testing was the same as that used in [[https://jazz.net/wiki/bin/view/Deployment/ELMLargeScaleAndPerformanceReportRelease701#Performance_load][previous ETM tests in the IBM lab]]. For the container tests, the user load was increased from 200 to 1000 users, with each stage lasting 15 minutes. ---++ Small container The small ETM container was configured with 4 CPUs and 8G of RAM. ---+++!! Performance Analysis <ol> <li><b>Performance Stability</b> <ul> <li>The system performs well up to 900 users, with acceptable CPU utilization and stable response times and throughput.</li> </ul> </li> <li><b>CPU Utilization</b> <ul> <li>CPU reaches 100% at 1000 users</li> </ul> </li> <li><b>Response Time</b> <ul> <li>Response times increase once the CPU usage reaches 100%</li> </ul> </li> <li><b>Throughput</b> <ul> <li>Throughput reaches a maximum of 65 transactions per second</li> </ul> </li> <li><b>Conclusion</b> <ul> <li>The small environment can handle workloads effectively up to 800-900 users. At 1000 users, CPU utilization is 100%</li> </ul> </li> </ol> </body> </html> CPU is the bottleneck for the small container. *CPU* <table border="1" cellpadding="5" cellspacing="0" style="border-collapse: collapse; text-align: center; font-family: Arial, sans-serif; width: 20%;"> <thead> <tr style="background-color: #cc5500; color: white;"> <th>Users</th> <th>Average CPU Usage</th> <th>Percentage</th> </tr> </thead> <tbody> <tr> <td>200</td> <td>1.39</td> <td>34.75%</td> </tr> <tr> <td>400</td> <td>2.09</td> <td>52.25%</td> </tr> <tr> <td>600</td> <td>2.72</td> <td>68%</td> </tr> <tr> <td>800</td> <td>3.21</td> <td>80.25%</td> </tr> <tr> <td>1000</td> <td>3.98</td> <td>99.50%</td> </tr> </tbody> </table> <br> <img src="https://jazz.net/wiki/pub/Deployment/ELMPerformanceOnCloud/AverageCPUvsUsers_SE.png" width="700"/> *Throughput* <img src="https://jazz.net/wiki/pub/Deployment/ELMPerformanceOnCloud/AveragePageelementthroughput_SM.png" width="700"/> *Response Time* Response times are stable as load increases, up until the point at which the CPU usage reaches 100% (1000 users). At that point, response times increase. <img src="https://jazz.net/wiki/pub/Deployment/ELMPerformanceOnCloud/AverageResponseTimevsUsers_SE.png" width="700"/> <br> ---++ Medium container The medium container was configured with 8 CPU and 16G of RAM. ---+++!! Performance Analysis <ol> <li><b>Performance Stability:</b> <ul> <li>The system performs well across the entire run</li> </ul> </li> <li><b>CPU Utilization:</b> <ul> <li>CPU is not exhaused during the test. At 1000 users, the medium container uses only 30% CPU.</li> </ul> </li> <li><b>Response Time:</b> <ul> <li>The response time are stable across the run</li> </ul> </li> <li><b>Throughput:</b> <ul> <li>Throughput increases to 75 transactions per second at 1000 users.</li> </ul> </li> <li><b>Conclusion:</b> <ul> <li>The Medium environment can handle 1000 users </li> </ul> </li> </ol> The medium container was capable of handling more than 1000 users. <b>CPU</b> <table border="1" cellpadding="5" cellspacing="0" style="border-collapse: collapse; text-align: center; font-family: Arial, sans-serif; width: 20%;"> <thead> <tr style="background-color: #cc5500; color: white;"> <th>Users</th> <th>Average CPU Usage</th> <th>Percentage</th> </tr> </thead> <tbody> <tr> <td>200</td> <td>0.82</td> <td>10.25%</td> </tr> <tr> <td>400</td> <td>1.24</td> <td>15.50%</td> </tr> <tr> <td>600</td> <td>1.38</td> <td>17.25%</td> </tr> <tr> <td>800</td> <td>1.89</td> <td>23.62%</td> </tr> <tr> <td>1000</td> <td>2.38</td> <td>29.75%</td> </tr> </tbody> </table> <br> <img src="https://jazz.net/wiki/pub/Deployment/ELMPerformanceOnCloud/AverageCPUvsUsers_ME.png" width="700"/> *Throughput* <img src="https://jazz.net/wiki/pub/Deployment/ELMPerformanceOnCloud/AveragePageElementThroughput_ME.png" width="700"/> *Response Time* <img src="https://jazz.net/wiki/pub/Deployment/ELMPerformanceOnCloud/AverageResponse_timevsUsers_ME.png" width="700"/> ---+ LDX container testing This section provides the results of performance testing conducted for the Link Index Provider. In a hybrid cloud deployment, the Lifecycle Query Engine serves as the Link Index Provider. The Lifecyle Query Engine additionally indexes data sources to support reporting. LQE is configured to use a relational store as the backend. <br> Two LQE configurations were tested: * A small container (8 CPUs, 16G RAM) * A medium container (16 CPUs, 32G RAM) ---++ Summary of results The test results are summarized below. <table border="1" cellpadding="5" cellspacing="0" style="border-collapse: collapse; text-align: center; font-family: Arial, sans-serif; width: 50%;"> <thead> <tr style="background-color: #CC5500; color: white;"> <th><b>Metric</b></th> <th><b>Small Environment</b></th> <th><b>Medium Environment</b></th> </tr> </thead> <tbody> <tr> <td><b>Peak Throughput</b></td> <td>50–56 transactions/sec at 20 threads</td> <td>180 transactions/sec at 100 threads.</td> </tr> <tr> <td><b>CPU Utilization</b></td> <td>100% at 30 threads</td> <td>90% at 100 threads</td> </tr> <tr> <td><b>Estimated user limit</b></td> <td>600 users</td> <td>2000 users</td> </tr> </tbody> </table> <br> The bottleneck is CPU. Once the available CPUs are 100% utilized, performance starts to degrade. Adding more CPUs to the LQE container will increase throughput. ---+++!! Threads vs. users The performance tests characterize workload in terms of threads. The workload is generated by sending requests directly to the LQE container from a test program, and the test program simulates multi-user load by running multiple threads. Each thread can be thought of as a simulating a very active user that does nothing but make requests for links. There is no pausing, so each thread makes requests as fast as it can. This is an extremely intense workload that is designed to drive the LQE container to its limits. Real users are much less active and interact with LQE indirectly through the applications. For example, when a user opens a view that has link columns using ERM DOORS Next, a request will be sent to the LQE container from the ERM DOORS Next container. You can consider each thread (or simulated user) to be the equivalent of 20 real users. <br> ---++ Small container The small container is configured with 8 CPUs and 16G of RAM. For this configuration: <ol> <li><b>Throughput:</b> <ul> <li>Throughput peaks at approximately 50 transactions per second with 20 threads.</li> <li>Beyond this point, throughput does not increase as user load increases (since response times are rising)</li> </ul> </li> <li><b>CPU Utilization:</b> <ul> <li>CPU usage is 100% at 30 threads</li> </ul> </li> <li><b>Response Time:</b> <ul> <li>Response times degrade as the user load increases</li> </ul> </li> <li><b>Conclusion:</b> <ul> <li>The small environment is suitable for handling workloads up to 30 threads. Beyond this threshold, performance degradation is evident due to CPU exhaustion</li> <li>30 threads correspond to 600 users</li> </ul> </li> </ol> </body> </html> *Throughput* <img src="https://jazz.net/wiki/pub/Deployment/ELMPerformanceOnCloud/LDXrsSmallThroughput.png" width="700"/> *CPU* <img src="https://jazz.net/wiki/pub/Deployment/ELMPerformanceOnCloud/LDXrsSmallCPU.png" width="700"/> *Response Time* <img src="https://jazz.net/wiki/pub/Deployment/ELMPerformanceOnCloud/LDXrsSmallResponseTime.png" width="700"/> <br> ---++ Medium container The medium container is configured with 16 CPUs and 32G of RAM. For this configuration: <ol> <li><b>Throughput:</b> <ul> <li>Throughput reaches approximately 180 transactions per second at 100 threads</li> </ul> </li> <li><b>CPU Utilization:</b> <ul> <li>At 100 threads, CPU usage reaches 87%</li> </ul> </li> <li><b>Response Time:</b> <ul> <li>Response times increase slightly between 0 and 50 threads</li> <li>Response times increase at a higher rate between 50 and 100 threads, but remain below 1 second</li> <li>Response times continue to rise as the user load increases beyond 100 threads</li> </ul> </li> <li><b>Conclusion:</b> <ul> <li>The medium container can handle between 50 and 100 concurrent threads</li> <li>Higher loads result in higher response times</li> <li>100 threads correspond to 2000 real users</li> </ul> </li> </ol> </body> </html> CPU is the primary bottleneck. *Throughput* <img src="https://jazz.net/wiki/pub/Deployment/ELMPerformanceOnCloud/LDXrsMediumThroughput.png" width="700"/> *CPU* <img src="https://jazz.net/wiki/pub/Deployment/ELMPerformanceOnCloud/LDXrsMediumCPU.png" width="700"/> *Response Time* <img src="https://jazz.net/wiki/pub/Deployment/ELMPerformanceOnCloud/LDXrsMediumResponseTime.png" width="700"/> <br> ---+ Report Builder testing This section provides analysis of the performance testing conducted for Report Builder. Two configurations were tested: * A small container (2 CPUs, 4G RAM) * A medium container (8 CPUs, 16G RAM) ---++!! Workload The following reports were used when applying load to the Report Builder application: * List modules and components * Filter requirements by contributor * List requirements validated by test cases (with link validity = 'Ignore') * List requirements validated by test cases linked to failed test results * List requirements linked to test artifacts not related to work items * List requirements implemented by work items (with link validity = 'Ignored') * List test plans, test cases used and test results without passed status and assigned 100 total points * List test plans with test cases linked to requirements and work items * Count work items by type and status * List resolved work items that implement requirements Each simulated user selects one of these reports to execute. The reports are executed at the rate of one report per minute per user. The number of simulated users was increased until the Report Builder application was overloaded. ---++ Summary of results <table border="1" cellpadding="5" cellspacing="0" style="border-collapse: collapse; text-align: center; font-family: Arial, sans-serif; width: 50%;"> <thead> <tr style="background-color: #CC5500; color: white;"> <th><b>Metric</b></th> <th><b>Small (2 CPU, 4G RAM)</b></th> <th><b>Medium (8 CPU, 16G RAM)</b></th> </tr> </thead> <tbody> <tr> <td><b>Max user</b></td> <td>75</td> <td>250 users</td> </tr> <tr> <td><b>Throughput</b></td> <td>6 reports/second at 75 users </td> <td>Peaks at 15 transactions/sec (250 users)</td> </tr> <tr> <td><b>CPU Utilization</b></td> <td>90% at 100 users </td> <td>CPU usage never exceeds 25%</td> </tr> <tr> <td><b>Response Time</b></td> <td>Sharp increase at 100 users</td> <td>Response times increase as load increases past 100 users</td> </tr> </tbody> </table> <br> For the small container, the bottleneck is CPU. For the medium container, there is a bottleneck in Report Builder created by the storage subsystem. ---++ Small container The small container is configured with 2 CPUs and 4G of RAM. ---+++!! Performance Analysis <ol> <li><b>Performance Stability</b> <ul> <li>The system performs well at 75 users, with acceptable CPU utilization and stable response times and throughput.</li> </ul> </li> <li><b>CPU Utilization</b> <ul> <li>CPU is 90% at 100 users</li> </ul> </li> <li><b>Response Time</b> <ul> <li>Response time increases at 100 users </li> </ul> </li> <li><b>Throughput</b> <ul> <li>Throughput reaches a maximum of 6 reports per second at 75 users.</li> </ul> </li> <li><b>Conclusion</b> <ul> <li>The small environment can handle workloads effectively only up to 75 users. CPU is the bottleneck.</li> </ul> </li> </ol> </body> </html> *Report Throughput* <img src="https://jazz.net/wiki/pub/Deployment/ELMPerformanceOnCloud/RBSmallThroughput.png" width="700"/> *CPU* <img src="https://jazz.net/wiki/pub/Deployment/ELMPerformanceOnCloud/RBSmallCPU.png" width="700"/> *Report Performance* <img src="https://jazz.net/wiki/pub/Deployment/ELMPerformanceOnCloud/RBSmallRespTime.png" width="700"/> <br> ---++ Medium container The medium container for Report Builder is configured with 8 CPUs and 16G of RAM. ---+++!! Performance Analysis <ol> <li><b>Throughput</b> <ul> <li>Throughput peaks at 13–15 transactions at 200 users</li> </ul> </li> <li><b>CPU Utilization</b> <ul> <li>CPU usage does not max out, and does not rise past 250 users</li> <li>This is an indication of a bottleneck in the Report Builder code</li> </ul> </li> <li><b>Response Time</b> <ul> <li>Response time increases as the load increases</li> <li>At 500 users, the response time is more than 10 times the value at 100 users</li> </ul> </li> <li><b>Conclusion</b> <ul> <li>The medium environment is capable of handling workloads up to 250 users. For higher loads, response times degrade significantly, and throughput is capped.</li> </ul> </li> </ol> </body> </html> An analysis of the Report Builder performance indicated that the throughput is limited by an internal bottleneck related to the storage subsystem. Report Builder stores runtime statistics on the persistent volume associated with the container. The writes to the persistent volume are limiting throughput. *Page Throughput* <img src="https://jazz.net/wiki/pub/Deployment/ELMPerformanceOnCloud/RBMediumThroughput.png" width="700"/> *CPU* <img src="https://jazz.net/wiki/pub/Deployment/ELMPerformanceOnCloud/RBMediumCPU.png" width="700"/> *Report Performance* <img src="https://jazz.net/wiki/pub/Deployment/ELMPerformanceOnCloud/RBMedRespTime.png" width="700"/> ---+ EWM container testing This section provides analysis of the performance testing conducted for EWM across small and medium containers in the IBM cloud. Two configurations were tested: * A small container (4 CPUs, 8G RAM) * A medium container (8 CPUs, 16G RAM) ---++!! Workload The workload used in testing the EWM container included these operations: * Load and Open Work Items * Create Defects * Create Defects with Attachments * Query and Edit Defects * Query Dashboard View * Plan Dashboard View * Query and Open Work Items with 100 EWM Links * Query and Open Work Items with Cross Links * Import 100 Work Items from CSV * Import 500 Work Items from CSV Each operation is 12.5% of the total user load, with the exception of the two "Import CSV" operations (which are limited to 2 users). The simulation uses a 30 second think time. User load is increased incrementally until the container becomes overloaded. ---++ Summary of results <table border="1" cellpadding="5" cellspacing="0" style="border-collapse: collapse; text-align: center; font-family: Arial, sans-serif; width: 50%;"> <thead> <tr style="background-color: #cc5500; color: white;"> <th><b>Metric</b></th> <th><b>Small container</b></th> <th><b>Medium container</b></th> </tr> </thead> <tbody> <tr> <td><b>Max users</b></td> <td>70</td> <td>125</td> </tr> <tr> <td><b>CPU Utilization</b></td> <td>100% at 75 users</td> <td>100% at 150 users.</td> </tr> <tr> <td><b>Response Time</b></td> <td>Stable until 70 users</td> <td>Stable until 125 users</td> </tr> <tr> <td><b>Throughput</b></td> <td>28 transactions per second at 70 users</td> <td>52 transactions per second at 125 users</td> </tr> </tbody> </table> ---++ Small container The small container is configured with 4 CPUs and 8G of RAM. ---+++!! Performance Analysis <ol> <li><b>Performance Stability:</b> <ul> <li>The system performs well until 70 Users, with acceptable CPU utilization and stable response times and throughput.</li> </ul> </li> <li><b>CPU Utilization:</b> <ul> <li>CPU reaches 100% at 75 users</li> </ul> </li> <li><b>Response Time:</b> <ul> <li>Response times rise at 75 users and above (since the CPU is 100% utilized)</li> </ul> </li> <li><b>Throughput:</b> <ul> <li>Throughput increases with the user load, reaching a maximum of 28 transactions per second at 70users. </li> </ul> </li> <li><b>Conclusion</b> <ul> <li>The small container can handle workloads effectively only up to 70Users. Performance degrades once the container CPUs are exhausted. </li> <li>CPU is the bottleneck</li> </ul> </li> </ol> </body> </html> *CPU* CPU usage reaches 100% at 75 users. <table border="1" cellpadding="5" cellspacing="0" style="border-collapse: collapse; text-align: center; font-family: Arial, sans-serif; width: 20%;"> <thead> <tr style="background-color: #cc5500; color: white;"> <th>Users</th> <th>% CPU</th> </tr> </thead> <tbody> <tr> <td>40</td> <td>42.25%</td> </tr> <tr> <td>50</td> <td>56.00%</td> </tr> <tr> <td>60</td> <td>61.75%</td> </tr> <tr> <td>65</td> <td>73.50%</td> </tr> <tr> <td>70</td> <td>76.75%</td> </tr> <tr> <td>75</td> <td>100%</td> </tr> <tr> <td>80</td> <td>100%</td> </tr> </tbody> </table> <br> <img src="https://jazz.net/wiki/pub/Deployment/ELMPerformanceOnCloud/EWM_Small-CPUVsUser.png" width="700"/> *Page Element Throughput* The chart below shows how throughput (measured in transactions per second) varies with user load. A "page element" is an HTTP call. Throughput increases as user load increases, up to 75 users. Throughput then levels out, since the workload overloads the CPU and response times start to increase. <img src="https://jazz.net/wiki/pub/Deployment/ELMPerformanceOnCloud/EWM_SmallPageElementThroughputVsUser.png" width="700"/> *Response Time* Response times increase slightly as the workload increases, but there is a sharper increase in response times at 75 users (when the CPU is 100% utitlized). <img src="https://jazz.net/wiki/pub/Deployment/ELMPerformanceOnCloud/SmallRespTimes.png" width="800"/> <br> ---++ Medium container The medium container is configured with 8 CPUs and 16G of RAM. ---+++!! Performance Analysis <ol> <li><b>Performance Stability:</b> <ul> <li>The system performs well until 125 users, with acceptable CPU utilization and stable response times and throughput.</li> </ul> </li> <li><b>CPU Utilization:</b> <ul> <li>CPU reaches 100% at 150 users</li> </ul> </li> <li><b>Response Time:</b> <ul> <li>Response times degrade at 150 users, since the CPU is 100% utilized</li> </ul> </li> <li><b>Throughput:</b> <ul> <li>Throughput reaches a maximum of 52 transactions per second at 125 users </li> </ul> </li> <li><b>Conclusion:</b> <ul> <li>The Medium container can handle up to 125 users. CPU is the bottleneck.</li> </ul> </li> </ol> </body> </html> *CPU* <table border="1" cellpadding="5" cellspacing="0" style="border-collapse: collapse; text-align: center; font-family: Arial, sans-serif; width: 20%;"> <thead> <tr style="background-color: #cc5500; color: white;"> <th>Users</th> <th>% CPU</th> </tr> </thead> <tbody> <tr> <td>100</td> <td>55.37%</td> </tr> <tr> <td>125</td> <td>70.75%</td> </tr> <tr> <td>150</td> <td>100%</td> </tr> <tr> <td>200</td> <td>100%</td> </tr> <tr> <td>250</td> <td>100%</td> </tr> <tr> <td>300</td> <td>100%</td> </tr> </tbody> </table> <br> <img src="https://jazz.net/wiki/pub/Deployment/ELMPerformanceOnCloud/EWM_Medium-CPUvsUser.png" width="700"/> *Page Element Throughput* The chart below shows how throughput (measured in transactions per second) varies with user load. A "page element" is an HTTP call. Throughput increases as user load increases, up to a maximum of 52 transactions per second at 125 users. Throughput then levels out, since the container overloads the CPU and response times increase. <img src="https://jazz.net/wiki/pub/Deployment/ELMPerformanceOnCloud/EWM_MediumPageElementThroughputVsUser.png" width="700"/> *Response Time* <img src="https://jazz.net/wiki/pub/Deployment/ELMPerformanceOnCloud/MedRespTimes.png" width="800"/> The response times for opening a dashboard tab that includes plan widgets degrades faster than other operations. The response time for that operation is shown below. <img src="https://jazz.net/wiki/pub/Deployment/ELMPerformanceOnCloud/MedRespPlanLoad.png" width="600"/> The response time increases once the CPU maxes out (at 150 users). ---+++++!! Revision history <sticky></div></sticky>
Attachments
Attachments
Topic attachments
I
Attachment
Action
Size
Date
Who
Comment
png
Architecture.png
manage
109.1 K
2025-02-14 - 16:11
VaughnRokosz
png
AverageCPUvsUsers_ME.png
manage
353.9 K
2025-02-24 - 13:46
VaughnRokosz
png
AverageCPUvsUsers_SE.png
manage
461.9 K
2025-02-24 - 13:51
VaughnRokosz
png
AveragePageElementThroughput_ME.png
manage
313.3 K
2025-02-24 - 13:47
VaughnRokosz
png
AveragePageelementthroughput_SM.png
manage
443.7 K
2025-02-24 - 13:47
VaughnRokosz
png
AverageResponseTimevsUsers_SE.png
manage
952.4 K
2025-02-24 - 13:48
VaughnRokosz
png
AverageResponse_timevsUsers_ME.png
manage
1201.9 K
2025-02-24 - 13:47
VaughnRokosz
png
Average_CPU_vs_Users_ME.png
manage
353.9 K
2025-02-24 - 13:45
VaughnRokosz
png
ERMMedStandardRespTime.png
manage
127.9 K
2025-02-19 - 18:24
VaughnRokosz
png
ERMMedViewsOnlyLV.png
manage
97.2 K
2025-02-19 - 19:01
VaughnRokosz
png
ERMSmallRespLV.png
manage
87.8 K
2025-02-19 - 15:49
VaughnRokosz
png
ERMSmallViewsResp.png
manage
58.2 K
2025-02-19 - 17:41
VaughnRokosz
png
ERM_ReadOnly_MediumCPUvsUsers_withLinkValidity.png
manage
46.0 K
2025-02-19 - 19:02
VaughnRokosz
png
ERM_ReadOnly_MediumPageElementThroughputVsUserLoad_withLinkValidity.png
manage
47.3 K
2025-02-19 - 19:02
VaughnRokosz
png
ERM_ReadWrite_MediumCPUvsUsers_withLinkValidity.png
manage
44.9 K
2025-02-19 - 18:11
VaughnRokosz
png
ERM_ReadWrite_MediumPageElementThroughputVs-UserLoad_withLinkValidity.png
manage
45.7 K
2025-02-19 - 18:12
VaughnRokosz
png
ERM_ReadWrite_SmallCPUvsUsers_withLinkValidity.png
manage
43.8 K
2025-02-19 - 15:07
VaughnRokosz
png
ERM_ReadWrite_SmallPageElementThroughputVsUserLoad_withLinkValidity.png
manage
41.9 K
2025-02-19 - 15:08
VaughnRokosz
png
ERM_ViewsOnly_SmallCPUvsUsers_withLinkValidity.png
manage
39.4 K
2025-02-19 - 17:25
VaughnRokosz
png
ERM_ViewsOnly_Throughput_withLinkValidity.png
manage
44.2 K
2025-02-19 - 17:25
VaughnRokosz
png
EWM_Medium-CPUvsUser.png
manage
193.3 K
2025-02-05 - 19:36
VaughnRokosz
png
EWM_MediumEnv-PageThroughputVsUserLoad.png
manage
108.3 K
2025-02-05 - 19:37
VaughnRokosz
png
EWM_MediumEnv-ResponseTime1.png
manage
213.7 K
2025-02-05 - 19:37
VaughnRokosz
png
EWM_MediumEnv-ResponseTime2.png
manage
274.0 K
2025-02-05 - 19:38
VaughnRokosz
png
EWM_MediumEnv_Top10PagesResponseTimeVsUsers.png
manage
784.3 K
2025-02-18 - 15:28
VaughnRokosz
png
EWM_MediumPageElementThroughputVsUser.png
manage
217.8 K
2025-02-14 - 18:31
VaughnRokosz
png
EWM_Small-CPUVsUser.png
manage
196.3 K
2025-02-05 - 19:10
VaughnRokosz
png
EWM_SmallEnv-PageThroughputVsUserload.png
manage
107.1 K
2025-02-05 - 19:23
VaughnRokosz
png
EWM_SmallEnv-ResponseTime1.png
manage
243.0 K
2025-02-05 - 19:20
VaughnRokosz
png
EWM_SmallEnv-ResponseTime2.png
manage
201.0 K
2025-02-05 - 19:26
VaughnRokosz
png
EWM_SmallEnv_Top10PageResponseTimeVsUsers.png
manage
665.5 K
2025-02-18 - 15:28
VaughnRokosz
png
EWM_SmallPageElementThroughputVsUser.png
manage
179.7 K
2025-02-14 - 18:31
VaughnRokosz
png
HybridCloudArchitecture.png
manage
115.9 K
2025-04-04 - 17:30
VaughnRokosz
png
LDXrsMediumCPU.png
manage
31.3 K
2025-02-18 - 20:25
VaughnRokosz
png
LDXrsMediumResponseTime.png
manage
32.0 K
2025-02-18 - 20:26
VaughnRokosz
png
LDXrsMediumThroughput.png
manage
33.3 K
2025-02-18 - 20:26
VaughnRokosz
png
LDXrsSmallCPU.png
manage
22.3 K
2025-02-18 - 20:26
VaughnRokosz
png
LDXrsSmallResponseTime.png
manage
23.3 K
2025-02-18 - 20:27
VaughnRokosz
png
LDXrsSmallThroughput.png
manage
26.9 K
2025-02-18 - 20:27
VaughnRokosz
png
MedRespPlanLoad.png
manage
98.2 K
2025-02-18 - 19:36
VaughnRokosz
png
MedRespTimes.png
manage
225.0 K
2025-02-18 - 17:51
VaughnRokosz
png
RBMedRespTime.png
manage
143.2 K
2025-02-17 - 18:21
VaughnRokosz
png
RBMediumAverageResponseTime.png
manage
81.4 K
2025-02-17 - 18:20
VaughnRokosz
png
RBMediumCPU.png
manage
76.9 K
2025-02-17 - 18:21
VaughnRokosz
png
RBMediumThroughput.png
manage
82.1 K
2025-02-17 - 18:21
VaughnRokosz
png
RBSmallAverageResponseTime.png
manage
104.6 K
2025-02-17 - 18:21
VaughnRokosz
png
RBSmallCPU.png
manage
130.6 K
2025-02-17 - 18:22
VaughnRokosz
png
RBSmallRespTime.png
manage
133.6 K
2025-02-17 - 18:22
VaughnRokosz
png
RBSmallThroughput.png
manage
101.2 K
2025-02-17 - 18:22
VaughnRokosz
png
SizingSummary.png
manage
9.4 K
2025-04-04 - 17:19
VaughnRokosz
png
SmallRespTimes.png
manage
223.3 K
2025-02-18 - 17:50
VaughnRokosz
Edit
|
Attach
|
P
rintable
|
V
iew topic
|
Backlinks:
We
b
,
A
l
l Webs
|
H
istory
:
r21
<
r20
<
r19
<
r18
<
r17
|
More topic actions...
Copyright © by IBM and non-IBM contributing authors. All material on this collaboration platform is the property of the contributing authors.
Contributions are governed by our
Terms of Use.
Please read the following
disclaimer
.
Dashboards and work items are no longer publicly available, so some links may be invalid. We now provide similar information through other means. Learn more
here
.

