Introduction
IBM Engineering Requirements Management (RM) DOORS Next in ELM 7.3.0 includes a set of performance improvements aimed for who operate very large repositories with many streams and baselines. This article presents the performance test results for the following three enhancements:
- Archive configuration performance (Tracked Resource Set, or TRS, update improvement): Archiving a stream or baseline in a large repository previously took many hours because of the work needed to update the TRS. ELM 7.3.0 reduces that cost and adds an optional property that reduces it much further. For more information, see the documentation on improving TRS performance during configuration archive.
- Materialize baselines for faster baseline performance: Large customers can see slow view queries in baseline contexts. ELM 7.3.0 lets administrators materialize selected local baselines so that view queries against them can use the faster access path used for local streams. For more information, see the documentation on materializing and dematerializing baselines.
- View performance enhancement: Views in baselines are designed to load faster because DOORS Next now retrieves the data for them more efficiently. This applies to both Oracle and Db2.
Each enhancement is covered in its own section, with its own test methodology and results. Information that applies to all of them (disclaimer, key findings and abbreviations) is collected in the shared sections at the beginning and end of the article. The test environment is described inside each section.
Standard Disclaimer
The information in this document is distributed AS IS. The use of this information or the implementation of any of these techniques is a customer responsibility and depends on the customer’s ability to evaluate and integrate them into the customer’s operational environment. While each item may have been reviewed by IBM for accuracy in a specific situation, there is no guarantee that the same or similar results will be obtained elsewhere. Customers attempting to adapt these techniques to their own environments do so at their own risk. Any pointers in this publication to external Web sites are provided for convenience only and do not in any manner serve as an endorsement of these Web sites. Any performance data contained in this document was determined in a controlled environment, and therefore, the results that may be obtained in other operating environments may vary significantly. Users of this document should verify the applicable data for their specific environment.
Performance is based on measurements and projections using standard IBM benchmarks in a controlled environment. The actual throughput or performance that any user will experience will vary depending upon many factors, including considerations such as the amount of multi-programming in the user’s job stream, the I/O configuration, the storage configuration, and the workload processed. Therefore, no assurance can be given that an individual user will achieve results similar to those stated here.
This testing was done as a way to compare and characterize the differences in performance between the existing behavior and the new behavior introduced in ELM 7.3.0 for DOORS Next. The results shown here should be evaluated as comparative performance guidance rather than as an absolute benchmark or service level agreement (SLA) for all customer environments.
Key Findings
The performance testing of the DOORS Next enhancements in ELM 7.3.0 produced the following key conclusions.
- Improvements in configuration archiving:
- Archiving a ~1M stream together with its 5 baselines (6 configurations in total) is faster in 7.3. The total archive time dropped from ~12h 08m to ~4h 35m on Oracle (~2.65x faster, ~62% less time) and from ~24h to ~3.7h on Db2 (~6.5x faster, ~85% less time).
- Archiving this set of configurations still takes several hours on both databases.
- Materialize baselines for faster baseline performance:
- Materialization:
- With load test (Oracle): the 5M baseline took 3 hr 50 min, 2 hr 46 min and 2 hr 36 min with 100, 300 and 500 users in the Rational Performance Tester (RPT) load test. Users, batch size and thread count changed together in each run.
- Without load test: Iteration 2 (warm) was faster than Iteration 1 (cold) in every configuration, so plan for the Iteration 1 time. Example with 50,000 artifacts and ~50M state changes (Iteration 1 → Iteration 2):
- Oracle: 1 hr 12 min 30 sec → 14 min 16 sec.
- Db2: 48 min 40 sec → 9 min 44 sec.
- Dematerialization:
- With load test (Oracle), much slower than materialization: the 5M baseline took 13 hr 53 min, 14 hr 43 min and 16 hr 19 min, and the 1M baseline about 4 hours. Plan for this when scheduling it on large repositories.
- Without load test: for the 1M baseline, Iteration 2 was slower than Iteration 1. The cause has not been determined.
- Oracle: 4 min 22 sec → 13 min 27 sec.
- Db2: 4 min 30 sec → 7 min 54 sec.
- Recommended settings for large baselines: insert batch size 10,000 and Version table Java thread pool size 20. The 7.3 defaults (1,000 and 30) are unchanged for general workloads.
- View performance enhancement:
- Oracle: 145 views were each run as 2 users (jazz admin and jazz user), which gives 290 view runs. The materialized baseline (MB) was faster than the Initial Stream (IS) for 67.6% of the view runs, and the Initial Stream was faster for 32.4%.
- Db2: the same 290 view runs were tested. MB was faster for 54.8% of the view runs and IS was faster for 45.2%. MB also removed all 32 timeout failures that were reproducible on IS, with no new timeouts.
- Not every view gets faster: on Oracle about 1 in 3 view runs, and on Db2 nearly half, were faster on the Initial Stream than on the materialized baseline. Check the views that matter most to you in your own environment, and do not assume that every view will open faster.
Archive Configuration Performance (TRS Update Improvement)
Feature Overview
In a large DOORS Next repository, archiving a configuration (a stream or a baseline) can take days, or even weeks, to complete the Tracked Resource Set (TRS) update. During that time the archive operation places additional load on the DOORS Next (RM) server, and users can experience server instability and slower performance until it finishes.
ELM 7.3.0 improves this behavior and introduces a new advanced property:
| Advanced Property |
Values |
Enable minimal trs delete events for configuration archival |
false / true |
The behavior of the archive operation for each value of the property is summarized below.
| Behavior |
Property = false |
Property = true |
| Reference checks |
Performed in batches and in parallel. |
Performed in batches and in parallel. |
| Referenced versions |
Filtered out during the resource selection stage, before processing. |
Filtered out during the resource selection stage, before processing. |
| Unreferenced artifact types processed |
All unreferenced artifact types. |
Only: Artifact Definition, Artifact Type, Object Type, Link Type and Configuration Selection. |
| Follow-up action required |
None beyond the existing process. |
TRS validation must be run after the archive. Validation identifies all version resources as "extra feed" and generates the deletion events for them. |
In short: with the property set to false, the archive does the complete job faster. With the property set to true, the archive operation itself is much faster because the per-resource TRS delete events are not generated during the archive, but that work is deferred to a TRS validation that you must run yourself.
For more information about this feature, see the
documentation on improving TRS performance during configuration archive.
Performance Test Results
Summary of Results
These results compare the archive operation before and after the improvement, for both values of the new property. The data used and the way the tests were run are described in
Test Methodology after the results, and the servers in
Test Environment.
All times are the total time for archiving all 6 configurations (1 stream and 5 baselines). The Oracle and Db2 results are separated by a vertical line.
| Scenario | Oracle | Db2 |
| Total Archive Time | Improvement vs. Baseline | Total Archive Time | Improvement vs. Baseline |
| Baseline (existing behavior) | ~12h 08m 02s | — | ~23h 56m 18s | — |
Property = false | ~4h 34m 40s | ~2.65x faster (~62% less time) | ~3h 41m 25s | ~6.5x faster (~85% less time) |
Property = true
(archive only, excludes required TRS validation) | ~28s | >99.9% less time for the archive step | ~13s | >99.9% less time for the archive step |
- Property = false: the archive was faster on both databases, with no change in which artifact types are processed and no extra step required after the archive.
- Property = true: this setting can be used when archiving configurations in bulk. The times above are for the archive step only.
- They do not include the TRS validation that must be run afterward to generate the deletion events for the version resources. The duration of that validation was not measured, so these times are not the end-to-end time to complete the archival.
- Only five unreferenced artifact types are processed: Artifact Definition, Artifact Type, Object Type, Link Type and Configuration Selection.
- Even with the improvement, archiving this configuration set with the property set to
false still takes several hours on both databases.
Test Methodology
The goal of this test was to measure how much faster the archive operation is with the new implementation, and to compare both values of the new property against the behavior in the previous implementation.
Data Shape
| Item |
Value |
| Stream size |
~1M |
| Baselines of the stream |
5 |
| Total configurations archived |
6 (1 stream + 5 baselines) |
Performance Testing Methodology
- The archive operation was run on a large stream with 5 baselines (6 configurations in total) and the total time was recorded.
- Three scenarios were measured on each database: the existing behavior as the baseline, the new implementation with the property set to false, and the new implementation with the property set to true.
- Each result was compared against the baseline to calculate the improvement.
- The same test was performed on both Oracle and Db2 databases.
- Only the archive operation itself was timed. The follow-up TRS validation that is needed when the property is
true was not part of the measured time.
Test Environment
The tests used a DOORS Next (RM) application served at
rm3/web, running against Oracle and Db2 databases. The servers in the performance test environment are all physical servers. The server role, operating system (RHEL is Red Hat Enterprise Linux), application and capacity of each server are listed below, separately for the Oracle and Db2 test environments.
Oracle Test Environment
| Server Role |
Operating System |
Application |
Virtual Cores |
RAM |
| Web / Reverse Proxy | RHEL Server 7 | IBM HTTP Server | 8 | 16 GB |
| Jazz Team Server (JTS) / Global Configuration Management (GCM) Server | RHEL Server 8 | JTS | 24 | 32 GB |
| RM/DOORS Next Server | RHEL Server 7 | RM/DOORS Next Server | 24 | 32 GB |
| Oracle Database | RHEL Server 8 | Oracle 19c Enterprise Edition | 24 | 64 GB |
Db2 Test Environment
| Server Role |
Operating System |
Application |
Virtual Cores |
RAM |
| Web / Reverse Proxy | RHEL 7.9 | IBM HTTP Server | 16 | 16 GB |
| RM/DOORS Next Server | RHEL 7.9 | RM/DOORS Next Server | 24 | 64 GB |
| JTS Server | RHEL 7.9 | JTS | 24 | 96 GB |
| DB2 Database Server | RHEL 7.9 | DB2 Database | 24 | 64 GB |
Considerations and Limitations
To avoid misreading the numbers above, please keep the following in mind when planning for this feature:
- Property = true shifts work to TRS validation. The very short archive times are possible because the per-version delete events are not generated during the archive. TRS validation is required afterward to identify the version resources as extra feed and generate the deletion events. The duration of that validation depends on your repository size and was not measured in this test. Plan a validation window accordingly.
- Property = true processes fewer artifact types. Only unreferenced Artifact Definition, Artifact Type, Object Type, Link Type and Configuration Selection are processed. With
false, all unreferenced artifact types are processed.
- Property = false needs no additional validation step. It improved total archive time by ~2.65x (Oracle) and ~6.5x (Db2) in these tests, but archiving a configuration set of this size still takes several hours.
- Results depend on data shape. All results come from one stream of ~1M with 5 baselines. Streams with different amounts of referenced versus unreferenced content, or different numbers of baselines, may behave differently.
Materialize Baselines for Faster Baseline Performance
Feature Overview
Large customers can experience slow view queries when working in baseline contexts, and the existing database hints do not consistently improve baseline view performance at scale. ELM 7.3.0 adds the ability to
materialize selected local baselines so that they can be queried with the same optimized access patterns as local streams.
When a baseline is materialized, pre-computed data structures equivalent to those used for a local stream are created and stored in the database. Later view queries against that baseline can then follow the faster stream access path instead of the standard baseline resolution path.
Two configuration parameters let administrators control the resource impact of materialization:
| Configuration Parameter |
Purpose |
Property |
| Insert batch size | Controls how many rows are written to the database per insert operation during materialization. Larger batches reduce the number of database round trips but increase the memory and lock scope of each operation. | com.ibm.team.repository.service.internal.dataaccess.VersionTable.batchSize |
| Version table Java thread pool size | Controls the number of Java worker threads that run the insert operations in parallel. More threads can shorten materialization, but too many cause database contention, higher Oracle latch and connection pressure, and diminishing returns. | VERSIONTABLE_THREAD_POOL_COUNT |
Key points about the implementation:
- Materialization is supported for local baselines only. Global Configuration (GC) baselines are not covered in the current implementation.
- Materialization creates additional pre-computed data structures in the database, in the same form as those used for local stream access.
In short: materializing a baseline is a one-time cost (and a later dematerialization cost) in exchange for faster view queries against that baseline. The tests in this section measure that cost.
Performance Test Results
Summary of Results
The results come from two groups of tests that used different baselines and conditions, so they should not be compared with each other. Detailed tables follow. The method is described in
Test Methodology after the results, and the servers in
Test Environment. For large baselines, see
Recommended Configuration.
- With load test (Oracle only): baselines of 500K, 1M and 5M artifacts were tested while a Rational Performance Tester (RPT) load test of 100, 300 or 500 users ran in the background. Times below are in the order of 100, 300 and 500 users.
- Materialization depends mainly on baseline size. The 5M baseline took 3 hr 50 min, 2 hr 46 min and 2 hr 36 min.
- Dematerialization is much slower than materialization. The 5M baseline took 13 hr 53 min, 14 hr 43 min and 16 hr 19 min, and the 1M baseline took about 4 hours in each run. Plan for this when scheduling dematerialization on large repositories.
- The number of users, batch size and thread count changed together in each run, so the effect of the load test alone cannot be isolated.
- Without load test: baselines of 10,000 to 1M artifacts, some with added state changes. Two runs were performed for each configuration: Iteration 1 (cold), then Iteration 2 (warm). Times are shown as Iteration 1 → Iteration 2, and Oracle and Db2 are reported separately.
- Materialization was faster in Iteration 2 in every configuration, so plan for the Iteration 1 time. Example with 50,000 artifacts and ~50M state changes:
- Oracle: 1 hr 12 min 30 sec → 14 min 16 sec.
- Db2: 48 min 40 sec → 9 min 44 sec.
- Dematerialization of the 1M baseline was slower in Iteration 2 than in Iteration 1. The cause has not been determined.
- Oracle: 4 min 22 sec → 13 min 27 sec.
- Db2: 4 min 30 sec → 7 min 54 sec.
Results with Load Test (Oracle only)
In these runs, a load test with the number of simulated RPT users shown in the tables ran in the background while one local baseline was materialized or dematerialized.
Oracle: Materialization Results
| Run |
Baseline Size |
Users in RPT Load Test |
Batch Size |
Threads |
Duration |
| M01 | 5M | 100 | 1,000 | 10 | 3 hr 50 min 13 sec |
| M02 | 5M | 300 | 5,000 | 20 | 2 hr 46 min 08 sec |
| M03 | 5M | 500 | 10,000 | 30 | 2 hr 36 min 09 sec |
| M04 | 1M | 100 | 5,000 | 30 | 52 min 22 sec |
| M05 | 1M | 300 | 10,000 | 10 | 42 min 00 sec |
| M06 | 1M | 500 | 1,000 | 20 | 30 min 01 sec |
| M07 | 500K | 100 | 10,000 | 20 | 4 min 29 sec |
| M08 | 500K | 300 | 1,000 | 30 | 9 min 31 sec |
| M09 | 500K | 500 | 5,000 | 10 | 29 min 10 sec |
Observations:
- Materialization time was driven primarily by baseline size. The 5M runs took between about 2.6 and 3.8 hours (3 hr 50 min, 2 hr 46 min and 2 hr 36 min for 100, 300 and 500 users), the 1M runs between 30 and 52 minutes, and the 500K runs under 30 minutes. Because the number of users in the RPT load test, batch size and thread count changed together in each run, the effect of the load test alone cannot be separated from the other two.
- Among the 5M runs, M01 (batch 1,000, 10 threads, 100 users in the RPT load test) took the longest at 3 hr 50 min. M03 (batch 10,000, 30 threads, 500 users in the RPT load test) finished in 2 hr 36 min, about 32% less time. This reflects the combined effect of the larger batch, more threads and the different user load.
- Among the 1M runs, M05 (batch 10,000, 10 threads) took 42 minutes and M06 (batch 1,000, 20 threads) took 30 minutes. This suggests that thread count had a larger effect than batch size at this baseline size, but the number of users in the RPT load test also differed between the two runs.
Oracle: Materialization CPU and Disk Utilization
Oracle database server CPU usage (%) and disk busy (%) while materializing each baseline size with 100, 300 and 500 users in the RPT load test.
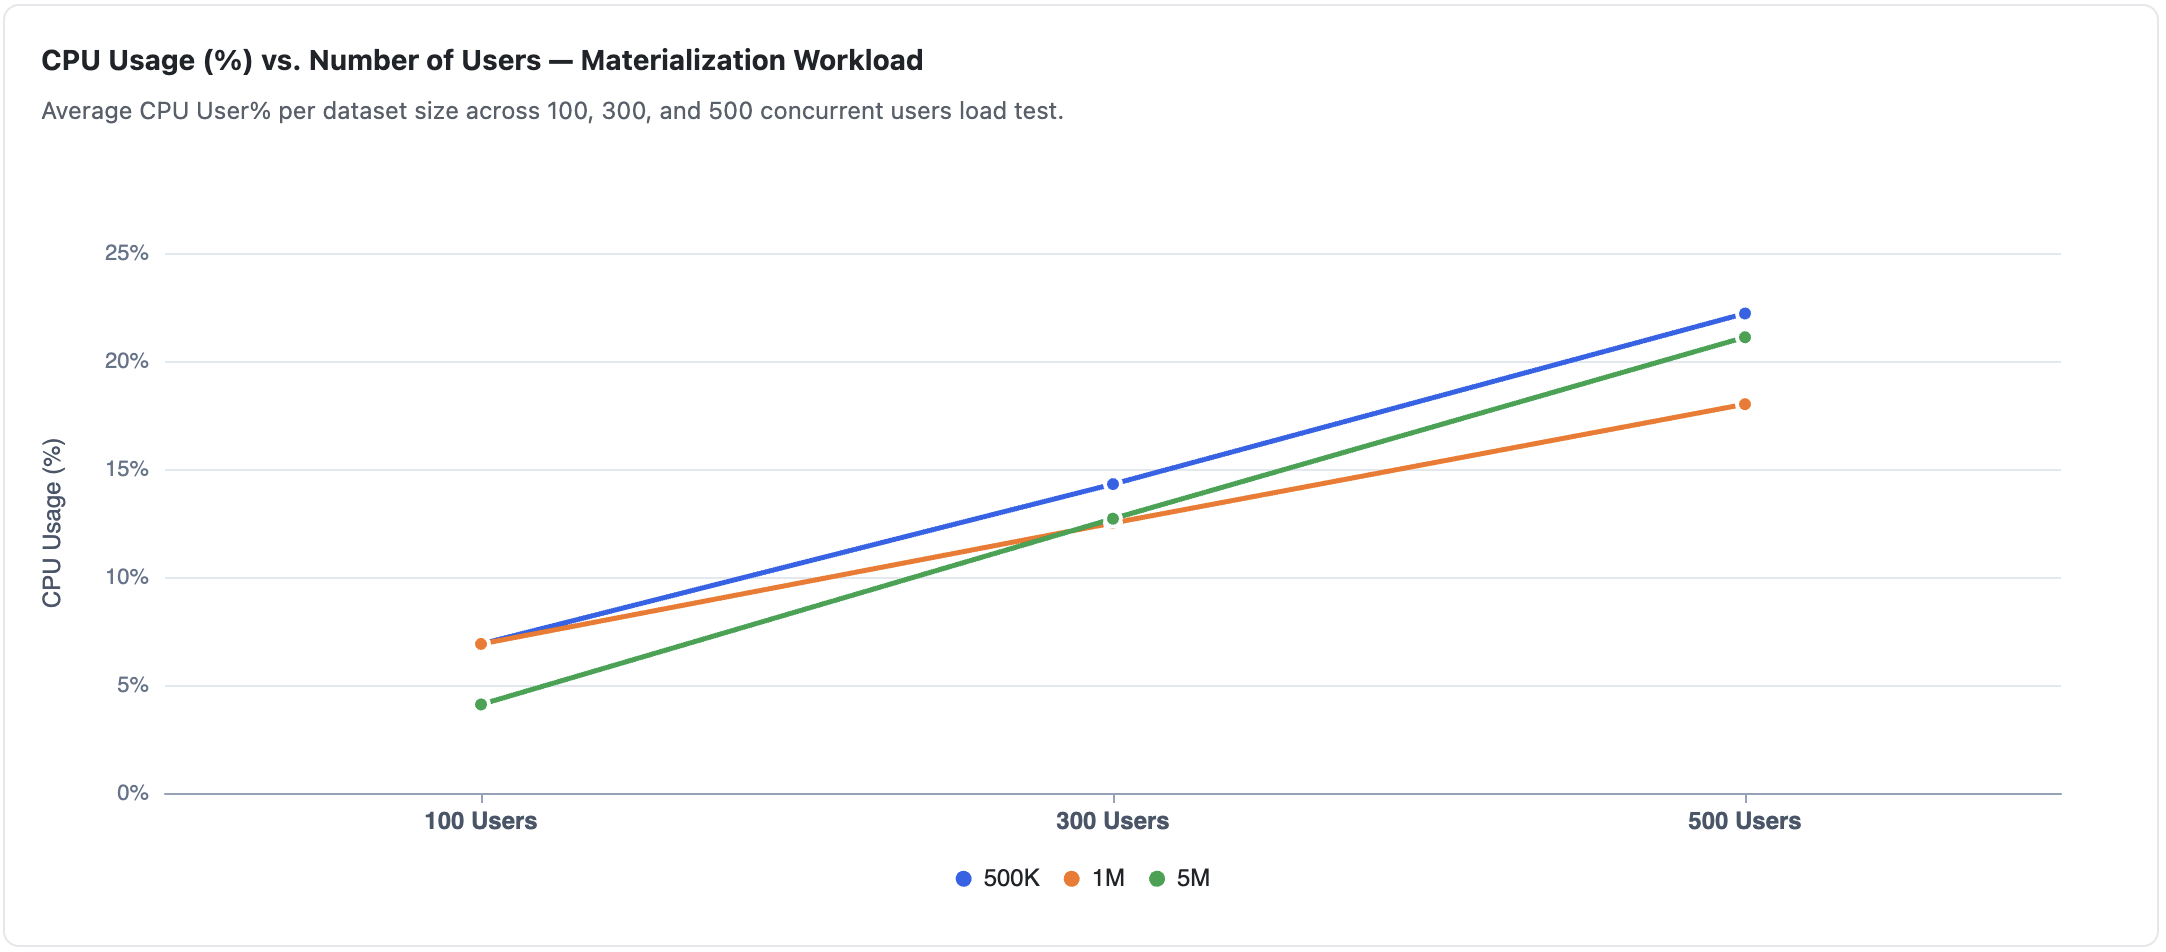
 Observations
:
- Oracle database server CPU usage rose with the number of users in the RPT load test for all three baseline sizes, from about 4 to 7% at 100 users to about 18 to 22% at 500 users.
- Disk busy stayed high throughout, at about 44 to 64%, for all baseline sizes and user counts.
- The charts show the combined effect of materialization and the background load test. Their separate contributions were not measured.
Oracle: Dematerialization Results
Full removal of the materialized data was confirmed in every run.
| Run |
Baseline Size |
Users in RPT Load Test |
Duration |
| D01 | 5M | 100 | 13 hr 53 min 45 sec |
| D02 | 5M | 300 | 14 hr 43 min 25 sec |
| D03 | 5M | 500 | 16 hr 19 min 11 sec |
| D04 | 1M | 100 | 4 hr 2 min 15 sec |
| D05 | 1M | 300 | 4 hr 21 min 49 sec |
| D06 | 1M | 500 | 4 hr 16 min 6 sec |
| D07 | 500K | 100 | 43 min 24 sec |
| D08 | 500K | 300 | 3 min 34 sec |
| D09 | 500K | 500 | 3 min 15 sec |
Observations:
- Dematerialization was substantially slower than materialization for the same baseline size. The 5M baseline took 13 to 16 hours and the 1M baseline about 4 hours.
- The 500K runs varied widely. D07 (100 users in the RPT load test) took 43 minutes, while D08 and D09 (300 and 500 users) took under 4 minutes. When the same baseline is dematerialized in later iterations, no input/output (I/O) against the materialized data is seen after the second iteration, and this appears to correlate with the much shorter run time.
Oracle: Dematerialization CPU and Disk Utilization
Oracle database server CPU usage (%) and disk busy (%) while dematerializing each baseline size with 100, 300 and 500 users in the RPT load test.

 Observations
:
- For the 1M and 5M baselines, Oracle database server CPU usage rose with the number of users in the RPT load test, to about 28% (1M) and 26% (5M) at 500 users. For the 500K baseline it stayed low, between about 5% and 9%.
- For the 1M and 5M baselines, disk busy stayed high at about 60 to 75% at every user count. For the 500K baseline it fell from about 65% at 100 users to about 29% at 300 and 500 users. Those two 500K runs were much shorter (under 4 minutes, see D08 and D09 above).
- The charts show the combined effect of dematerialization and the background load test. Their separate contributions were not measured.
Results without Load Test (Oracle and Db2)
These runs used baselines of 10,000, 50,000 and 1M artifacts, some with added artifact state changes and binding state changes. Two runs were performed for each configuration: Iteration 1 (cold) and then Iteration 2 (warm). The speedup is the Iteration 1 time divided by the Iteration 2 time. The same configurations were run on Oracle and Db2, and the Oracle and Db2 results are separated by a vertical line in each table.
The
Total State Changes column is calculated as (artifact state changes + binding state changes) × number of artifacts. For example, 100 artifact state changes and 100 binding state changes on 10,000 artifacts give (100 + 100) × 10,000 = about 2M total state changes. The 1M artifact baseline had no added state changes.
Materialization Results (Oracle and Db2)
| Artifacts | Total State Changes | Oracle | Db2 |
| Iteration 1 (cold) | Iteration 2 (warm) | Speedup | Iteration 1 (cold) | Iteration 2 (warm) | Speedup |
| 10,000 | ~2M | 7 min 53 sec | 46 sec | ~10× | 3 min 33 sec | 21 sec | ~10× |
| 10,000 | ~5M | 7 min 7 sec | 1 min 39 sec | ~4× | 6 min 36 sec | 57 sec | ~7× |
| 10,000 | ~10M | 6 min 22 sec | 3 min 18 sec | ~2× | 14 min 46 sec | 2 min 37 sec | ~5.7× |
| 50,000 | ~25M | 40 min 57 sec | ~6 min 54 sec | ~6× | 23 min 37 sec | 4 min 54 sec | ~4.8× |
| 50,000 | ~50M | 1 hr 12 min 30 sec | 14 min 16 sec | ~5× | 48 min 40 sec | 9 min 44 sec | ~5× |
| 1,000,000 | None added | 5 min 7 sec | 3 min 8 sec | ~1.6× | 32 min 20 sec | 2 min 49 sec | ~11.5× |
Observations:
- Iteration 2 (warm) was faster than Iteration 1 (cold) in every configuration, by about 1.6× to 10× on Oracle and about 4.8× to 11.5× on Db2. This is consistent with caching or reuse of previously computed data on repeat runs. Plan for the Iteration 1 time when you materialize a baseline for the first time.
- Oracle: state changes matter more at higher artifact counts. For 50,000 artifacts, Iteration 1 with ~50M state changes (1 hr 12 min) took about 1.8× as long as the run with ~25M (41 min). For 10,000 artifacts, Iteration 1 times were similar (about 6 to 8 minutes) regardless of the number of state changes.
- Db2: going from 10,000 to 50,000 artifacts (5×) made materialization about 3 to 5 times longer for the same state configuration, so the increase is less than proportional.
- Db2: for configurations with many state changes (for example 10,000 artifacts with ~10M total state changes), the materialized baseline holds about 1% of the total stream state, so materialization is selective rather than a full copy. For the 1M baseline with no added state changes it holds 100% of the stream state.
Dematerialization Results (Oracle and Db2)
| Artifacts | Total State Changes | Oracle | Db2 |
| Iteration 1 (cold) | Iteration 2 (warm) | Iteration 1 (cold) | Iteration 2 (warm) |
| 10,000 | ~2M | ~14 sec | 13 sec | 1 min 6 sec | 43 sec |
| 10,000 | ~5M | 16 sec | 18 sec | 14 sec | 28 sec |
| 10,000 | ~10M | 20 sec | 20 sec | 1 min 3 sec | 34 sec |
| 50,000 | ~25M | 48 sec | 46 sec | 2 min 6 sec | 21 sec |
| 50,000 | ~50M | 50 sec | 48 sec | 2 min 20 sec | 45 sec |
| 1,000,000 | None added | 4 min 22 sec | 13 min 27 sec | 4 min 30 sec | 7 min 54 sec |
Observations:
- Oracle: dematerialization time followed the artifact count rather than the number of state changes. For 10,000 artifacts it took 14 to 20 seconds in Iteration 1 and 13 to 20 seconds in Iteration 2. For 50,000 artifacts it took 48 to 50 seconds in Iteration 1 and 46 to 48 seconds in Iteration 2. For the 1M baseline it took 4 min 22 sec in Iteration 1 and 13 min 27 sec in Iteration 2 (see the next point).
- Db2: dematerialization was generally faster than materialization, because it removes data rather than computing it.
- For the 1M baseline, Iteration 2 dematerialization was slower than Iteration 1 on both databases (Oracle: 13 min 27 sec compared with 4 min 22 sec; Db2: 7 min 54 sec compared with 4 min 30 sec). The cause has not been determined.
- Db2: the number of baseline states went from 0 before materialization, to the expected count after materialization, and back to 0 after dematerialization, in every test. Both operations behaved correctly and were fully reversible.
Recommended Configuration
Additional testing looked specifically at materializing large baselines (around 5 million artifacts or more). For large baselines, we recommend the settings in the table below.
| Setting |
Property |
7.3 Default |
Recommended for Large Baselines |
| Thread count | VERSIONTABLE_THREAD_POOL_COUNT | 30 | 20 |
| Await termination timeout | VERSIONTABLE_EXECUTORSERVICE_AWAIT_TERMINATION_TIMEOUT_IN_MINUTES | 240 minutes | 240 minutes |
| Insert batch size | com.ibm.team.repository.service.internal.dataaccess.VersionTable.batchSize | 1,000 | 10,000 |
These settings balance materialization speed against database resource use. A batch size of 10,000 gives good insert throughput without the extra memory pressure and lock scope of larger batches. A thread pool size of 20 parallelizes the work without excessive database connection pressure or Oracle latch contention.
In ELM 7.3.0, the default value of the await termination timeout is 240 minutes, and this is also the value to use for large baselines. The defaults for thread count and insert batch size have not changed. If you are not materializing large baselines, keep the default values.
The test results in this article come from a controlled test environment, and the results in your environment may be different. Before you use the recommended settings in production, try them in a test environment with your own data and workload.
Test Methodology
We measured how long it takes to materialize and dematerialize a local baseline. The baselines were created from an Initial Stream that holds all artifacts, and only local baselines were tested (GC baselines were not included). Testing was done in two parts.
Part 1: with load test (Oracle only)
- Rational Performance Tester (RPT) simulated 100, 300 or 500 users running a mixed set of DOORS Next operations in the background while a baseline was materialized, and then dematerialized. These simulated users are the background load. Each materialization or dematerialization was a single administrative operation, not something done by that many users. The results report only the time taken by materialization and dematerialization. They do not report the effect of the operation on the response times of the background RPT load test.
- Baselines of 500K, 1M and 5M artifacts were used. Nine materialization runs (M01 to M09) and nine dematerialization runs (D01 to D09) were done. From one run to the next, the baseline size, the number of users, the insert batch size (1,000, 5,000 or 10,000) and the thread pool size (10, 20 or 30) were changed together. The results therefore show overall trends, and the effect of one setting alone cannot be isolated.
- CPU usage (%) and disk busy (%) of the Oracle database server were also recorded during these runs and are shown as one average value per run.
Part 2: without load test (Oracle and Db2)
- Baselines of 10,000, 50,000 and 1M artifacts were used, some with added artifact state changes and binding state changes. The exact configurations are listed with the results above.
- Each configuration was run twice: Iteration 1 (cold) had no previously computed state data, and Iteration 2 (warm) reused the state data computed in Iteration 1.
- No load test ran during these runs. The tests used Oracle 19c and Db2 11.5, with the same configurations on both.
Test Environment
The materialization tests were run on the two environments below, using the DOORS Next application served at
rm/web. The servers are all physical servers. In the tables, RHEL is Red Hat Enterprise Linux. The Oracle 19c environment was used for all Oracle tests. The Db2 11.5 environment was used for the Db2 tests, which were run without load test.
Materialize Baselines Oracle Test Environment
| Server Role |
Operating System |
Application |
Virtual Cores |
RAM |
| Web / Reverse Proxy | RHEL 8.x | IBM HTTP Server | 16 | 32 GB |
| Jazz Team Server (JTS) / Global Configuration Management (GCM) Server | RHEL 8.x | JTS | 24 | 32 GB |
| RM/DOORS Next Server | RHEL 8.x | RM/DOORS Next Server | 24 | 64 GB |
| Oracle Database Server | RHEL 7.9 | Oracle 19c | 40 | 192 GB |
Materialize Baselines Db2 Test Environment
| Server Role |
Operating System |
Application |
Virtual Cores |
RAM |
| Web / Reverse Proxy | RHEL 7.9 | IBM HTTP Server | 8 | 16 GB |
| JTS Server | RHEL 8.x | JTS | 24 | 32 GB |
| RM/DOORS Next Server | RHEL 7.9 | RM/DOORS Next Server | 24 | 32 GB |
| Db2 Database Server | RHEL 7.9 | Db2 11.5 | 24 | 192 GB |
View Performance Enhancement
Feature Overview
This enhancement addresses slow view query response times that large customers see when working in DOORS Next baseline contexts. Two causes were identified:
- Existing database hints were not consistently effective at improving baseline view performance at scale.
- In large configurations, certain optimizer hints produced poor execution plans, making queries slower instead of faster.
ELM 7.3.0 includes two targeted query changes:
- Global Temporary Table (GTT) usage: link query execution now goes through a GTT, which makes execution plans more stable across configuration sizes.
- Hint removal: optimizer hints that produced poor plans in large configurations were removed, so the database engine can choose better plans on its own.
These changes apply to both Oracle and Db2.
Performance Test Results
Summary of Results
These results compare view query times on the Initial Stream with the same views on a materialized baseline. The views, users and way the tests were run are described in
Test Methodology after the results, and the servers in
Test Environment.
- Oracle: the materialized baseline was faster than the Initial Stream for 67.6% of the 290 view runs (145 views x 2 users). The Initial Stream was faster for the other 32.4%.
- Db2: the materialized baseline was faster for 54.8% of the 290 view runs. The Initial Stream was faster for the other 45.2%.
- Db2 timeouts: the materialized baseline removed all 32 timeout failures that were reproducible on the Initial Stream, and introduced no new timeouts.
- The enhancement does not speed up every view. On Oracle about one third of the view runs, and on Db2 nearly half, were faster on the Initial Stream.
Oracle Results
| Metric |
Result |
| View runs where the materialized baseline (MB) was faster | 67.6% of the 290 view runs (145 views x 2 users) |
| View runs where the Initial Stream (IS) was faster | 32.4% of the 290 view runs (145 views x 2 users) |
The materialized baseline path was faster than the Initial Stream in more than two thirds of the 290 view runs on Oracle 19c.
Db2 Results
| Metric |
Result |
| View runs where the materialized baseline (MB) was faster | 54.8% of the 290 view runs (145 views x 2 users) |
| View runs where the Initial Stream (IS) was faster | 45.2% of the 290 view runs (145 views x 2 users) |
| Initial Stream timeout cases resolved by MB | 32 (no new MB timeouts introduced) |
On Db2 11.5, the materialized baseline path was faster in more than half of the 290 view runs and removed all 32 timeout failures that were reproducible on the Initial Stream. No new timeouts were introduced.
Test Methodology
The goal of this test was to find out how often view queries run faster on a materialized baseline with the new query changes than on the Initial Stream, on both Oracle and Db2.
A
view run in this article means one view executed by one user. 145 views were each run by 2 users (jazz admin and jazz user), which gives 145 x 2 =
290 view runs in total. Percentages in this section are percentages of those 290 view runs.
Data Shape
| Item |
Value |
| Views tested | 145 views, each run by 2 users (jazz admin and jazz user) = 290 view runs. The views are a mix of simple, complex and nested-group views (see Types of Views Tested). The same 290 view runs were tested on Oracle and on Db2. |
| Databases | Oracle 19c and Db2 11.5 |
| Scope | Local baseline contexts only; Global Configuration (GC) baselines are not included |
Types of Views Tested
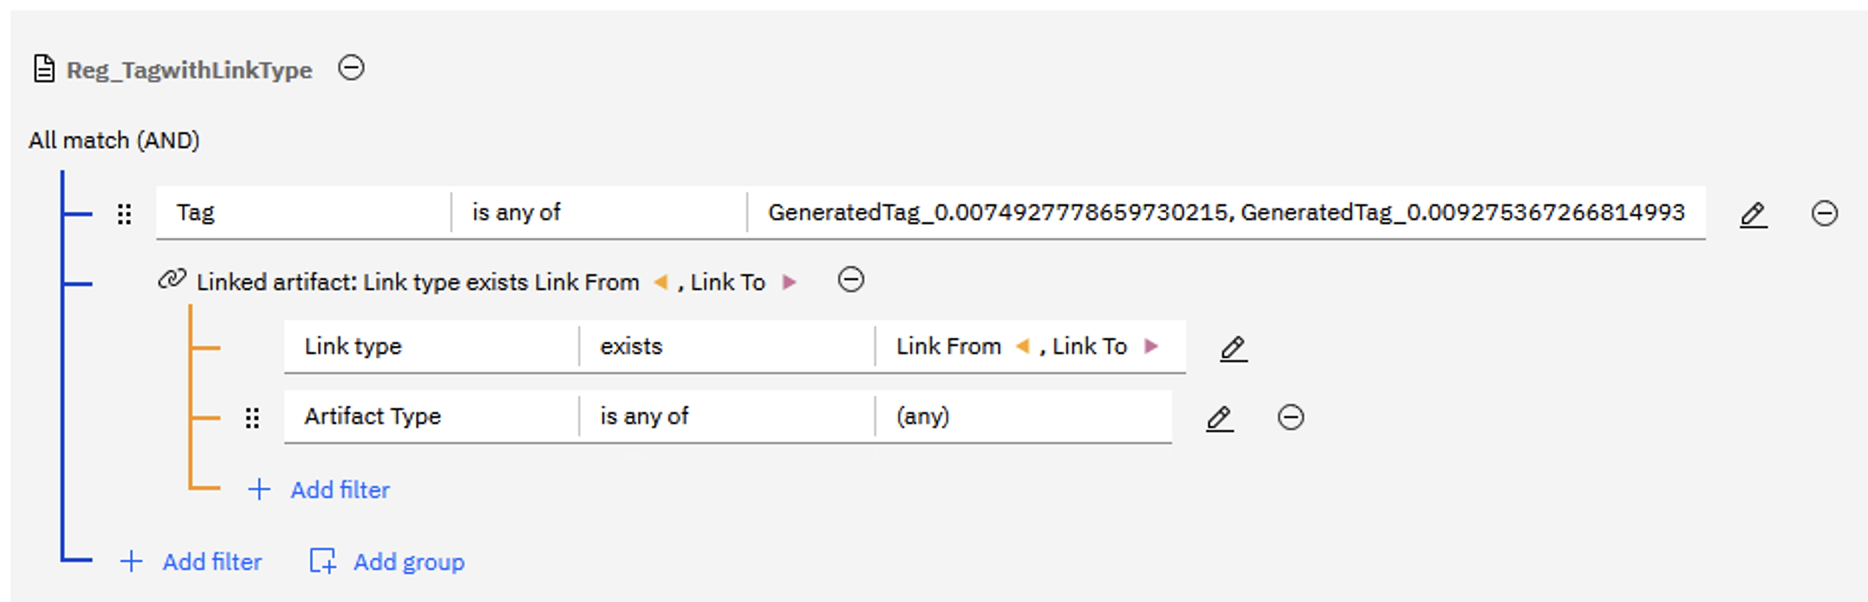
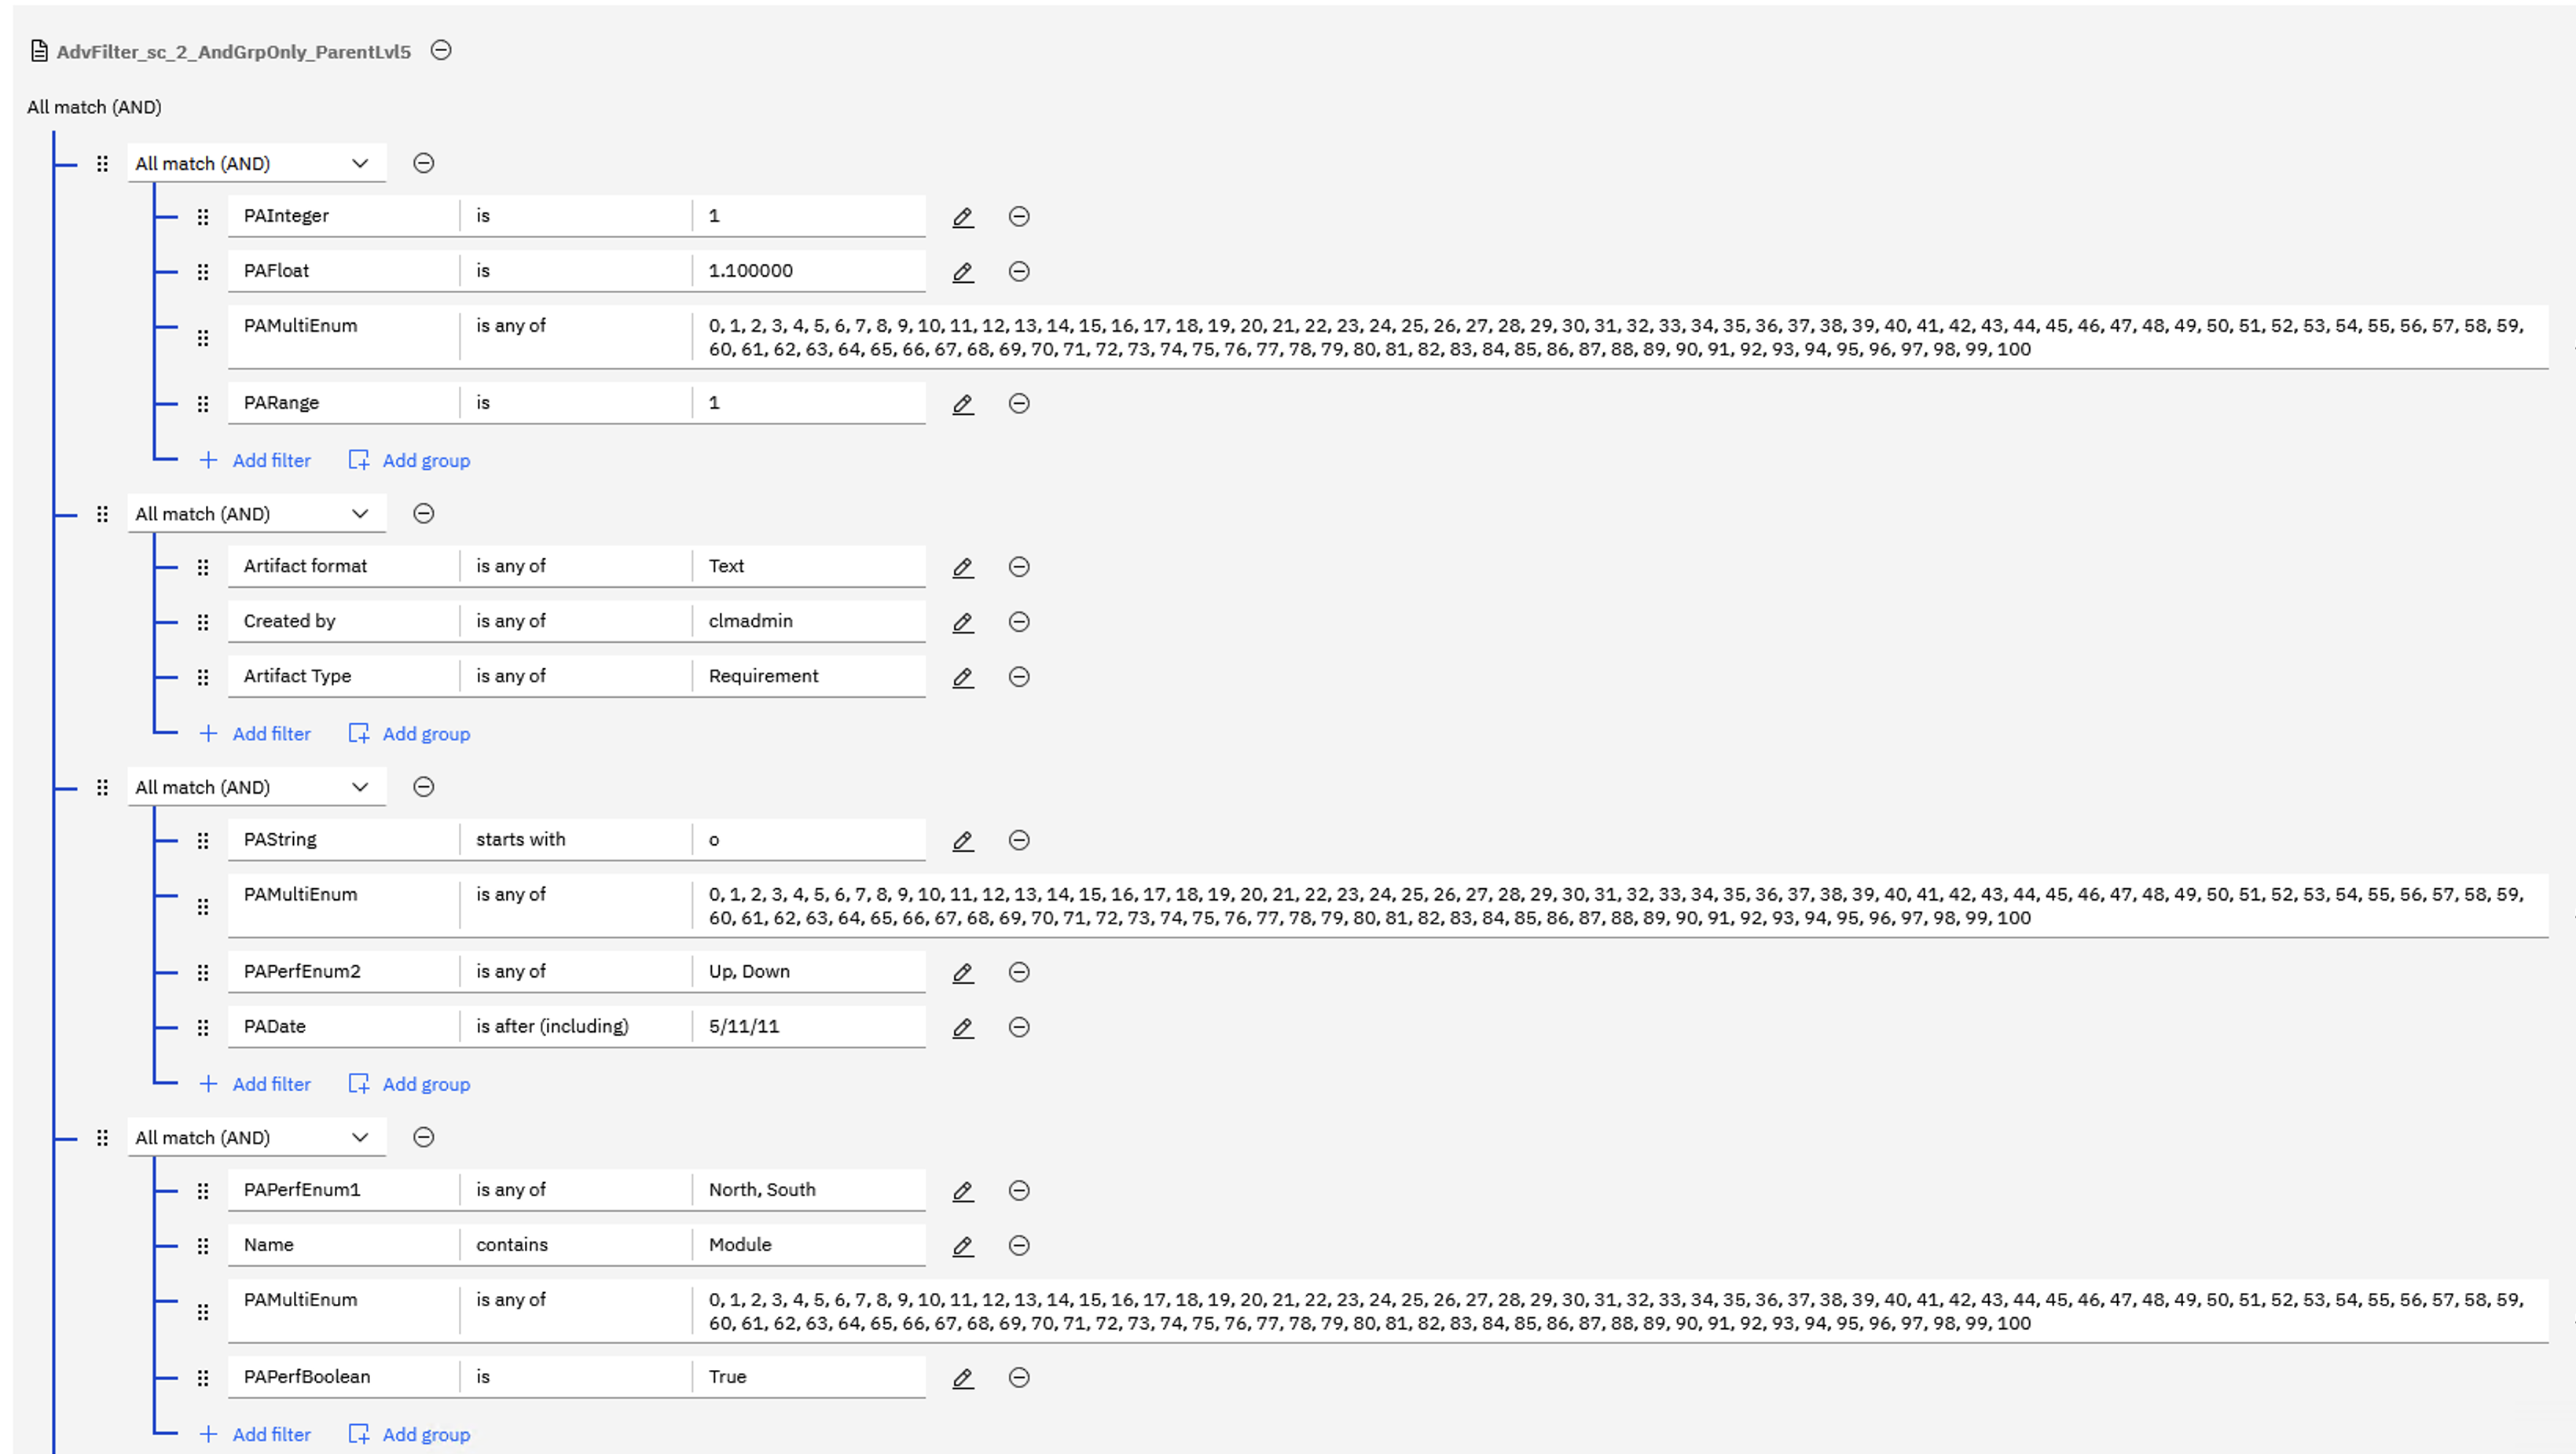
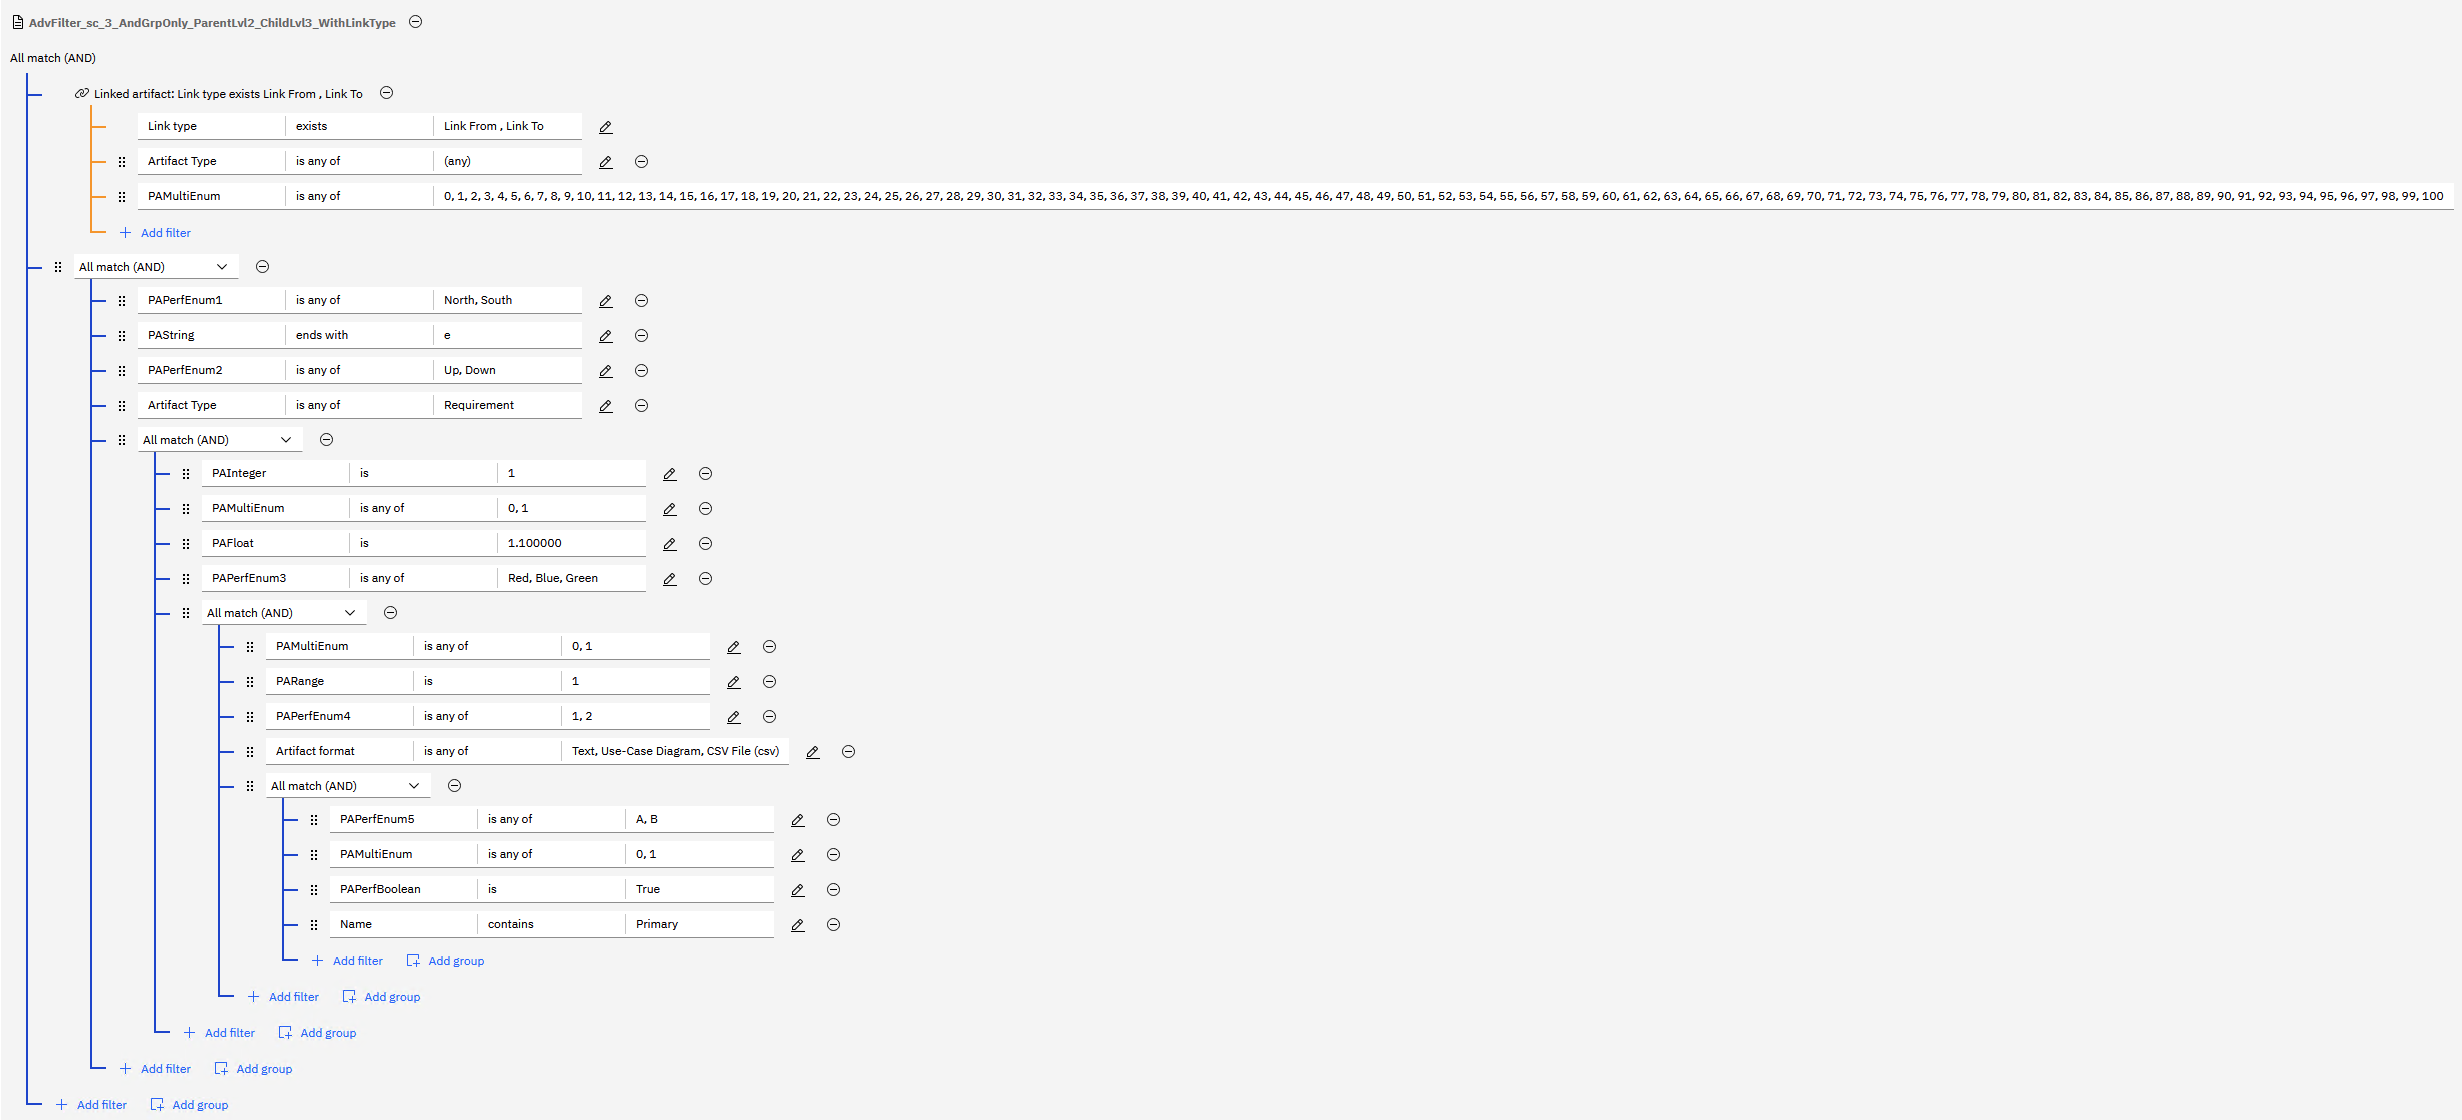
The 145 views are a mix of simple views, complex views with many filters, and views with filter groups nested inside other groups. The views use different kinds of filters, such as attribute values, text, dates, artifact types and linked artifacts. The three examples below show the range.
Simple view: a Tag filter combined with a linked-artifact filter (a link type exists).
 Complex view
: several filter groups, each with multiple filters. Some filters match a long list of values.
 Nested-group view
: filter groups placed inside other groups, several levels deep, combined with a linked-artifact filter.
Performance Testing Methodology
- Each of the 145 views was run by 2 users (jazz admin and jazz user), giving 290 view runs. For each view run, view query execution time was measured on the Initial Stream (IS) and on the materialized baseline (MB), which uses the query changes described above. The materialized baseline is the one produced by the Materialize Baselines feature.
- Executions 2 and 3 were averaged for each view run to remove cold-cache effects.
- Each view run was then classified by whether MB or IS was faster.
- The same 290 view runs were tested on the Oracle and the Db2 environments.
Note: the comparison reported here is between the Initial Stream and the materialized baseline. A comparison against the non-materialized baseline path is not included.
Test Environment
The view performance tests were run on two environments, using the DOORS Next application served at
rm/web. The Oracle 19c environment is the one listed in
Materialize Baselines - Test Environment. The Db2 11.5 environment is listed below. The servers are all physical servers. In the tables, RHEL is Red Hat Enterprise Linux.
View Performance Db2 Test Environment
| Server Role |
Operating System |
Application |
Virtual Cores |
RAM |
| Web / Reverse Proxy | RHEL 7.9 | IBM HTTP Server | 8 | 16 GB |
| JTS Server | RHEL 8.x | JTS | 24 | 32 GB |
| RM/DOORS Next Server | RHEL 7.9 | RM/DOORS Next Server | 24 | 32 GB |
| Db2 Database Server | RHEL 7.9 | Db2 11.5 | 24 | 192 GB |
Considerations and Limitations
To avoid misreading the numbers above, please keep the following in mind when planning for this feature:
- The enhancement does not speed up every view. The Initial Stream was faster for 32.4% of the Oracle view runs and 45.2% of the Db2 view runs. Customers with complex or large view definitions should validate the improvement in their own environment before expecting consistent gains.
- Local baselines only. The enhancement was tested for local baselines only. GC baseline contexts were not tested, so no performance data is available for them.
- Both query changes are needed. Full effectiveness requires GTT usage and hint removal to be applied together.
- Results are counts of faster view runs, not response-time gains. This article reports how many of the 290 view runs were faster, not by how much. A view run that is faster by a small margin counts the same as one that is much faster.
- Reliability on Db2. Removing the 32 timeout cases is a reliability improvement on its own, separate from the comparison of response times.
Abbreviations
- RM: Requirements Management
- TRS: Tracked Resource Set
- ELM: Engineering Lifecycle Management
- GC: Global Configuration
- GCM: Global Configuration Management
- GTT: Global Temporary Table
- IS: Initial Stream
- MB: Materialized Baseline
- RPT: Rational Performance Tester
- JTS: Jazz Team Server
- RHEL: Red Hat Enterprise Linux
- SLA: Service Level Agreement
- I/O: Input/Output


 png


 Copyright © by IBM and non-IBM contributing authors. All material on this collaboration platform is the property of the contributing authors.