 Collaborative Lifecycle Management performance report: Rational Team Concert 6.0 release
Authors: Alfredo Bittencourt, Vaughn Rokosz
Last updated: Jan 13, 2016
Build basis: Rational Team Concert 6.0
- Introduction
- Methodology
- Full Workload Performance Result
- Query and View Defect Performance Result
- Query and Edit Defect Performance Result
- Create Defect Performance Result
- Dashboards Performance Result
- Work Item Graph Dashboard Performance Result
- Feeds Dashboard Performance Result
- Appendix A - Key configuration parameters
Introduction
This article demonstrates how the Rational Change and Configuration Management (CCM) 6.0 perform a range of use cases with a specific number of concurrent users with a specific hardware and system configuration. Organizations can use this information as a reference when making decisions concerning the software, hardware and network configurations needed to implement CCM 6.0 products successfully. The test methodology involves:- Collecting the standard 20 minutes performance test data using user stages ranging from 100 to 1,000 concurrent users with 100 user increment intervals.
- Executing all use cases in a single test suite to define the limit of concurrent users based on this standard workload.
- Executing each use case individually to define the limit of concurrent users per scenario.
- Using a standard hardware and installation topology throughout the tests in order to evaluate the workload related to each user case and how they interact in a performance perspective. Further details about the configuration parameters can be found on Appendix A.
- All the detailed information is shown until the limiting user stage. All the data after the server is overloaded is not reliable as the server just becomes unresponsive.
Disclaimer
The information in this document is distributed AS IS. The use of this information or the implementation of any of these techniques is a customer responsibility and depends on the customers ability to evaluate and integrate them into the customers operational environment. While each item may have been reviewed by IBM for accuracy in a specific situation, there is no guarantee that the same or similar results will be obtained elsewhere. Customers attempting to adapt these techniques to their own environments do so at their own risk. Any pointers in this publication to external Web sites are provided for convenience only and do not in any manner serve as an endorsement of these Web sites. Any performance data contained in this document was determined in a controlled environment, and therefore, the results that may be obtained in other operating environments may vary significantly. Users of this document should verify the applicable data for their specific environment. Performance is based on measurements and projections using standard IBM benchmarks in a controlled environment. The actual throughput or performance that any user will experience will vary depending upon many factors, including considerations such as the amount of multi-programming in the users job stream, the I/O configuration, the storage configuration, and the workload processed. Therefore, no assurance can be given that an individual user will achieve results similar to those stated here. This testing was done as a way to compare and characterize the differences in performance between different versions of the product. The results shown here should thus be looked at as a comparison of the contrasting performance between different versions, and not as an absolute benchmark of performance.Methodology
Rational Performance Tester (RPT) was used to simulate the workload created using the web client. Each user completed a random use case from a set of available use cases. A Rational Performance Tester script is created for each use case. The scripts are organized by pages and each page represents a user action. The work load is role based as each of the areas defined under sequence of actions which are separated into individual user groups within an RPT schedule. A new user starts its actions every 5 seconds until the number of users for that stage is achieved. There is five minutes settle time in order to avoid the workload generated by the user ramp up to interfere with the stage results. After the settle time, the user stage is executed for 20 minutes, where each user performs use case at least two times in a random interval. When the stage is completed, RPT starts adding new users in order to move to the next stage. The limiting stage is defined by the last stage where the servers are presenting acceptable average response times, for this test defined as 2 seconds. The following graph illustrates the user load over time during the text execution:
User roles, test cases and workload characterization
Test Cases| Use role | Related Actions |
|---|---|
Query and View Defect |
Click work item dropdown, View shared queries, Run browse defect query and View work item. |
Query and Edit Defect |
Click work item dropdown, View shared queries, Run edit defect query, View work item, Update description and Save edit work item. |
Create Defect |
Click work item dropdown, Select create new defect, Filled against choose project and Save new defect. |
View Feeds dashboard |
Open the Feeds Dashboard. |
View Work Items Graph dashboard |
Open the Work Items Graph dashboard. |
View Work Item Query dashboard |
Open the Work Item Query dashboard. |
Page performance
The page performance is measured as mean value (or average) of its response time in the result data. For the majority of the pages under tests, there is little variation between runs, and the mean values are close to median in the sample for the load.Topology
Figure 1 illustrates the topology under test, which is based on Standard Topology (E1) Enterprise - Distributed / Linux / DB2.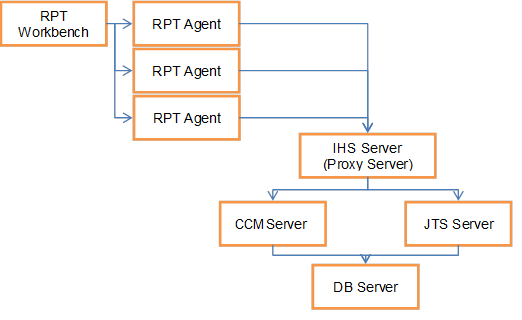 The specifications of machines under test are listed in the table below. Server tuning details listed in Appendix A
Function | Number of Machines | Machine Type | CPU / Machine | # of CPU | Memory/Machine | Disk | Disk capacity | Network interface | OS and Version |
|---|---|---|---|---|---|---|---|---|---|
Proxy Server (IBM HTTP Server and WebSphere Plugin) |
1 |
IBM System x3550 M4 |
4 x Intel Xeon |
4 |
4GB |
RAID 1 SAS Disk x 2 |
299GB |
Gigabit Ethernet |
Red Hat Enterprise Linux Server release 6.5 |
JTS Server |
1 |
IBM System x3550 M4 |
4 x Intel Xeon |
4 |
8GB |
RAID 5 SAS Disk x 2 |
897GB |
Gigabit Ethernet |
Red Hat Enterprise Linux Server release 6.5 |
QM Server |
1 |
IBM System x3550 M4 |
4 x Intel Xeon E5-2640 2.5GHz |
4 |
8GB |
RAID 5 SAS Disk x 2 |
897GB |
Gigabit Ethernet |
Red Hat Enterprise Linux Server release 6.5 |
Database Server |
1 |
IBM System x3650 M4 |
4 x Intel Xeon E5-2640 2.5GHz |
4 |
8GB |
RAID 5 SAS Disk x 2 |
2.4TB |
Gigabit Ethernet |
Red Hat Enterprise Linux Server release 6.1 |
RPT workbench |
1 |
IBM System x3550 M4 |
4 x Intel Xeon E5-2640 2.5GHz |
4 |
8GB |
RAID 5 SAS Disk x 2 |
30GB |
Gigabit Ethernet |
Red Hat Enterprise Linux Server release 6.4 |
RPT Agents |
3 |
IBM System x3550 M4 |
4 x Intel Xeon E5-2640 2.5GHz |
4 |
8GB |
N/A |
30GB |
Gigabit Ethernet |
Red Hat Enterprise Linux Server release 6.5 |
Network switches |
N/A |
Cisco 2960G-24TC-L |
N/A |
N/A |
N/A |
N/A |
N/A |
Gigabit Ethernet |
24 Ethernet 10/100/1000 ports |
Network connectivity
All server machines and test clients are located on the same subnet. The LAN has 1000 Mbps of maximum bandwidth and less than 0.3 ms latency in ping.Data volume and shape
The artifacts were created on 6.0GA repository which contains a total of 100,220 artifacts in one large project.Full Workload Performance Result
Workload characterization
Test Cases| Use role | % of Total | Related Actions |
|---|---|---|
Query and View Defect |
50 |
Work item dropdown, View shared queries, Run browse defect query and View work item. |
Query and Edit Defect |
25 |
Work item dropdown, View shared queries, Run edit defect query, View work item, Update description and Save edit work item. |
Create Defect |
20 |
Work item dropdown, Select create new defect, Filled against choose project and Save new defect. |
View Feeds dashboard |
1.67 |
Open the Feeds Dashboard |
View Work Items Graph dashboard |
1.66 |
Open the Work Items Graph dashboard |
View Work Item Query dashboard |
1.66 |
View Work Item Query dashboard |
Average page response time
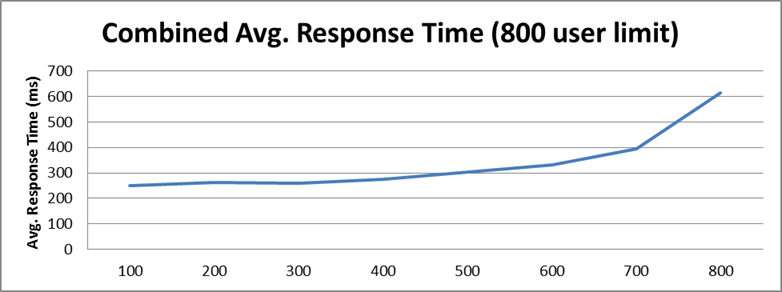
This load test reproduced an environment under full load reaching 1000 concurrent users. The following graph shows the average page response time (in milliseconds) ranging from 100 to 1000 concurrent users in 100 user increment intervals. At the 800 user stage the average response time starts to increase rapidly, indicating that the server reached its limit. The combined work order graphs shows the average response time calculated based on all the steps in this execution.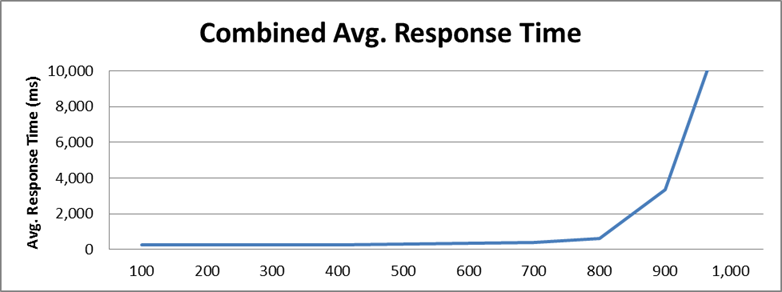 This test requested an average of 84.1 elements/second and 13.63 pages/second at the 800 user stage, its maximum capacity. The average response time for all pages was 614.45 ms, jumping to 3,302.7 ms when overloaded at 900 user stage.
Performance result breakdown
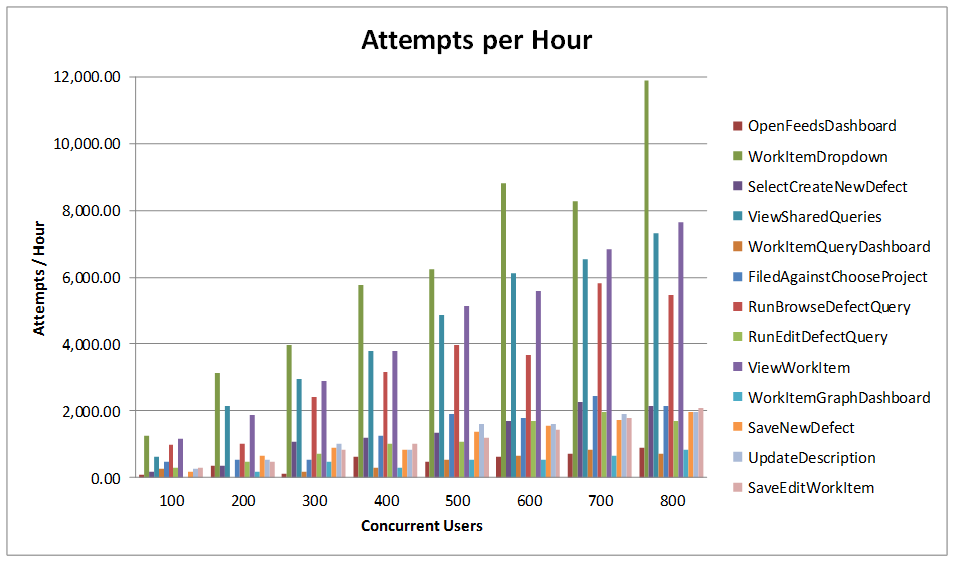
The following graph shows the average step response time for each user stage in milliseconds. Each step is part of a test case listed on the table Test Cases. In this case, a lower number is better.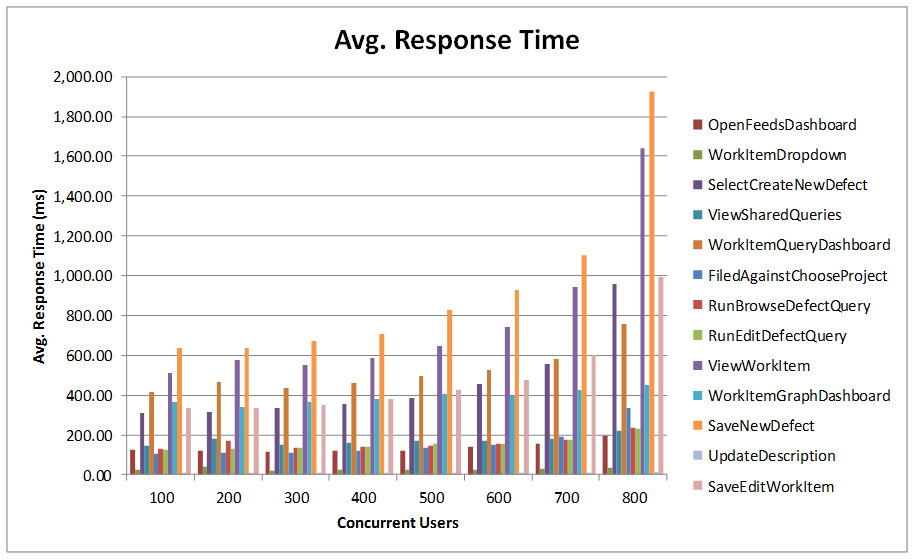 The average number of operations per hour during each user stage for each user case.
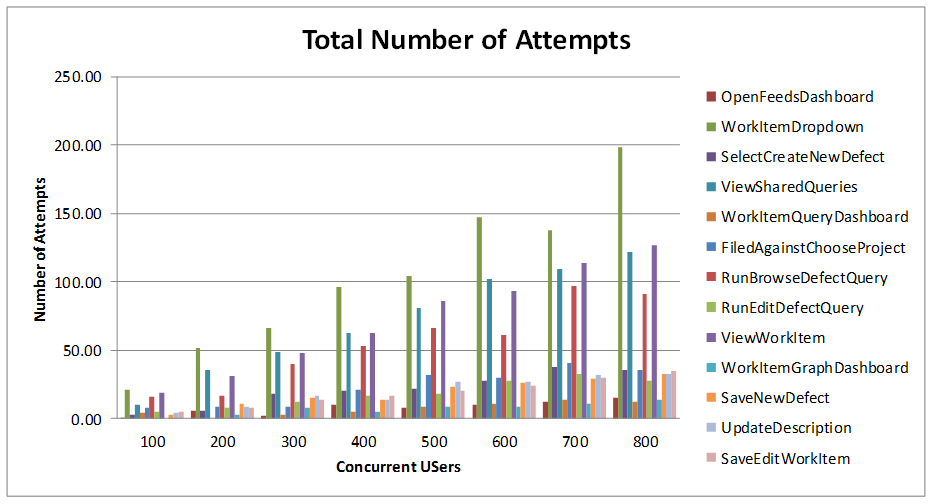
 Total number of iterations user is performing during the test for each user case.
Detailed resource utilization
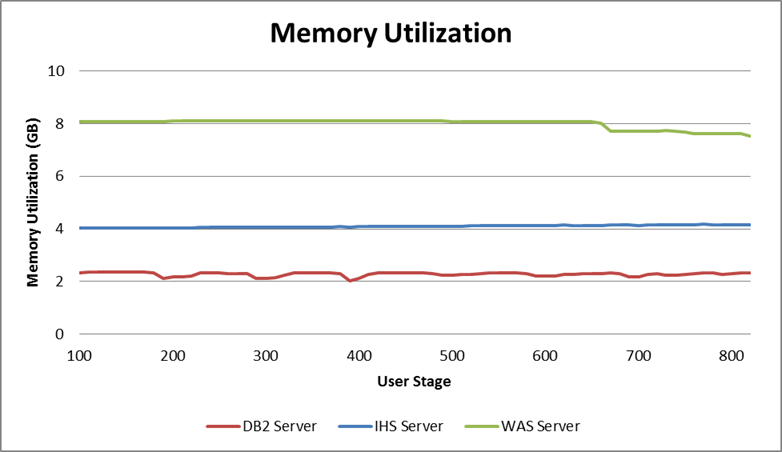
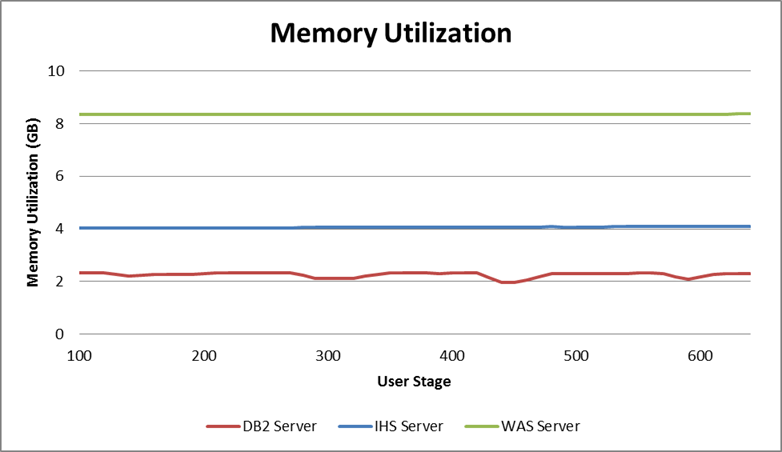
The limiting resource was the Application Server, which reached 97.8% maximum CPU utilization, with an average of 87% utilization at this stage. The database had an average of 16.9% CPU utilization, and the HTTP Server only 3.2% average CPU utilization.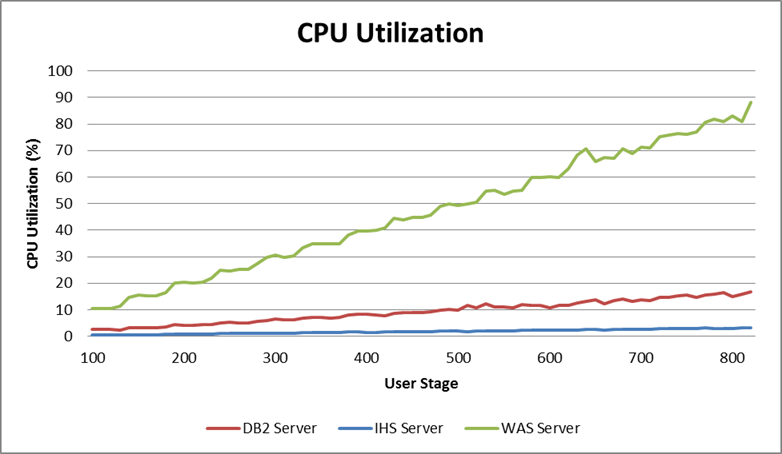 The following graph shows the average memory utilization for each server until the limiting stage.
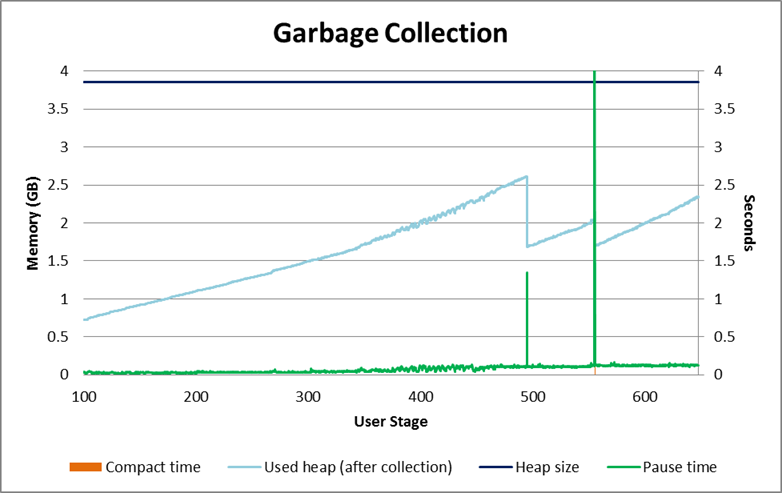
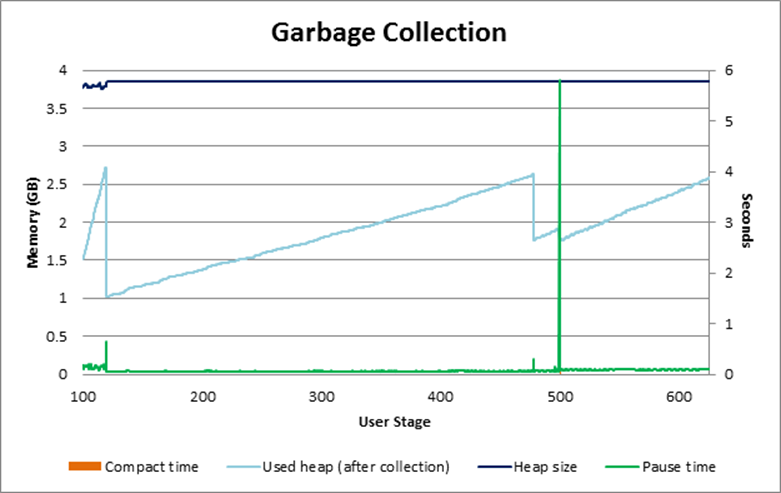
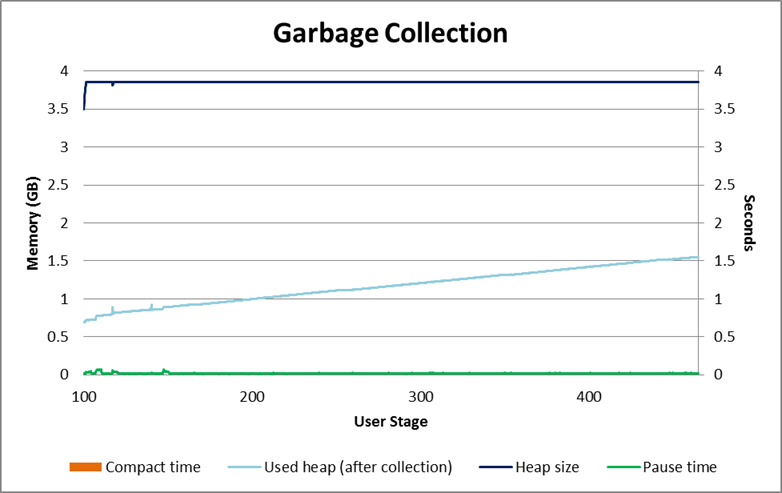
 The next graph shows the garbage collector behavior during the test. Detailed garbage collector configuration can be found in Appendix A.
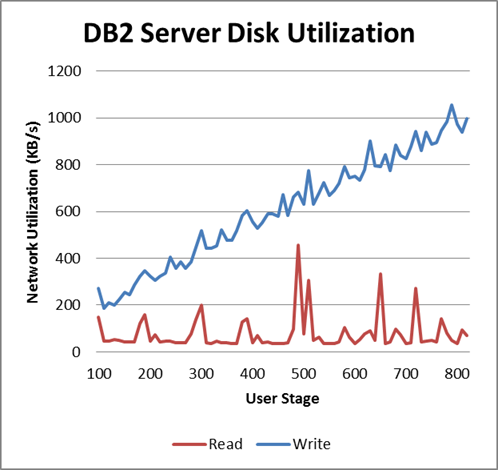
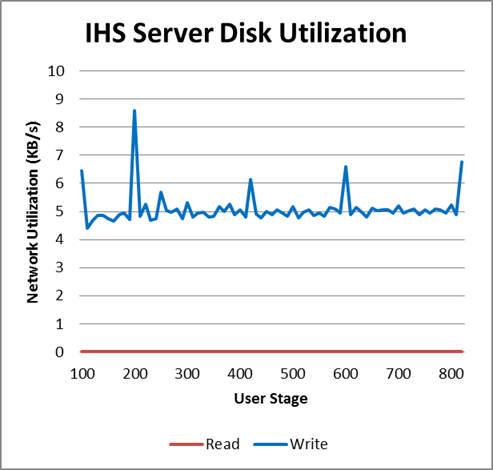
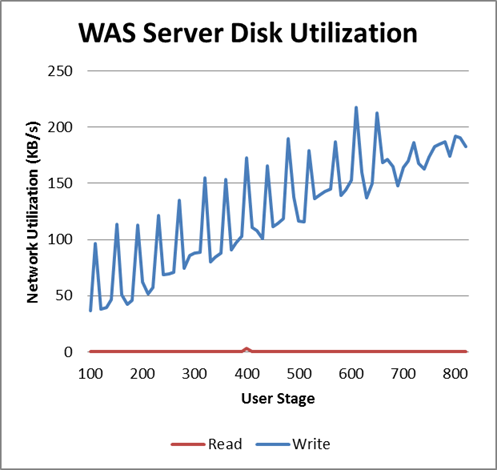
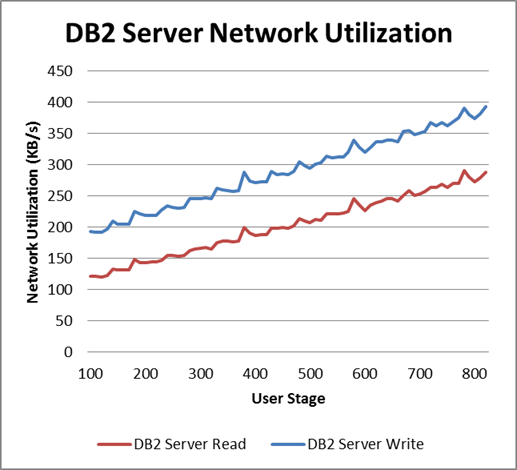
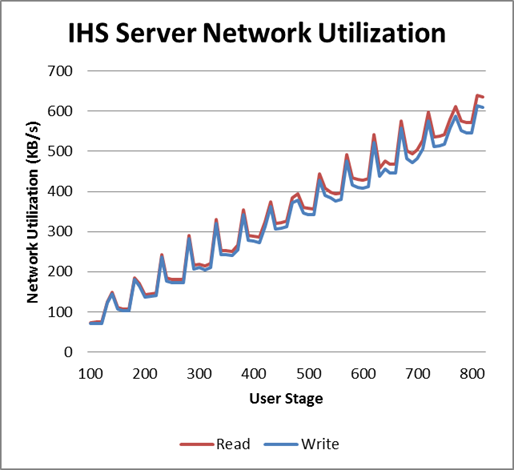
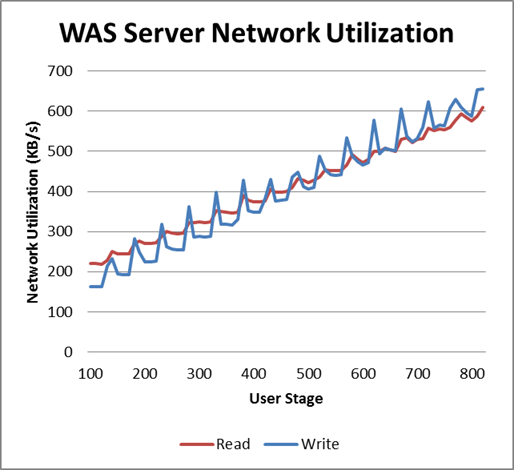
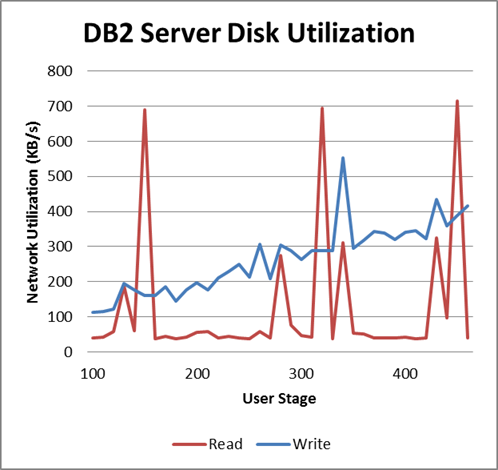
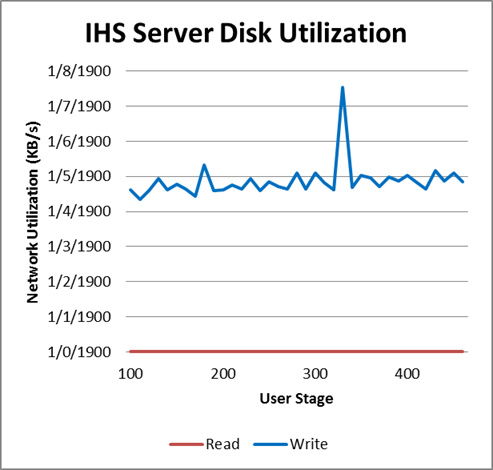
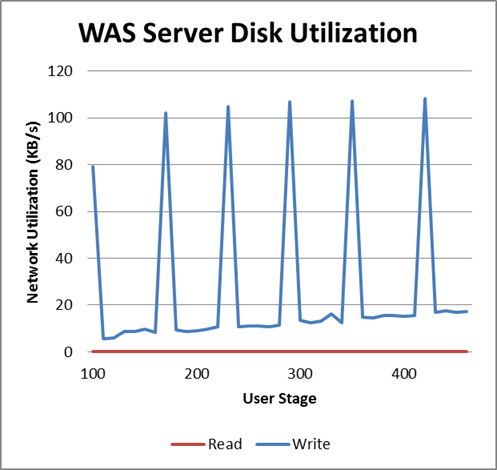
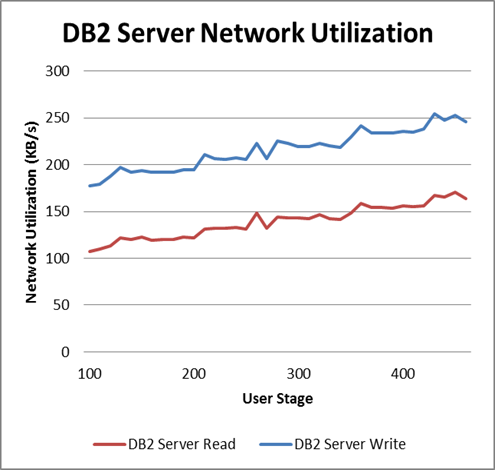
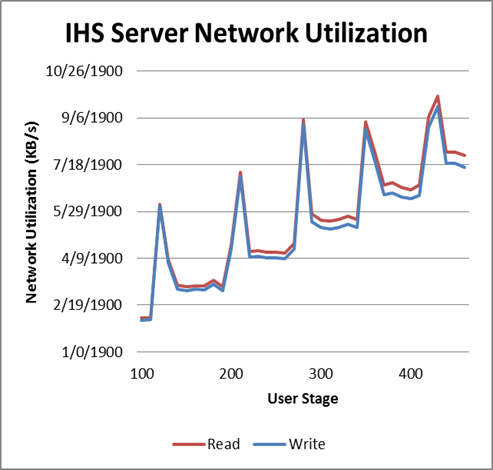
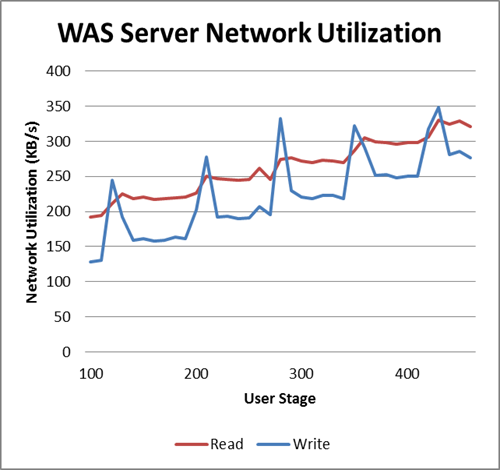
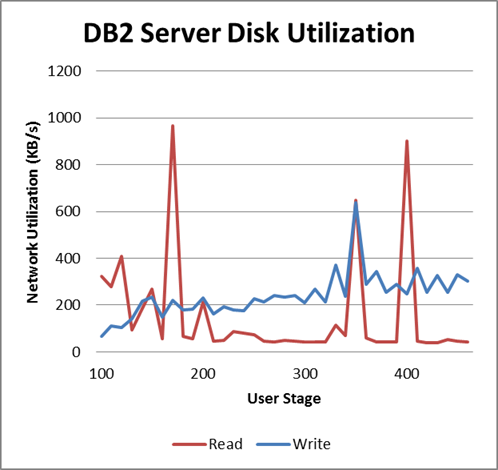
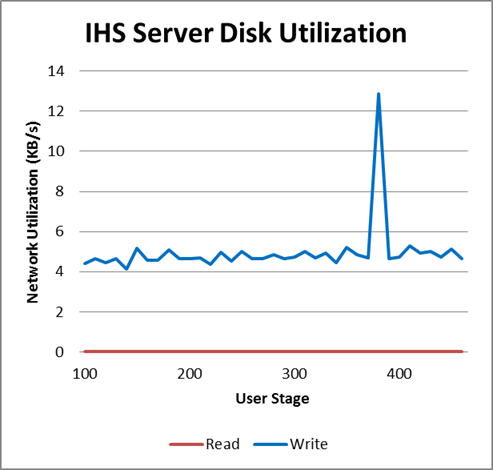
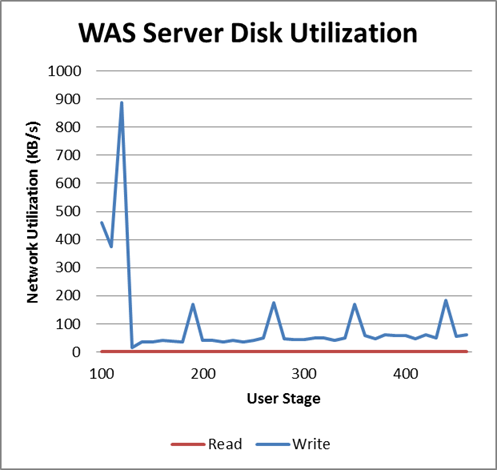
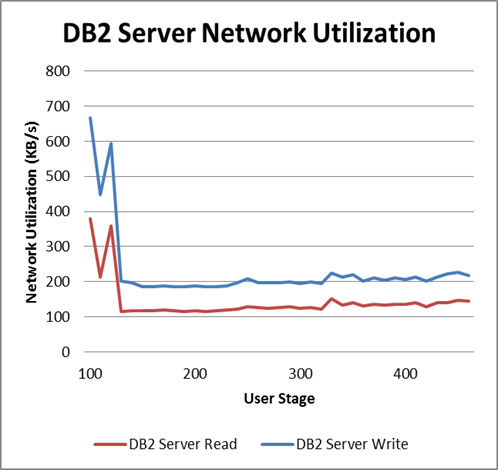
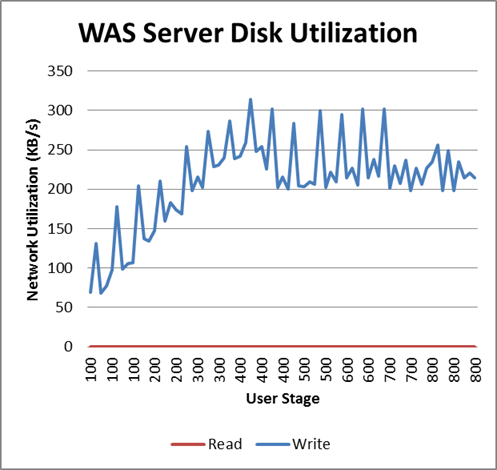
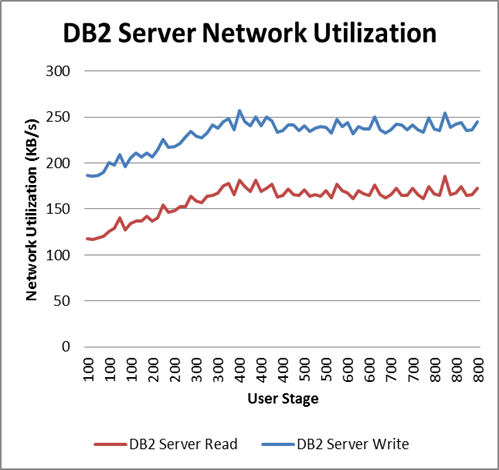
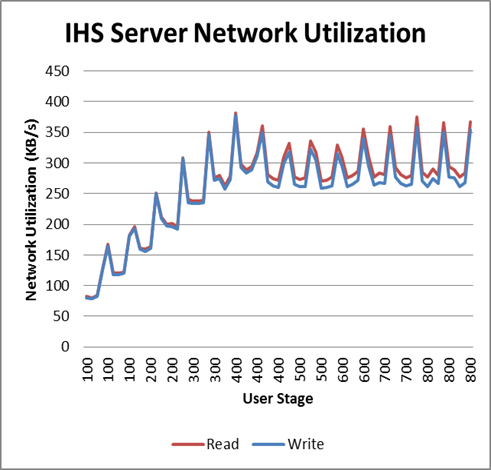
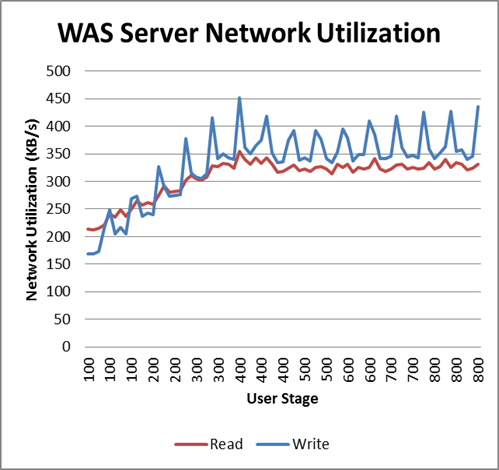
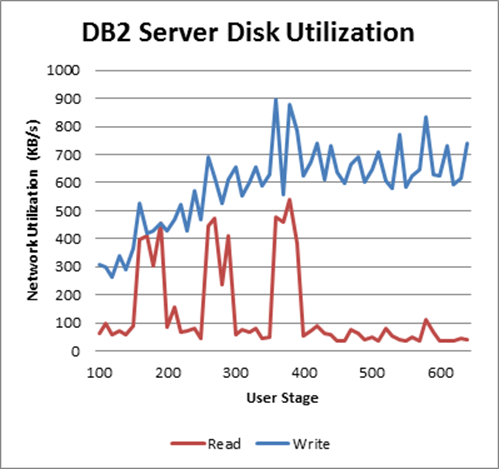
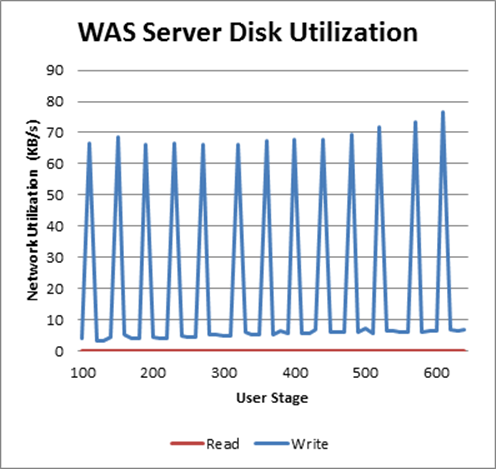
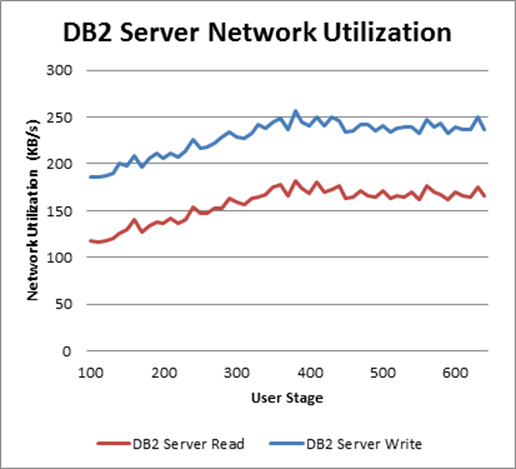
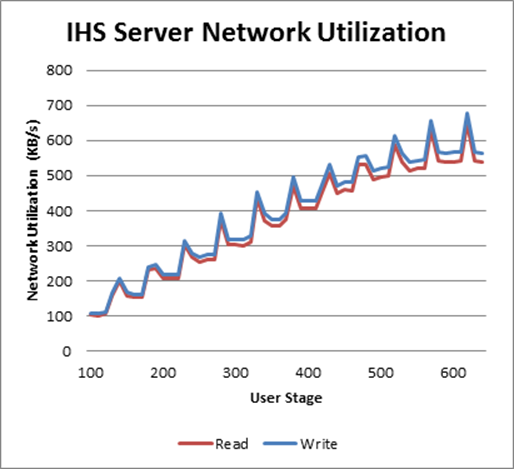
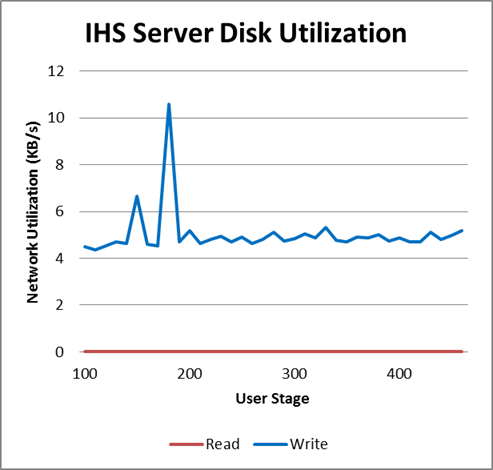
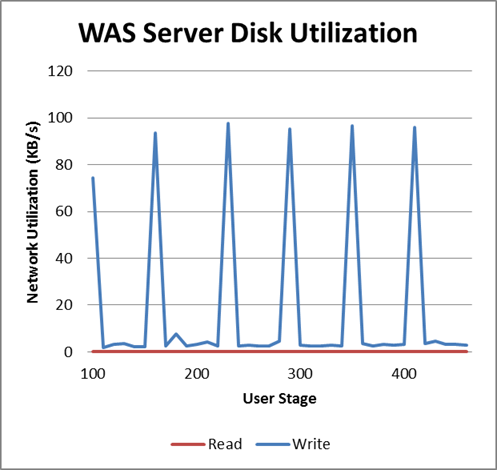
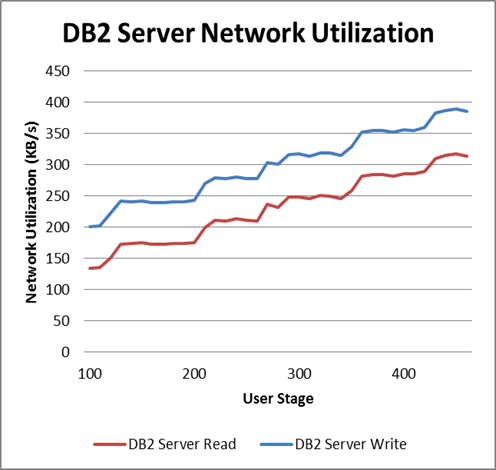
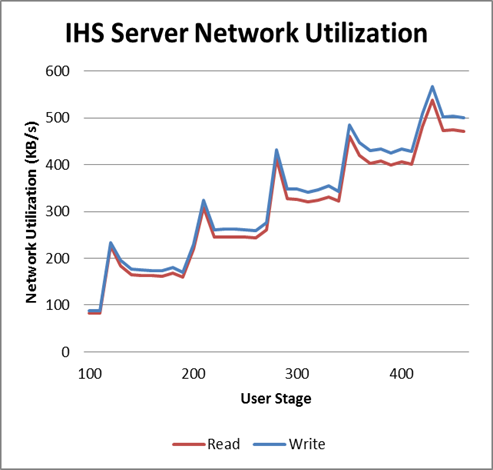
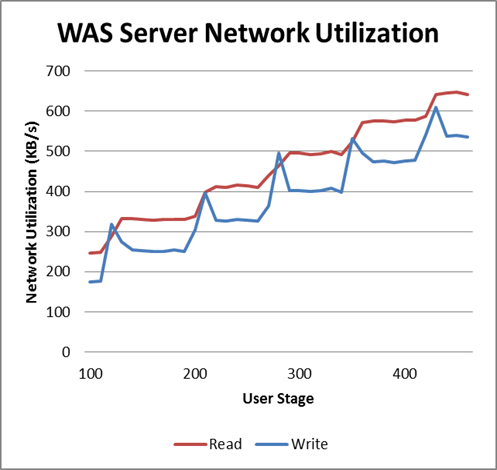
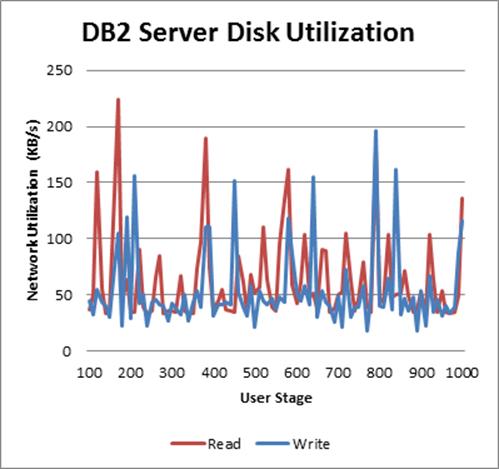
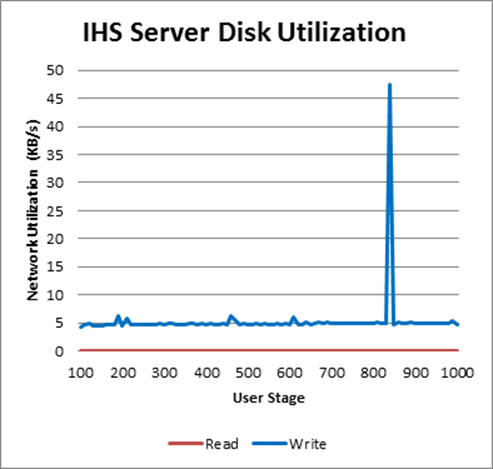
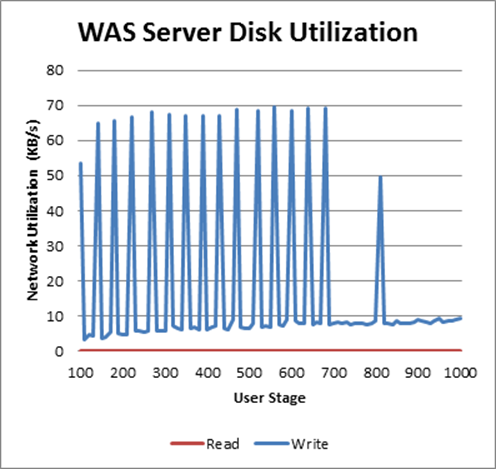
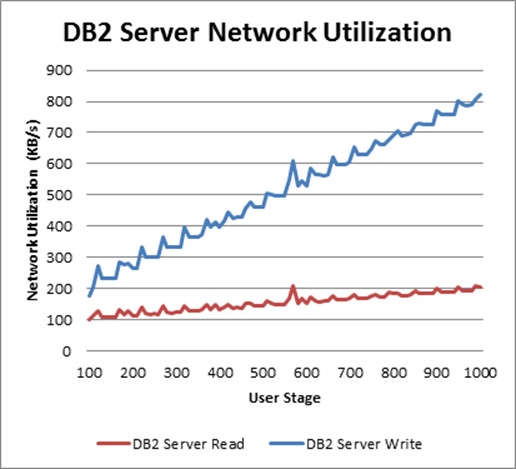
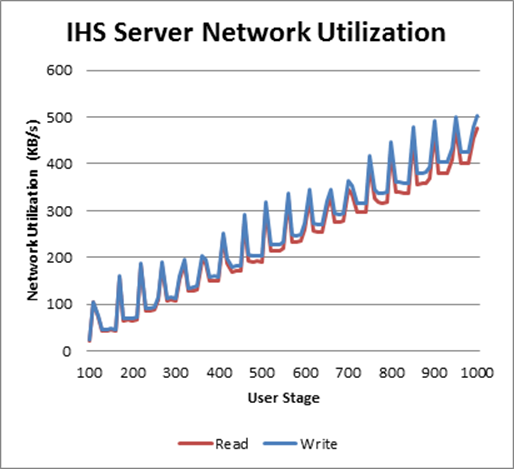
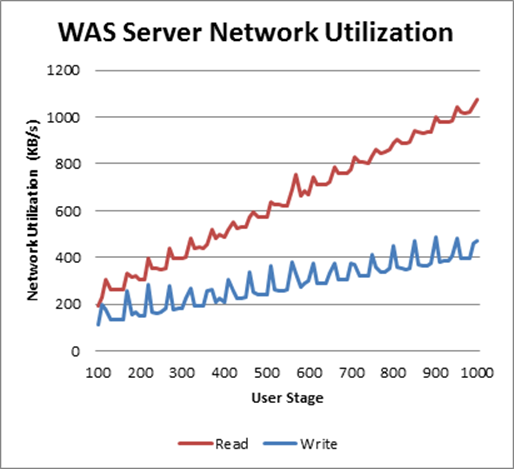
 Additional information regarding disk and network for each server during the test can be found on the following graphs.
Query and View Defect Performance Result
Workload characterization
Test Cases| Use role | % of Total | Related Actions |
|---|---|---|
Query and View Defect |
100 |
Click work item dropdown, View shared queries, Run browse defect query and View work item. |
Average page response time
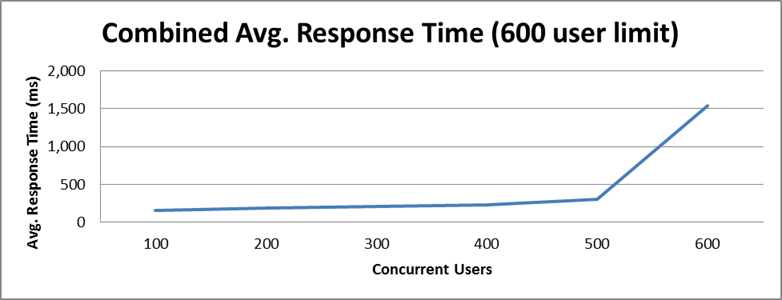
This load test reproduced an environment under full load reaching 1000 concurrent users. The following graph shows the average page response time (in milliseconds) ranging from 100 to 1000 concurrent users in 100 user increment intervals. At the 600 user stage the average response time starts to increase rapidly, indicating that the server reached its limit. The combined work order graphs shows the average response time calculated based on all the steps in this execution.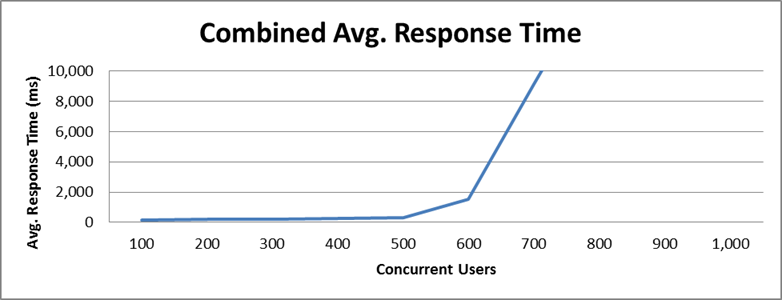 This test requested an average of 73.45 elements/second and 9.66 pages/second at the 600 user stage, its maximum capacity. The average response time for all pages was 301.23 ms, increasing to 1,544.62 ms when overloaded. The work item dashboard alone reached an average response time of 7.7 seconds.
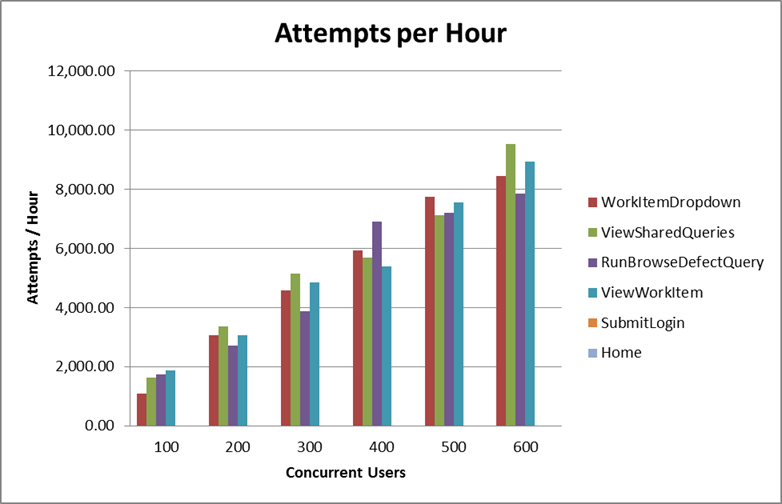
Performance result breakdown
The following graph shows the average step response time for each user stage in milliseconds. Each step is part of a test case listed on the table Test Cases. In this case, a lower number is better. On the 600 user stage, the View Work Item step reaches 7.7 seconds. This graphs was scaled back to 2.5 seconds in order to better represent the early stages.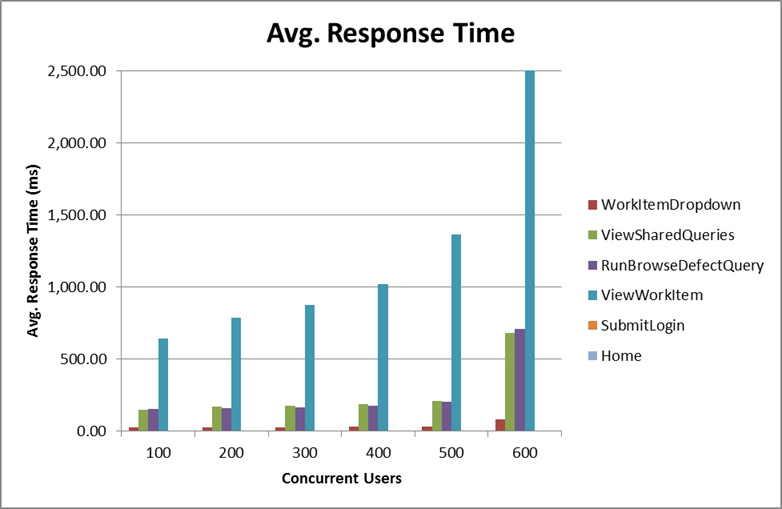 The average number of operations per hour during each user stage for each user case.
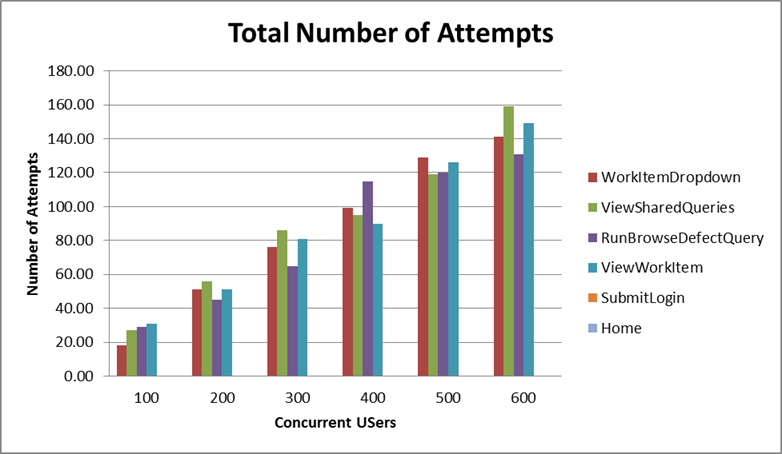
 Total number of iterations user is performing during the test for each user case.
Detailed resource utilization
The Application Server reached 55.87% maximum CPU utilization, with an average of 51.1% utilization at the 400 concurrent users stage. The database had an average of 7.31% CPU utilization, and the HTTP Server 1.5% average CPU utilization.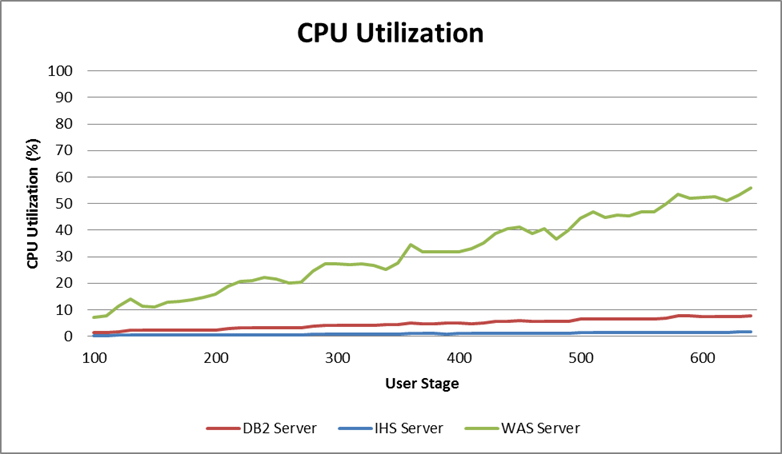 The following graph shows the average memory utilization for each server until the limiting stage.
 The next graph shows the garbage collector behavior during the test. Detailed garbage collector configuration can be found in Appendix A.
 Additional information regarding disk and network for each server during the test can be found on the following graphs.
Query and Edit Defect Performance Result
Workload characterization
Test Cases| Use role | % of Total | Related Actions |
|---|---|---|
Query and Edit Defect |
100 |
Click work item dropdown, View shared queries, Run edit defect query, View work item, Update description and Save edit work item. |
Average page response time
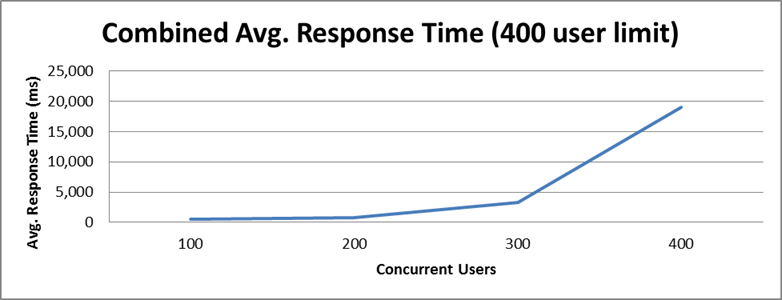
This load test reproduced an environment under full load reaching 1000 concurrent users. The following graph shows the average page response time (in milliseconds) ranging from 100 to 1000 concurrent users in 100 user increment intervals. At the 400 user stage the average response time starts to increase rapidly, indicating that the server reached its limit. The combined work order graphs shows the average response time calculated based on all the steps in this execution.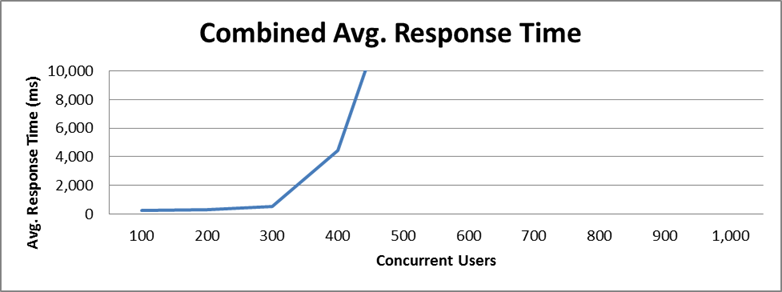 This test requested an average of 38.32 elements/second and 6.09 pages/second at the 400 user stage, its maximum capacity. The average response time for all pages was 535.96 ms, increasing to 4,437.51 ms when overloaded.

Performance result breakdown
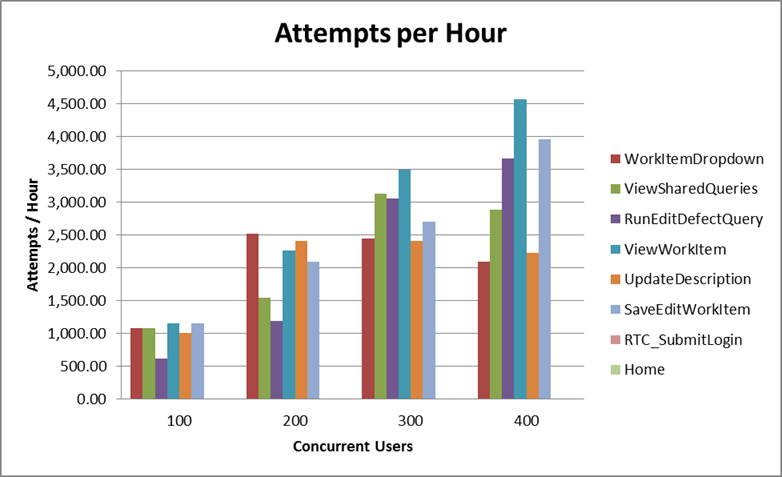
The following graph shows the average step response time for each user stage in milliseconds. Each step is part of a test case listed on the table Test Cases. In this case, a lower number is better.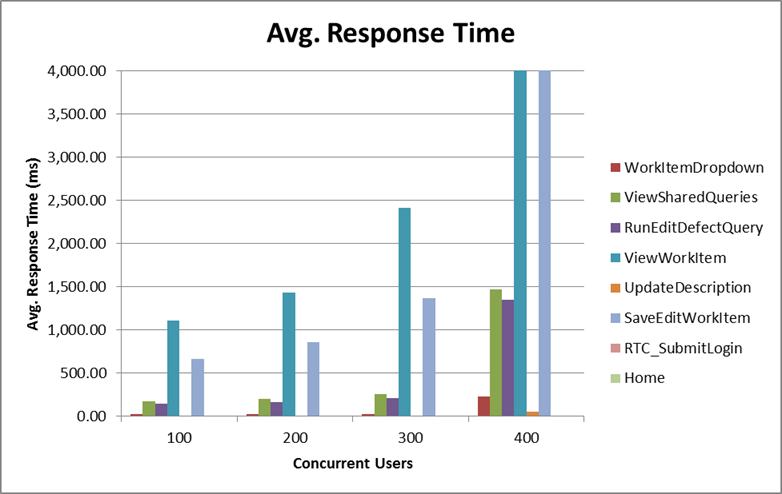 The average number of operations per hour during each user stage for each user case.
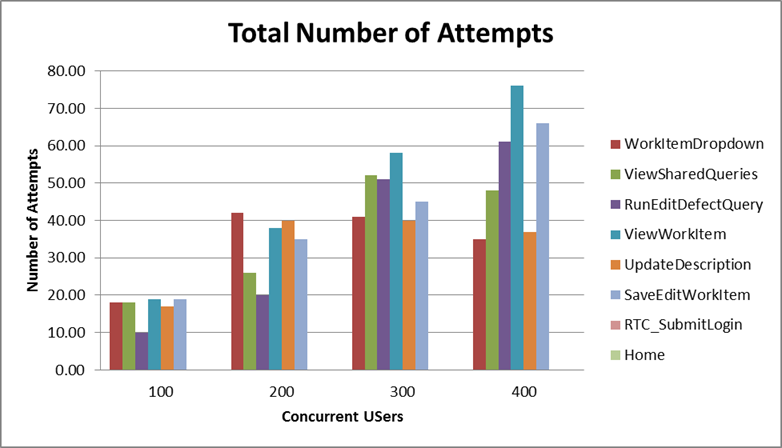
 Total number of iterations user is performing during the test for each user case.
Detailed resource utilization
The Application Server reached 98.7% maximum CPU utilization, with an average of 61.1% utilization at the 400 concurrent users stage. The database had an average of 3.22% CPU utilization, and the HTTP Server 0.75% average CPU utilization. The following graph shows the average memory utilization for each server until the limiting stage.
 The next graph shows the garbage collector behavior during the test. Detailed garbage collector configuration can be found in Appendix A.
 Additional information regarding disk and network for each server during the test can be found on the following graphs.


Create Defect Performance Result
Workload characterization
Test Cases| Use role | % of Total | Related Actions |
|---|---|---|
Create Defect |
100 |
Click work item dropdown, Select create new defect, Filled against choose project and Save new defect. |
Average page response time
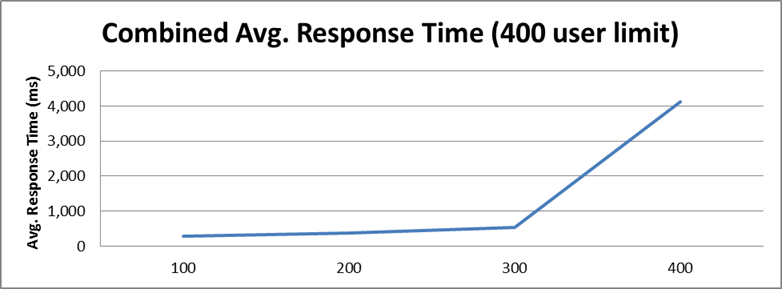
This load test reproduced an environment under full load reaching 1000 concurrent users. The following graph shows the average page response time (in milliseconds) ranging from 100 to 1000 concurrent users in 100 user increment intervals. At the 400 user stage the average response time starts to increase rapidly, indicating that the server reached its limit. The combined work order graphs shows the average response time calculated based on all the steps in this execution. This test requested an average of 45.62 elements/second and 6.02 pages/second at the 400 user stage, its maximum capacity. The average response time for all pages was 527.88 ms, jumping to 4,130.98 ms when overloaded.
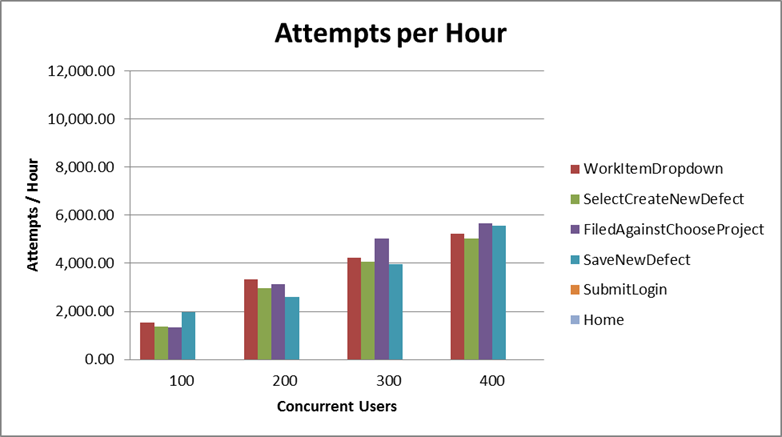
Performance result breakdown
The following graph shows the average step response time for each user stage in milliseconds. Each step is part of a test case listed on the table Test Cases. In this case, a lower number is better. The average number of operations per hour during each user stage for each user case.
 Total number of iterations user is performing during the test for each user case.

Detailed resource utilization
The limiting resource was the Application Server, which reached 98.7% maximum CPU utilization, with an average of 98.6% utilization at this stage. The database had an average of 1.24% CPU utilization, and the HTTP Server 1.47% average CPU utilization.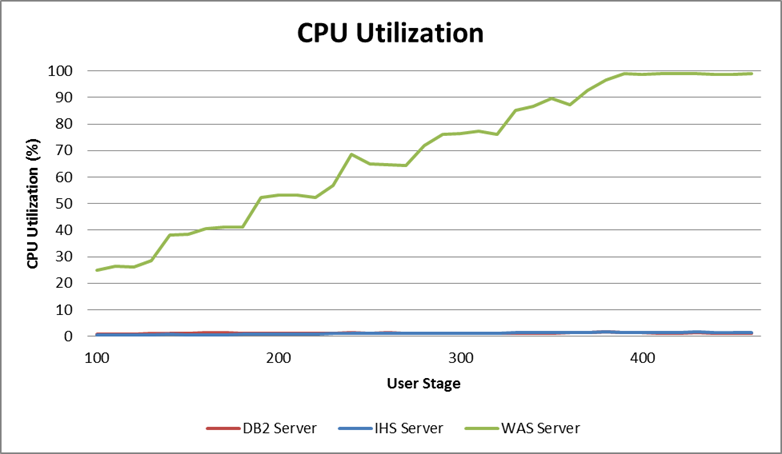 The following graph shows the average memory utilization for each server until the limiting stage.
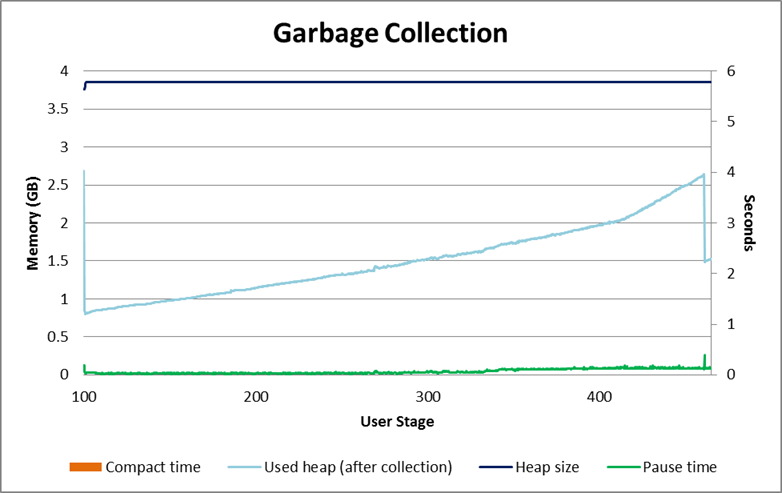
 The next graph shows the garbage collector behavior during the test. Detailed garbage collector configuration can be found in Appendix A.
 Additional information regarding disk and network for each server during the test can be found on the following graphs.


Dashboards Performance Result
Workload characterization
Test Cases| Use role | % of Total | Related Actions |
|---|---|---|
View Feeds dashboard |
34 |
Open the Feeds Dashboard |
View Work Items Graph dashboard |
33 |
Open the Work Items Graph dashboard |
View Work Item Query dashboard |
33 |
View Work Item Query dashboard |
Average page response time
This load test reproduced an environment under full load reaching 1000 concurrent users. The following graph shows the average page response time (in milliseconds) ranging from 100 to 1000 concurrent users in 100 user increment intervals. At the 600 user stage the average response time starts to increase rapidly, indicating that the server reached its limit. The combined work order graphs shows the average response time calculated based on all the steps in this execution.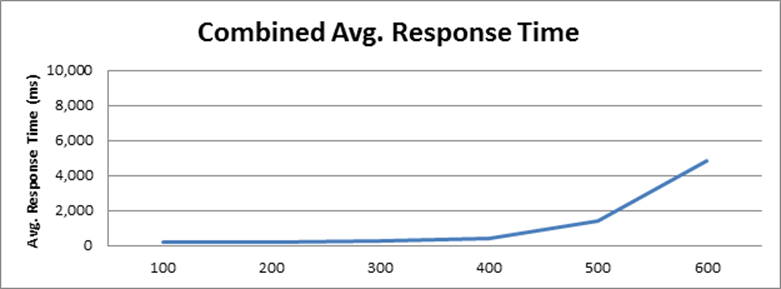 This test requested an average of 126.28 elements/second and 8.78 pages/second at the 600 user stage, its maximum capacity. The average response time for all pages was 1.04 seconds, increasing to 4.85 seconds when overloaded.

Performance result breakdown
The following graph shows the average step response time for each user stage in milliseconds. Each step is part of a test case listed on the table Test Cases. In this case, a lower number is better. On the 600 users stage, the response time reached 10.5 seconds. This graph was scaled back to 4 seconds in order to better represent the earlier stages. The average number of operations per hour during each user stage for each user case.
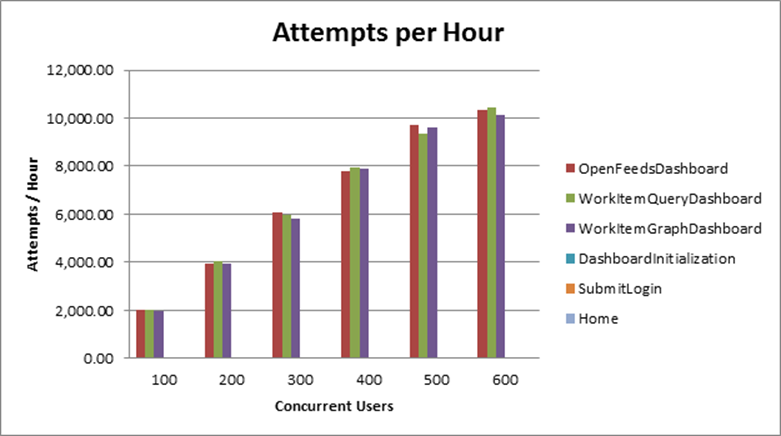
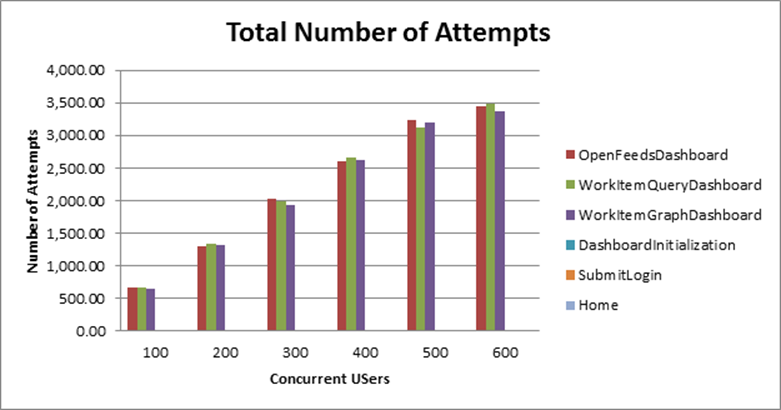
 Total number of iterations user is performing during the test for each user case.
Detailed resource utilization
The Application server reached 50.4 maximum CPU utilization, with an average of 49% utilization at the 600 concurrent user stage. The Database Server had an average of 1.21% CPU utilization, and the HTTP Server 3.68% average CPU utilization.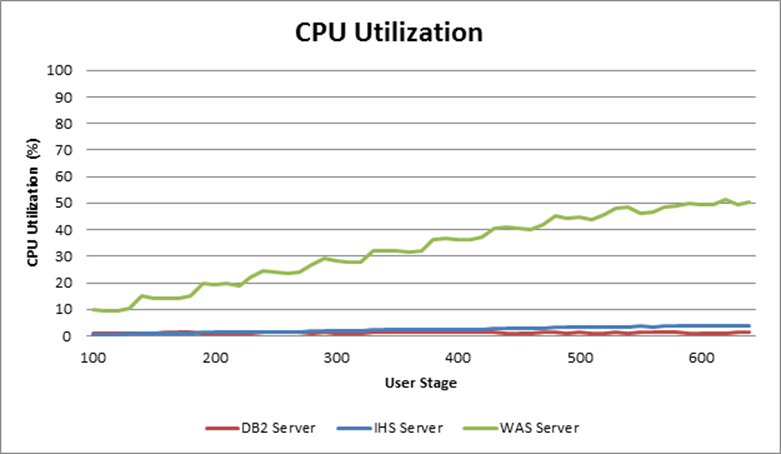 The following graph shows the average memory utilization for each server until the limiting stage.
 The next graph shows the garbage collector behavior during the test. Detailed garbage collector configuration can be found in Appendix A.
 Additional information regarding disk and network for each server during the test can be found on the following graphs.


Work Item Graph Dashboard Performance Result
Workload characterization
Test Cases| Use role | % of Total | Related Actions |
|---|---|---|
View Work Items Graph dashboard |
100 |
Open the Work Items Graph dashboard. |
Average page response time
This load test reproduced an environment under full load reaching 1000 concurrent users. The following graph shows the average page response time (in milliseconds) ranging from 100 to 1000 concurrent users in 100 user increment intervals. At the 600 user stage the average response time starts to increase rapidly, indicating that the server reached its limit. The combined work order graphs shows the average response time calculated based on all the steps in this execution.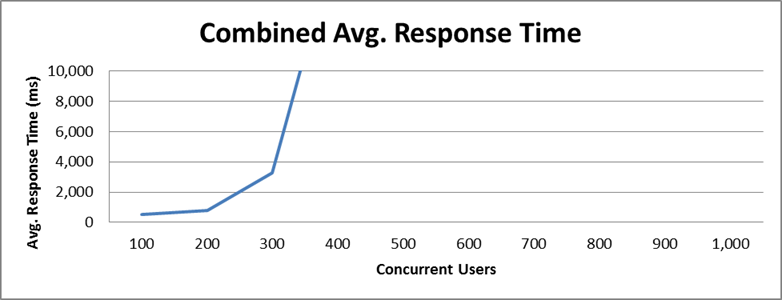 This test requested an average of 124.76 elements/second and 5.18 pages/second at the 600 user stage, its maximum capacity. The average response time for all pages was 3.26 seconds, increasing to 19.05 seconds when overloaded.
Performance result breakdown
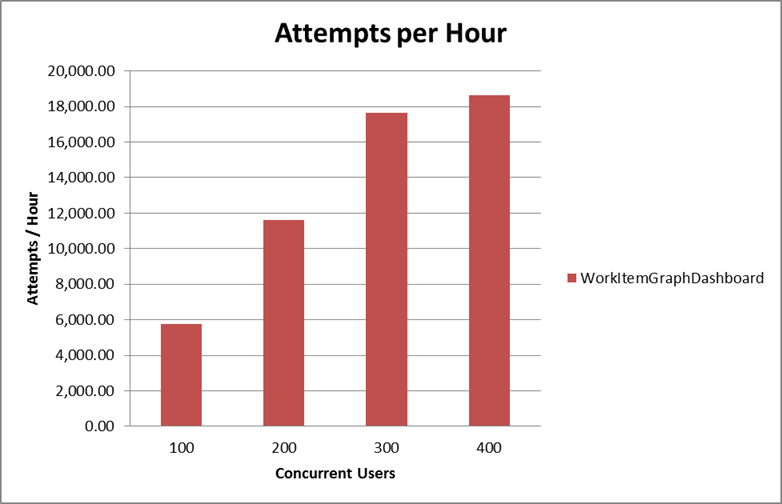
The following graph shows the average step response time for each user stage in milliseconds. Each step is part of a test case listed on the table Test Cases. In this case, a lower number is better. On the 400 user stage, the Work Item Graph Dashboard step reaches 17 seconds. This graph was scaled back to 5 seconds in order to better represent the earlier stages.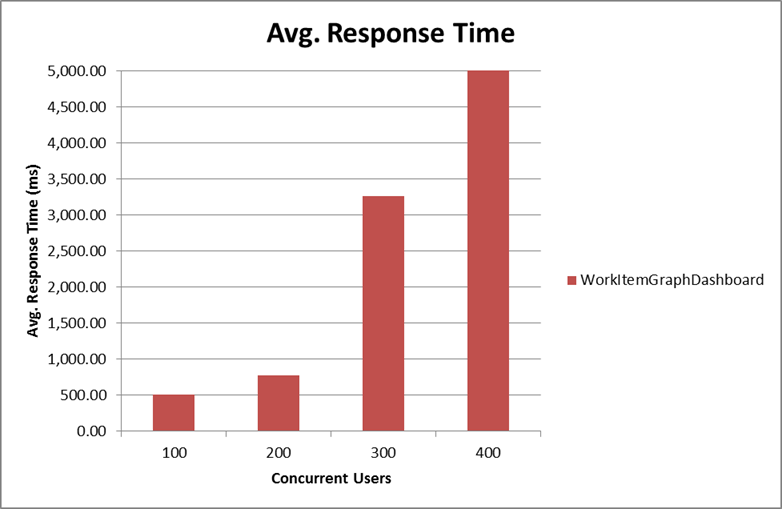 The average number of operations per hour during each user stage for each user case.
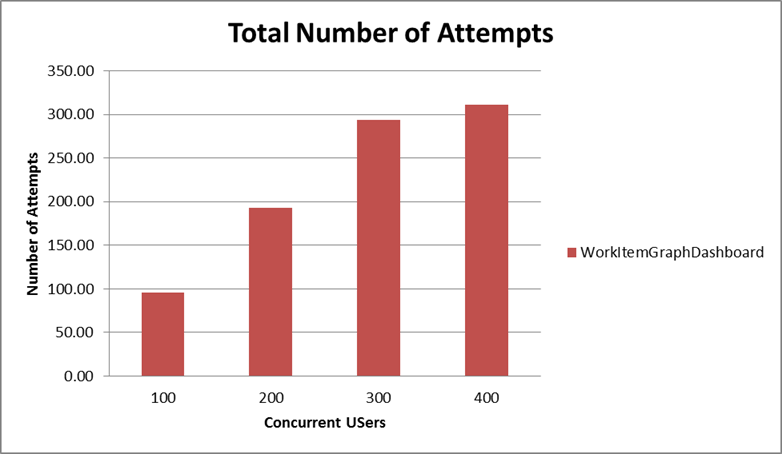
 Total number of iterations user is performing during the test for each user case.
Detailed resource utilization
The Database Server reached 92.6% maximum CPU utilization, with an average of 85% utilization at the 400 concurrent users stage, being the limiting resource for this script. The Application Server had an average of 15.25% CPU utilization, and the HTTP Server 2.42% average CPU utilization.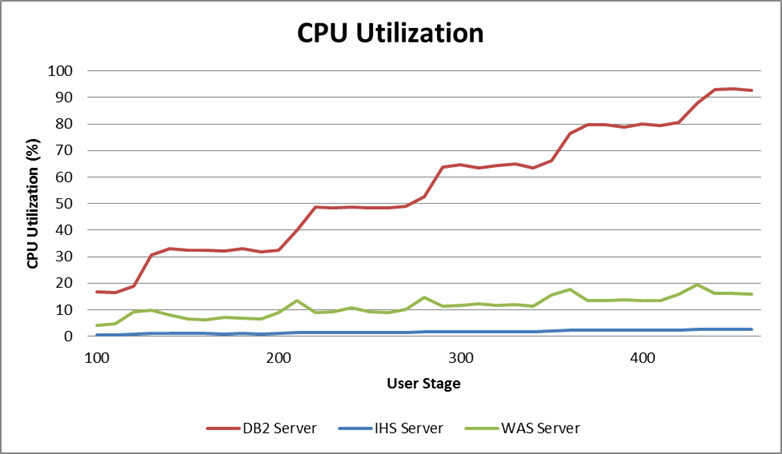 The following graph shows the average memory utilization for each server until the limiting stage.
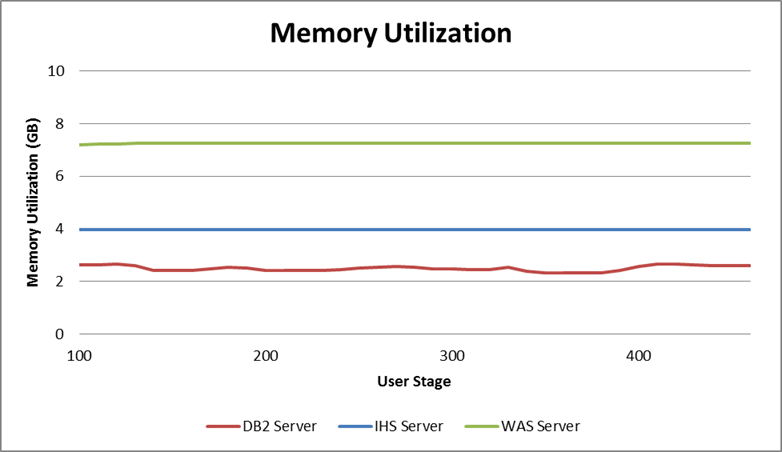 The next graph shows the garbage collector behavior during the test. Detailed garbage collector configuration can be found in Appendix A.
 Additional information regarding disk and network for each server during the test can be found on the following graphs.

Feeds Dashboard Performance Result
Workload characterization
Test Cases| Use role | % of Total | Related Actions |
|---|---|---|
View Feeds dashboard |
100 |
Open the Feeds Dashboard |
Average page response time
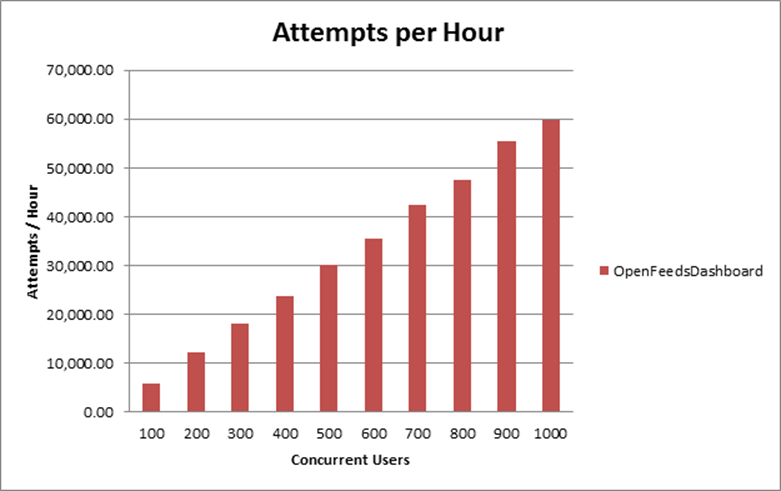
This load test reproduced an environment under full load reaching 1000 concurrent users. The following graph shows the average page response time (in milliseconds) ranging from 100 to 1000 concurrent users in 100 user increment intervals. The server never reached its limit during the test. The combined work order graphs shows the average response time calculated based on all the steps in this execution. This test requested an average of 56.02 elements/second and 16.6 pages/second at the 1000 user stage. The average response time for all pages reached 490 milliseconds.
Performance result breakdown
The following graph shows the average step response time for each user stage in milliseconds. Each step is part of a test case listed on the table Test Cases. In this case, a lower number is better. The average number of operations per hour during each user stage for each user case.
 Total number of iterations user is performing during the test for each user case.

Detailed resource utilization
The Database Server reached 73.3% maximum CPU utilization, with an average of 69.5% utilization at the 1000 concurrent users stage. The Application Server had an average of 70% CPU utilization, and the HTTP Server 3.25% average CPU utilization. The following graph shows the average memory utilization for each server until the limiting stage.
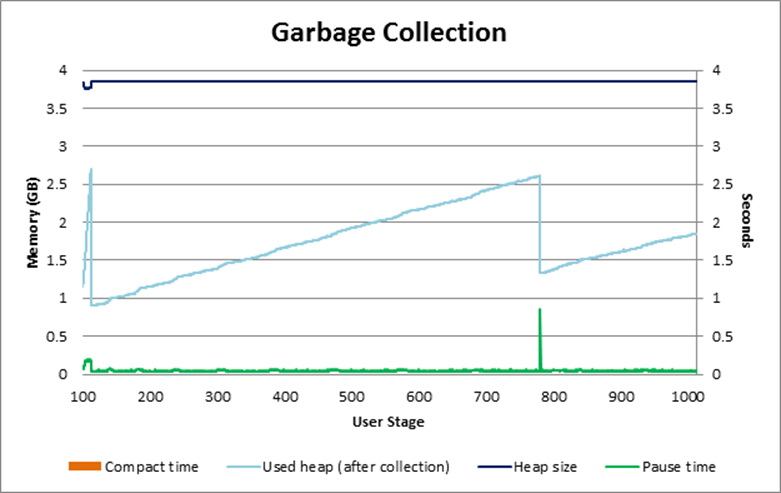
 The next graph shows the garbage collector behavior during the test. Detailed garbage collector configuration can be found in Appendix A.
 Additional information regarding disk and network for each server during the test can be found on the following graphs.
Appendix A - Key configuration parameters
| Product | Version | Highlights for configurations under test |
|---|---|---|
IBM HTTP Server for WebSphere Application Server |
8.5.5.1 |
IBM HTTP Server functions as a reverse proxy server implemented via Web server plug-in for WebSphere Application Server. Configuration details can be found from the CLM infocenter. HTTP server (httpd.conf):
OS Configuration:
|
IBM WebSphere Application Server Network Deployment |
8.5.5.1 |
JVM settings:
-Xgcpolicy:gencon -Xmx4g -Xms4g -Xmn1500m -Xcompressedrefs -Xgc:preferredHeapBase=0x100000000 -Xverbosegclog:gcJVM.log -XX:MaxDirectMemorySize=1g Thread pools:
LTPA Authentication:
OS Configuration: System wide resources for the app server process owner:
|
DB2 |
ESE 10.5.3 |
DB2 Connection pool size (set on JTS):
DBM CFG:
|
LDAP server |
N/A |
|
License server |
N/A |
|
RPT workbench |
8.3.0.3 |
Defaults |
RPT agents |
8.3.0.3 |
Defaults |
Network |
Shared subnet within test lab |
About the authors:
- Alfredo Bittencourt is a performance specialist for CLM, Maximo, and TRIRIGA product families.
- Vaughn Rokosz is the performance lead for the CLM product family.
Related topics: Collaborative Lifecycle Management performance report: Rational Quality Manager 5.0 release, Performance datasheets
Questions and comments:
- What other performance information would you like to see here?
- Do you have performance scenarios to share?
- Do you have scenarios that are not addressed in documentation?
- Where are you having problems in performance?
Contributions are governed by our Terms of Use. Please read the following disclaimer.
Dashboards and work items are no longer publicly available, so some links may be invalid. We now provide similar information through other means. Learn more here.