Introduction
This report focuses on
Rational Quality Manager (RQM) version 6.0.6.1 performance using a large repository that contains 15 million test artifacts in total. This is a new benchmark in terms of scenario coverage, repository size, and database indexes.
Compared to previous standard performance regression reports for 1,000 concurrent users operating against an RQM server not enabled for configuration management and using a 10 million artifact repository:
- The scenario coverage for this report included additional use cases for editing of test suites, browsing of test suite results, and browsing of test case results. Full text search use case was excluded.
- The repository size was increased to 15 million artifacts.
- Additional database indexes were explored based on the test load to further improve performance.
Disclaimer
The information in this document is distributed AS IS. The use of this information or the implementation of any of these techniques is a customer responsibility and depends on the customers ability to evaluate and integrate them into the customers operational environment. While each item may have been reviewed by IBM for accuracy in a specific situation, there is no guarantee that the same or similar results will be obtained elsewhere. Customers attempting to adapt these techniques to their own environments do so at their own risk. Any pointers in this publication to external Web sites are provided for convenience only and do not in any manner serve as an endorsement of these Web sites. Any performance data contained in this document was determined in a controlled environment, and therefore, the results that may be obtained in other operating environments may vary significantly. Users of this document should verify the applicable data for their specific environment.
Performance is based on measurements and projections using standard IBM benchmarks in a controlled environment. The actual throughput or performance that any user will experience will vary depending upon many factors, including considerations such as the amount of multi-programming in the users job stream, the I/O configuration, the storage configuration, and the workload processed. Therefore, no assurance can be given that an individual user will achieve results similar to those stated here.
This testing was done as a way to compare and characterize the differences in performance between different versions of the product. The results shown here should thus be looked at as a comparison of the contrasting performance between different versions, and not as an absolute benchmark of performance.
Summary of performance results
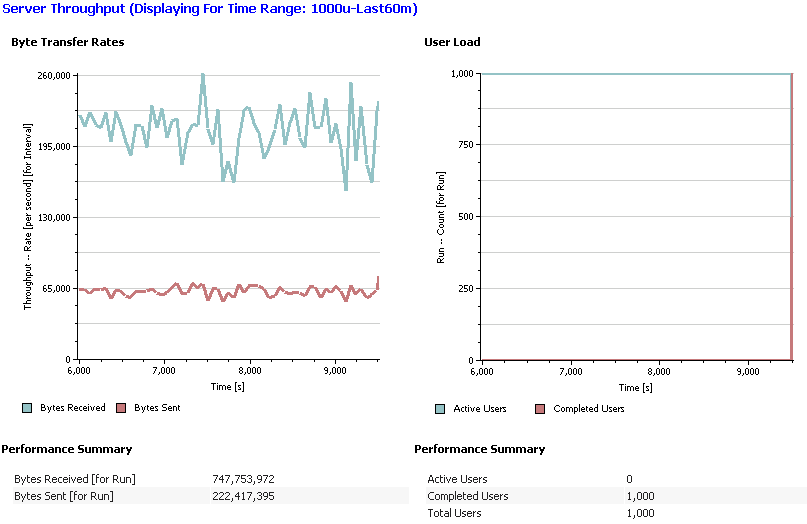
Throughput
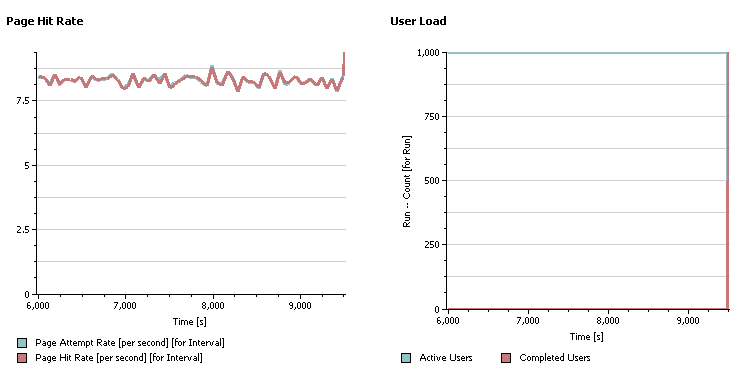
The page throughput generated by the 1,000 concurrent users load is 8.2 pages per second.
Summary of page response times
As indicated in the following histogram, more than 93% of all pages experienced median response times of less than 2 seconds.
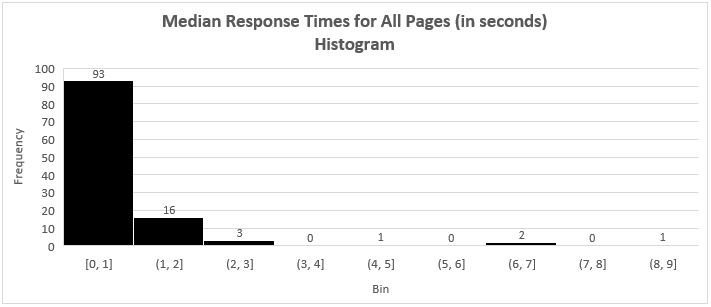
The details are provided in section
Median page response time breakdown.
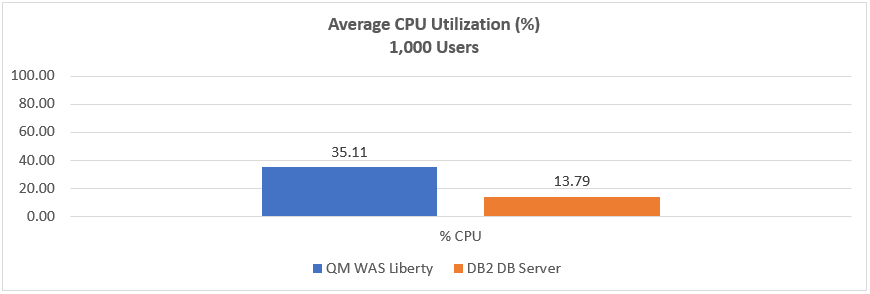
Summary of OS resource utilization
- CPU utilization averaged about 35% on the RQM application server and 14% on the database server.
- The reverse proxy server, Jazz Team Server, and Jazz Authorization Server utilized relatively low CPU resources averaging 3% or less.
- Disk utilization averaged about 51% on the database server and less than 2% on the RQM application server.
- Memory consumption averaged about 40GB on the database server. Heap usage on the RQM application server remained stable within the allocated amounts.
The details are provided in section
Resource utilization.
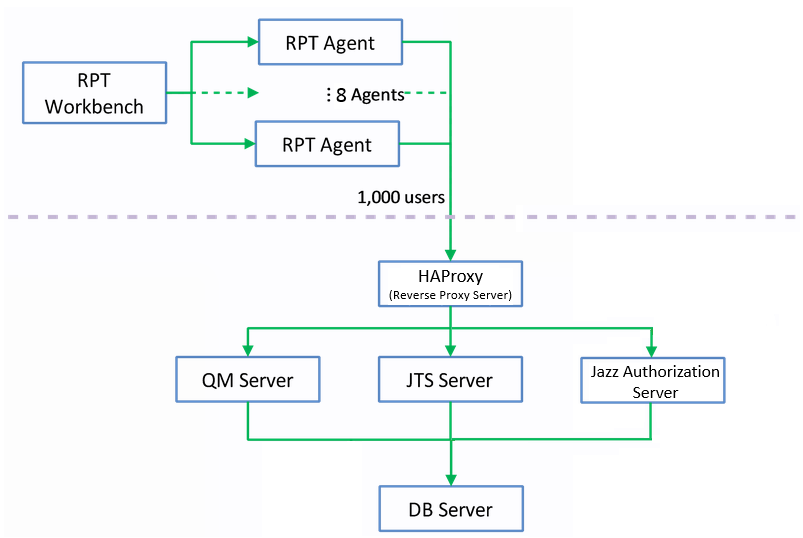
Appendix A: Topology
The topology under test is based on
Standard Topology (E1) Enterprise - Distributed / Linux / DB2.
The specifications of machines under test are listed in the table below. Server tuning details listed in
Appendix D: Key configuration parameters
| Function |
Number of Machines |
Machine Type |
CPU / Machine |
Total # of CPU vCores/Machine |
Memory/Machine |
Disk |
Disk capacity |
Network interface |
OS and Version |
| Reverse Proxy Server (HA Proxy) |
1 |
VMware Virtual Machine |
2 x Intel Xeon E5-2665 2.4GHz (dual-core) |
4 |
8GB |
N/A |
80GB |
Gigabit Ethernet |
Red Hat Enterprise Linux Server release 7.2 |
| JAS Server |
1 |
VMware Virtual Machine |
2 x Intel Xeon E5-2665 2.4GHz (dual-core) |
4 |
16GB |
N/A |
130GB |
Gigabit Ethernet |
Red Hat Enterprise Linux Server release 7.1 |
| JTS Server |
1 |
VMware Virtual Machine |
2 x Intel Xeon E5-2665 2.4GHz (dual-core) |
4 |
16GB |
N/A |
130GB |
Gigabit Ethernet |
Red Hat Enterprise Linux Server release 7.1 |
| QM Server |
1 |
VMware Virtual Machine |
2 x Intel Xeon E5-2665 2.4GHz (dual-core) |
4 |
16GB |
N/A |
130GB |
Gigabit Ethernet |
Red Hat Enterprise Linux Server release 7.1 |
| Database Server |
1 |
Lenovo Think System SR650 |
2 x Intel Xeon Silver 4114 CPU @ 2.20GHz (ten-core) |
40 |
64GB |
RAID 10 -- 900GB SAS Disk x 16 |
5.4TB |
Gigabit Ethernet |
Red Hat Enterprise Linux Server release 7.6 |
| RPT workbench |
1 |
VMware Virtual Machine |
2 x Intel Xeon E5-2698 2.3GHz |
4 |
8GB |
N/A |
200GB |
Gigabit Ethernet |
Windows Server 2008 R2 Enterprise |
| RPT Agents |
8 |
VMware Virtual Machine |
2 x Intel Xeon E5-2698 2.3GHz (dual-core) |
4 |
8GB |
N/A |
80GB |
Gigabit Ethernet |
Red Hat Enterprise Linux Server release 6.9 |
| Network switches |
N/A |
Cisco 2960G-24TC-L |
N/A |
N/A |
N/A |
N/A |
N/A |
Gigabit Ethernet |
24 Ethernet 10/100/1000 ports |
N/A: Not applicable.
vCores = Cores with hyperthreading
Network connectivity
All server machines and test clients are located on the same subnet. The LAN has 1000 Mbps of maximum bandwidth and less than 0.3 ms latency in ping.
Data volume and shape
The artifacts were migrated from 6.0.6GA repository which contains a total of 15M artifacts in
one large project.
The repository contained the following data:
- 2,339 test plans
- 1,403,200 test scripts
- 1,403,200 test cases
- 5,612,800 test case execution records
- 5,612,800 test case results
- 140,320 test suites
- 5,000 work items(defects)
- 9,338 test environments
- 28,064 test phases
- 280 build definitions
- 66,458 execution sequences
- 140,320 test suite execution records
- 701,600 test suite execution results
- 46,661 build records
- QM Database size = 669 GB
The artifact maintains the following associations:
- each test plan is linked to 600 unique test cases, and 600 unique test scripts
- each test suite contains 500 test cases
In this test environment, the
Configuration Management is not enabled.
Appendix B: Methodology
The test methodology involved collecting the standard one-hour performance test data using 1,000 concurrent users, repeating the test, and comparing the results.
Rational Performance Tester (RPT) was used to simulate the workload created using the web client. Each user completed a random use case from a set of
available use cases. A Rational Performance Tester script is created for each use case. The scripts are organized by pages and each page represents a user action.
The work load is role based as each of the areas defined under sequence of actions are separated into individual user groups within an RPT schedule.
The
User roles, test cases and workload characterization section describes the configuration of the RPT schedule.
User roles, test cases and workload characterization
User Roles
| Use role |
% of Total |
Related Actions |
| QE Manager |
8 |
Create test plan, Browse test plans and test cases, Browse test script, Simple test plan copy, Search defect, View dashboard |
| Test Lead |
19 |
Edit test environment, Edit test plan, Create test case, Bulk edit of test cases, Browse test script, Test Execution, Search defect, Edit test suite |
| Tester |
68 |
Create defect, Modify defect, Search defect, Edit test case, Create test script, Edit test script, Test Execution, Browse test execution record, Browse test case result, Browse test suite result |
| Dashboard Viewer |
5 |
View dashboard(with login and logout) |
Test Cases
| Use Role |
Percentage of the user role |
Sequence of Operations |
| QE Manager |
1 |
Create test plan:user creates test plan, then adds description, business objectives, test objectives, 2 test schedules, test estimate quality objectives and entry and exit criteria. |
| 26 |
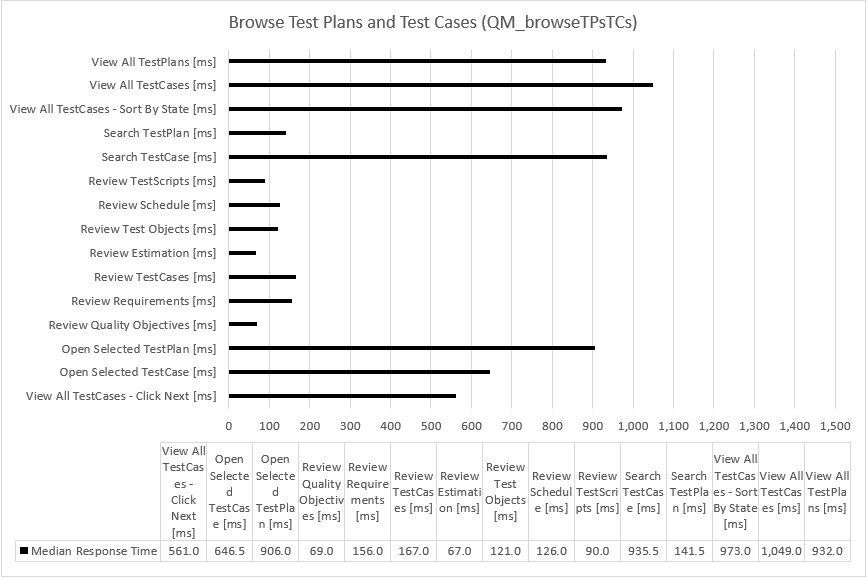
Browse test plans and test cases: user browses assets by: View Test Plans, then configure View Builder for name search; open test plan found, review various sections, then close. Search for test case by name, opens test case found, review various sections, then close. |
| 26 |
Browse test script: user search for test script by name, open it, reviews it, then closes. |
| 1 |
Simple test plan copy: user search test plan by name, then select one, then make a copy. |
| 23 |
Search defect: user searches for specific defect by number, user reviews the defect (pause), then closes. |
| 20 |
View Dashboard: user views dashboard |
| Test Lead |
8 |
Edit Test Environment: user lists all test environments, and then selects one of the environments and modifies it. |
| 15 |
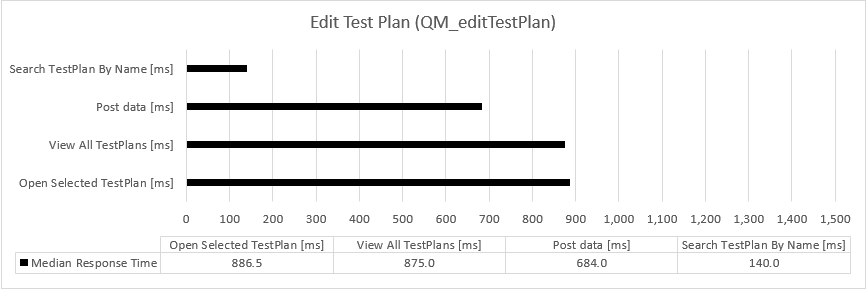
Edit test plan: list all test plans; from query result, open a test plan for editing, add a test case to the test plan, a few other sections of the test plan are edited and then the test plan is saved. |
| 4 |
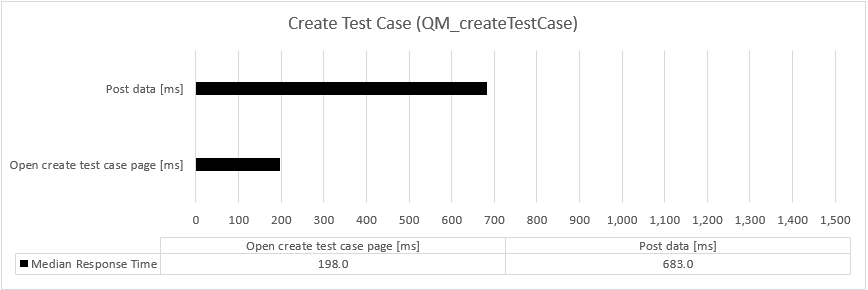
Create test case: user create test case by: opening the Create Test Case page, enters data for a new test case, and then saves the test case. |
| 1 |
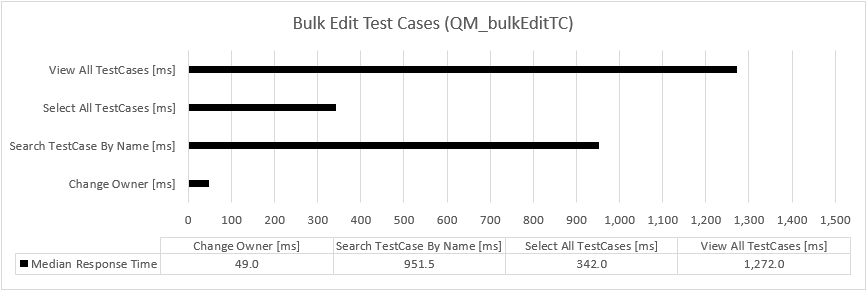
Bulk edit of test cases: user searches for test cases with root name and edits all found with owner change. |
| 32 |
Browse test script: user search for test script by name, open it, reviews it, then closes. |
| 26 |
Test Execution: selects View Test Execution Records, by name, starts execution, enters pass/fail verdict, reviews results, sets points then saves. |
| 11 |
Search defect: user searches for specific defect by number, user reviews the defect (pause), then closes. |
| 2 |
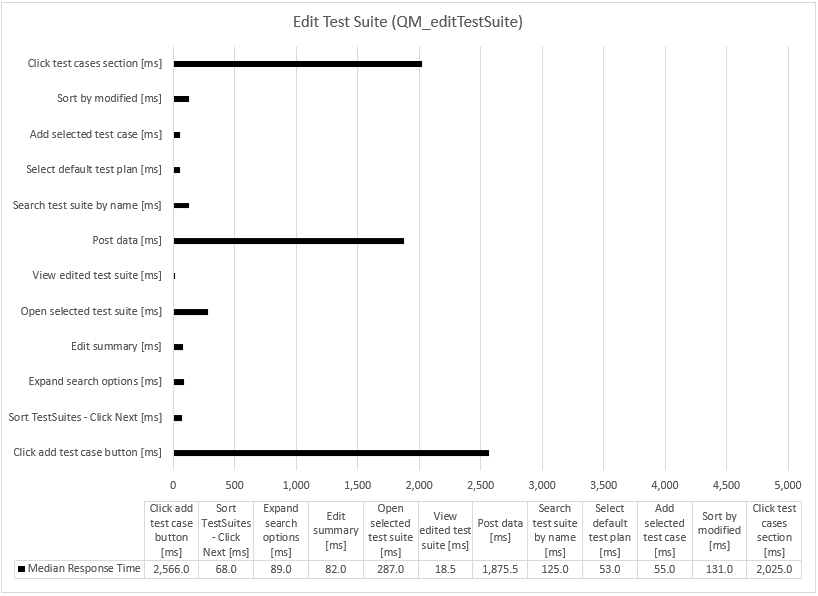
Edit test suite: user expands search options, searches by name, sorts by modified, advances to next page, selects a random test suite and opens it, edits the summary, clicks test cases section, clicks button to add test case, selects a random test case from default test plan, and saves. |
| Tester |
8 |
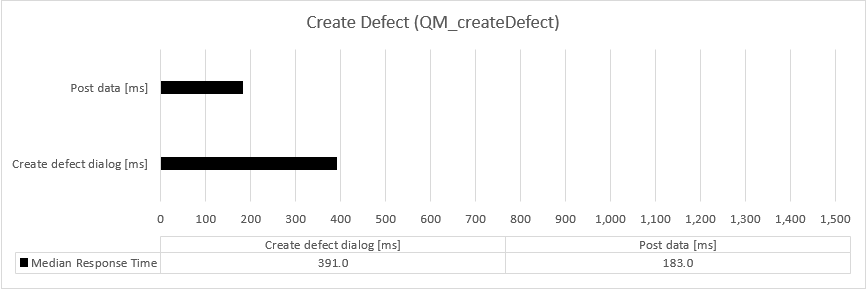
Create defect: user creates defect by: opening the Create Defect page, enters data for a new defect, and then saves the defect. |
| 5 |
Modify defect: user searches for specific defect by number, modifies it then saves it. |
| 14 |
Search defect: user searches for specific defect by number, user reviews the defect (pause), then closes. |
| 6 |
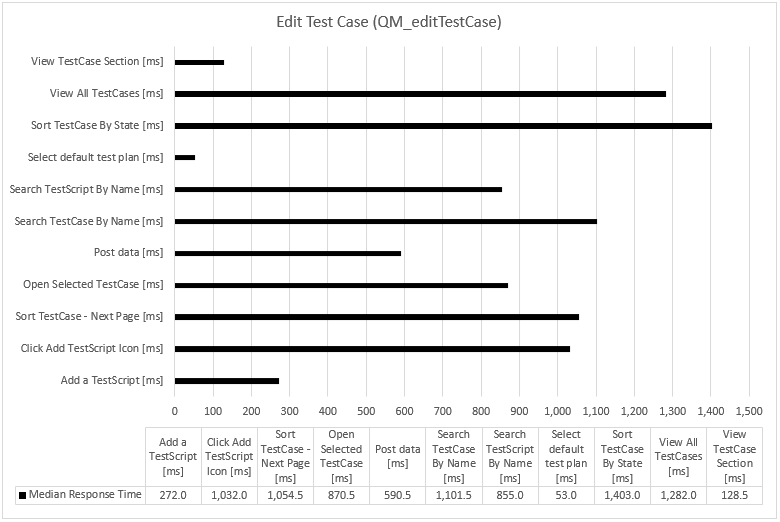
Edit test case: user searches Test Case by name, the test case is then opened in the editor, then a test script is added to the test case (user clicks next a few times (server size paging feature) before selecting test script), The test case is then saved. |
| 4 |
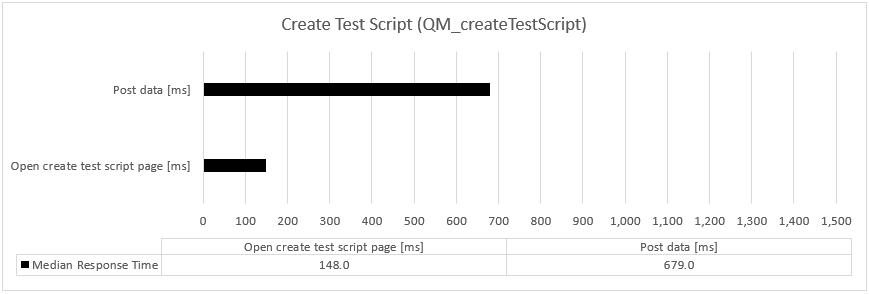
Create test script: user creates test case by: selecting Create Test Script page, enters data for a new test script, and then saves the test script. |
| 8 |
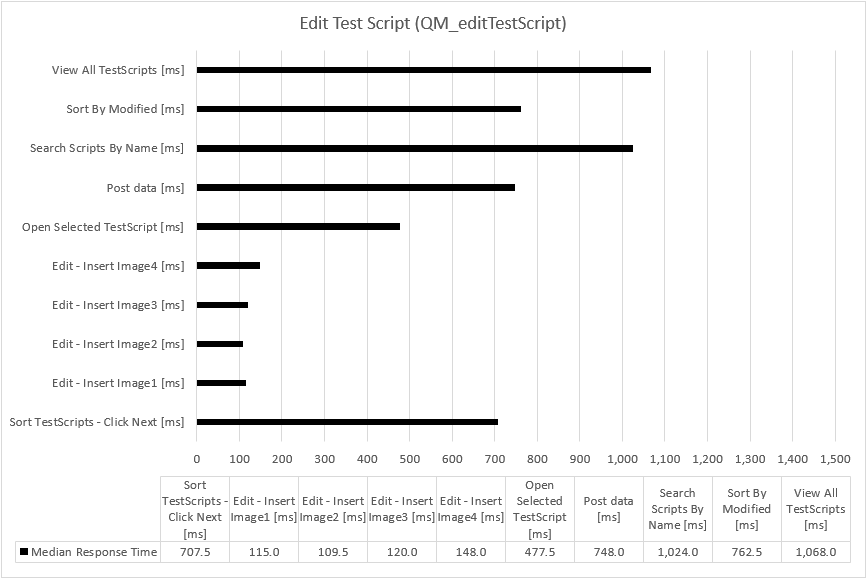
Edit test script: user selects Test Script by name. test script then opened for editing, modified and then saved. |
| 42 |
Test Execution: selects View Test Execution Records, by name, starts execution, enters pass/fail verdict, reviews results, sets points then saves. |
| 7 |
Browse test case execution record: user browses TERs by: name, then selects the TER and opens the most recent results. |
| 2 |
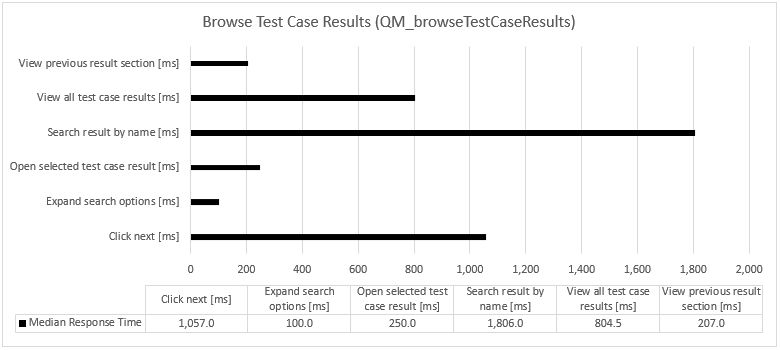
Browse test case results: user views all test case results, expands search options, searches by name, advances to next page, selects and opens randomly selected result, then click section to view previous results. |
| 2 |
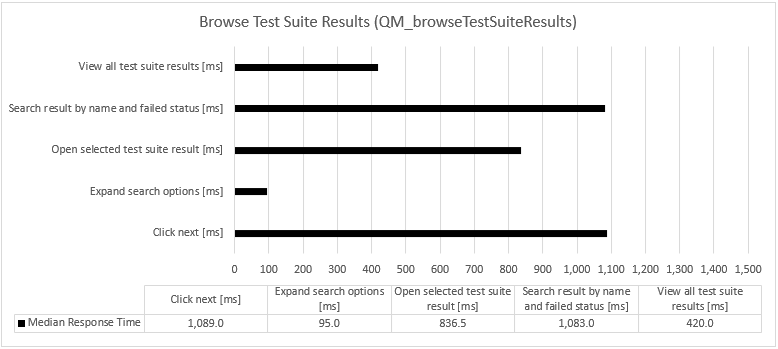
Browse test suite results: user views all test suite results, expands search options, searches by name and failed status, advances to next page, selects and opens randomly selected result. |
| Dashboard Viewer |
100 |
View dashboard(with login and logout): user logs in, views dashboard, then logs out. This user provides some login/logout behavior to the workload |
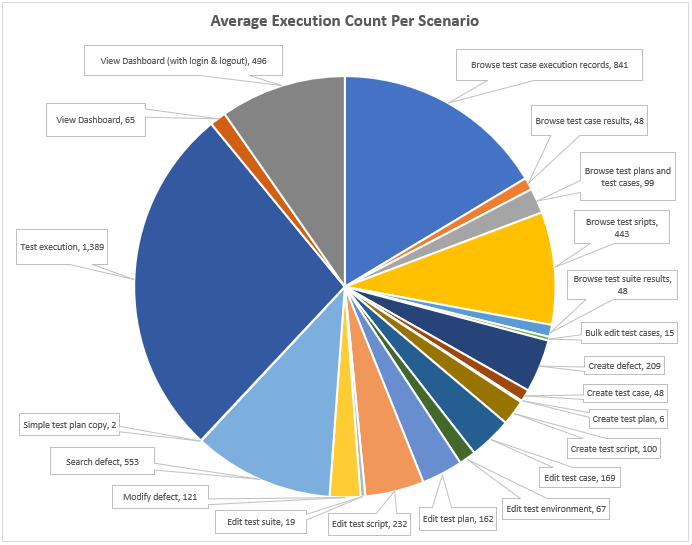
Execution Count
The average number of executions per scenario by 1,000 concurrent users generating the workload described above is shown below:
Response times
The median response time is used to describe the page performance as it is not affected by some of the variation encountered during the test runs.
Appendix C: Detailed performance results
Median page response time breakdown
In the response time charts that follow, the unit is in milliseconds. When interpreting the data, smaller is better.
Browse Test Case Execution Records
 Back to Test Cases & workload characterization
Browse Test Case Results
 Back to Test Cases & workload characterization
Browse Test Plans & Test Cases
 Back to Test Cases & workload characterization
Browse Test Scripts
 Back to Test Cases & workload characterization
Browse Test Suite Results
 Back to Test Cases & workload characterization
Bulk Edit of Test Cases
 Back to Test Cases & workload characterization
Create Defect
 Back to Test Cases & workload characterization
Create Test Case
 Back to Test Cases & workload characterization
Create Test Plan
 Back to Test Cases & workload characterization
Create Test Script
 Back to Test Cases & workload characterization
Edit Test Case
 Back to Test Cases & workload characterization
Edit Test Environment
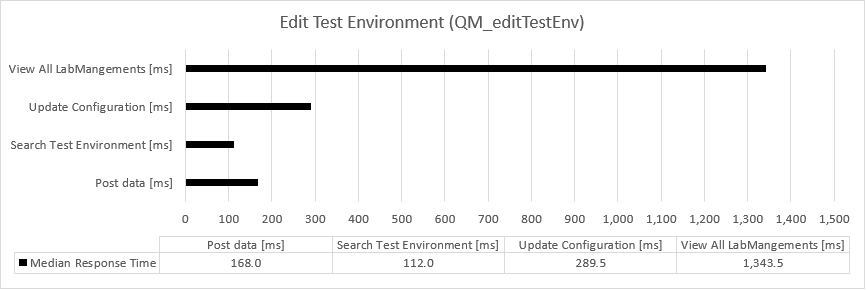 Back to Test Cases & workload characterization
Edit Test Plan
 Back to Test Cases & workload characterization
Edit Test Script
 Back to Test Cases & workload characterization
Edit Test Suite
 Back to Test Cases & workload characterization
Modify Defect
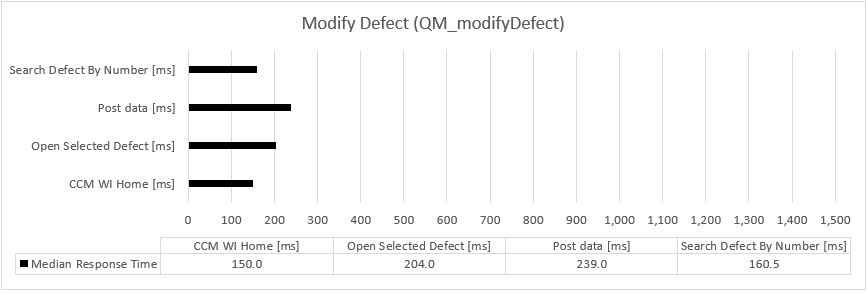 Back to Test Cases & workload characterization
Search Defect
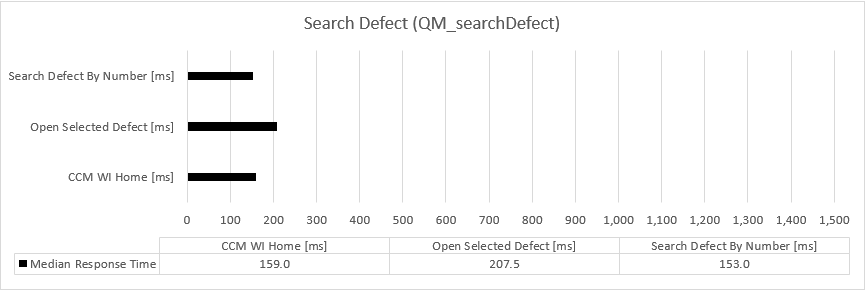 Back to Test Cases & workload characterization
Simple Test Plan Copy
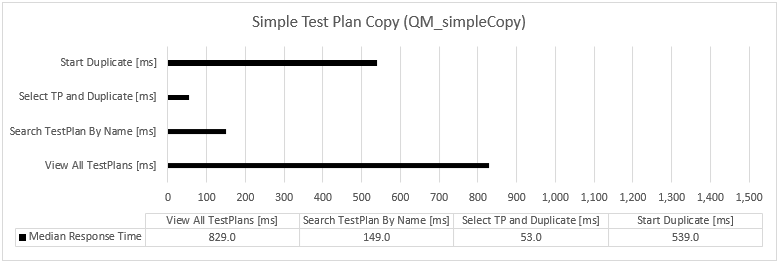 Back to Test Cases & workload characterization
Test Execution For 4 Steps
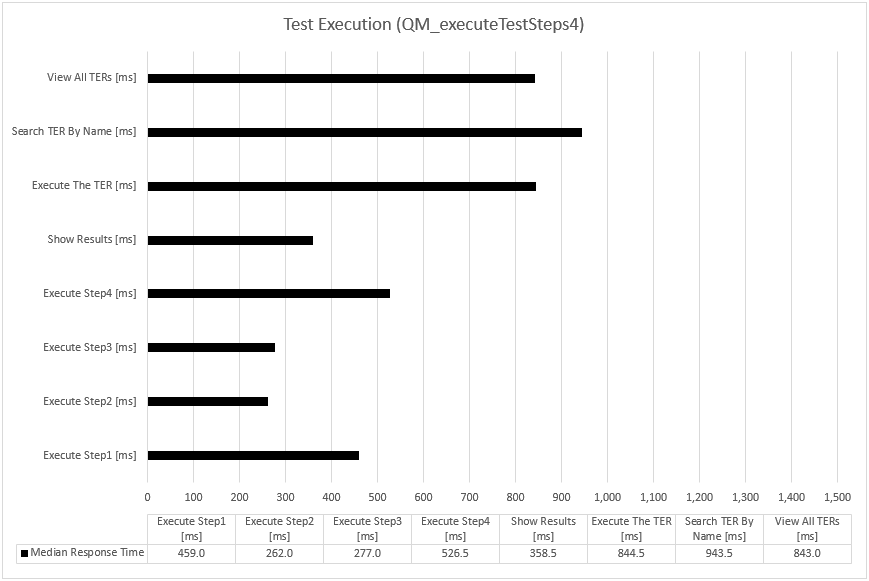 Back to Test Cases & workload characterization
View Dashboard
 Back to Test Cases & workload characterization
View Dashboard with Login
 Back to Test Cases & workload characterization
RPT network transfer
Resource utilization
OS Resource Utilization - Overview
| CPU |
 |
| Disk |
 |
| Memory |
 |
| Network |
 |
Garbage collection - JVM GC Charts
For JVM parameters, please refer to
Appendix D: Key configuration parameters.
Verbose garbage collection (GC) is enabled by default to log the GC activities. Below is one example of the output from the GC log for each application.
WAS Liberty JVM Garbage Collection Charts for RQM and JTS Servers
| QM |
 |
| JTS |
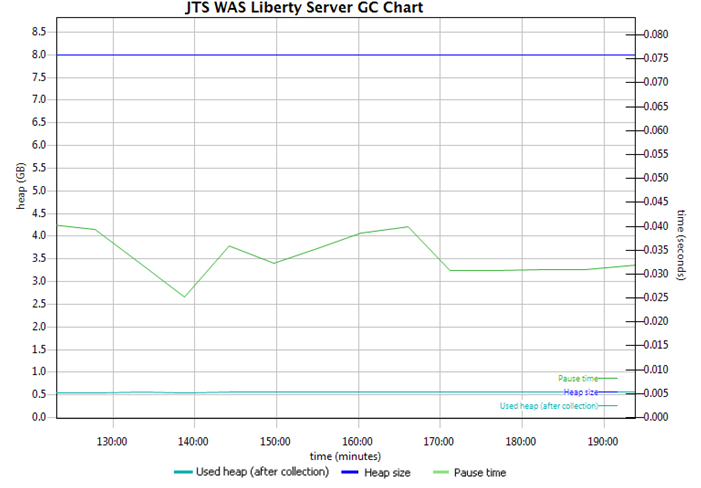 |
Appendix D: Key configuration parameters
Product
|
Version |
Highlights for configurations under test |
| HAProxy |
1.5.18 |
HAProxy functions as a reverse proxy server.
Configuration details can be found from the HAProxy Configuration Manual.
haproxy.cfg:
- timeout http-request 20s
- timeout connect 20s
- timeout client 5m
- timeout server 5m
OS Configuration:
- max user processes = 65536
|
| IBM WebSphere Application Server Liberty | 18.0.0.3 | JVM settings:
- Memory settings specified in server.startup before line export JAVA_OPTS:
JAVA_OPTS="$JAVA_OPTS -Xmx8g"
JAVA_OPTS="$JAVA_OPTS -Xms8g"
JAVA_OPTS="$JAVA_OPTS -Xmn2g"
JAVA_OPTS="$JAVA_OPTS -XX:MaxDirectMemorySize=2G"
SDK version:
- IBM WebSphere SDK for Java Technology Edition Version 8.0.5.25
OS Configuration:
System wide resources for the app server process owner:
- max user processes = 65536
- open files = 65536
|
| DB2 |
ESE 10.5.0.9 |
See Appendix E: Database Server Tuning |
| LDAP server |
N/A |
N/A |
| License server |
N/A |
N/A |
| RPT workbench |
9.0.0.2 |
Defaults |
| RPT agents |
9.0.0.2 |
Defaults |
| Network |
|
Shared subnet within test lab |
Appendix E: Database server tuning
Indexes
When we looked at some browse and search related queries from within the database, we determined to use additional indexes to help improve both of their response times as well as the memory usage.
The indexes were created on the RQM DB using IBM DB2 v10.5 as below:
########## to improve default browse XXX pages ##########
db2 'CREATE INDEX "EXECUTION"."TER_JZ_ARC_MOD_PRJ_ITM_ST" ON "EXECUTION"."EXECUTION_RECORD" ( "JZ_DISCRIMINATOR" ASC, "ARCHIVED" ASC, "MODIFIED" DESC, "PROJECT_AREA_ITEM_ID" ASC, "ITEM_ID" ASC, "STATE_ID" ASC )'
db2 'CREATE INDEX "EXECUTION"."TCER_JZ_PRJ_ARC_ENT_ITM_ST" ON "EXECUTION"."EXECUTION_TASK_RESULT" ( "JZ_DISCRIMINATOR" ASC, "PROJECT_AREA_ITEM_ID" ASC, "ARCHIVED" ASC, "END_TIME" ASC, "ITEM_ID" ASC, "STATE_ID" ASC )'
db2 'CREATE INDEX "EXECUTION"."TSER_JZ_ARC_ENT_PRJ_ITM_ST" ON "EXECUTION"."EXECUTION_TASK_RESULT" ( "JZ_DISCRIMINATOR" ASC, "ARCHIVED" ASC, "END_TIME" DESC, "PROJECT_AREA_ITEM_ID" ASC, "ITEM_ID" ASC, "STATE_ID" ASC )'
########## the following are function based indices for name search filters for large scale, only to add them to IBM DB2 v10.5 and above #################
########## to improve searching via applying keywords in the Name filter ##########
db2 'CREATE INDEX EXECUTION.NAMECOL_UPPER_TER on EXECUTION.EXECUTION_RECORD(UPPER(NAME_COL))'
The sample script to add these indexes can be found in the Attachments section at the bottom of this report.
Runstats
If data has been migrated from a previous release, ensure more optimal performance by updating the statistics of the database.
Typically, we run the following:
db2 REORGCHK UPDATE STATISTICS ON TABLE ALL
For the series of tests covered for this report, we also ran:
db2 'RUNSTATS ON TABLE "PLANNING"."TEST_CASE" ON COLUMNS ( "NAME_COL" )  AND SAMPLED DETAILED INDEXES ALL  ALLOW WRITE ACCESS  TABLESAMPLE BERNOULLI ( 40.0 ) REPEATABLE ( 50 ) UTIL_IMPACT_PRIORITY 50'
db2 'RUNSTATS ON TABLE "PLANNING"."EXECUTION_SCRIPT" ON COLUMNS ( "NAME_COL" )  AND SAMPLED DETAILED INDEXES ALL  ALLOW WRITE ACCESS  TABLESAMPLE BERNOULLI ( 40.0 ) REPEATABLE ( 50 ) UTIL_IMPACT_PRIORITY 50'
db2 'RUNSTATS ON TABLE EXECUTION.EXECUTION_RECORD ON COLUMNS ( "NAME_COL" )  AND SAMPLED DETAILED INDEXES ALL  ALLOW WRITE ACCESS  TABLESAMPLE BERNOULLI ( 40.0 ) REPEATABLE ( 50 ) UTIL_IMPACT_PRIORITY 50'
db2 'RUNSTATS ON TABLE EXECUTION.EXECUTION_TASK_RESULT ON COLUMNS ( "NAME_COL" )  AND SAMPLED DETAILED INDEXES ALL  ALLOW WRITE ACCESS  TABLESAMPLE BERNOULLI ( 40.0 ) REPEATABLE ( 50 ) UTIL_IMPACT_PRIORITY 50'
db2 'RUNSTATS ON TABLE PLANNING.TEST_SUITE ON COLUMNS ( "NAME_COL" )  AND SAMPLED DETAILED INDEXES ALL  ALLOW WRITE ACCESS  TABLESAMPLE BERNOULLI ( 40.0 ) REPEATABLE ( 50 ) UTIL_IMPACT_PRIORITY 50'
db2 'RUNSTATS ON TABLE PLANNING.TEST_PLAN ON COLUMNS ( "NAME_COL" )  AND SAMPLED DETAILED INDEXES ALL  ALLOW WRITE ACCESS  TABLESAMPLE BERNOULLI ( 40.0 ) REPEATABLE ( 50 ) UTIL_IMPACT_PRIORITY 50'
db2 'RUNSTATS ON TABLE "REPOSITORY"."VERSION" WITH DISTRIBUTION AND DETAILED INDEXES ALL'
For more runstats commands, please refer to the
upgrade guide for details.
About the author(s):
SentellaCystrunk is a performance engineer focusing on the performance and scalability of products in the Collaborative Lifecycle Management family.
Questions and comments:
- What other performance information would you like to see here?
- Do you have performance scenarios to share?
- Do you have scenarios that are not addressed in documentation?
- Where are you having problems in performance?
Warning: Can't find topic Deployment.PerformanceDatasheetReaderComments

