r18 - 2015-05-20 - 12:47:25 - Main.gsvenYou are here: TWiki >  Deployment Web > DeploymentPlanningAndDesign > PerformanceDatasheetsAndSizingGuidelines > CollaborativeLifecycleManagementPerformanceReportRDNG60Release
 Collaborative Lifecycle Management performance report: RDNG 6.0
Authors: GustafSvensson, VaughnRokosz Date: May 22, 2015 Build basis: Rational Doors Next Generation 6.0
Page contents
- Introduction
- Test details
- Methodology
- Results
- Observation
-
- Create a collection
- Search an artifact using ID and a string
- Create, move and delete folders
- Create a comment for a module artifact
- Open the project dashboard
- Create a requirement in a medium sized module
- Create a requirement in a large module
- Copy and paste 24 artifacts
- Create an artifact
- Display hover information for an artifact in a collection
- Display hover information for a module artifact. Open and edit artifact
- Page down in a large module
- Change display in a module
- Display module history
- Uploading 4 MB file in new artifact
-
- Appendix A
Introduction
This report compares the performance of IBM Rational DOORS Next Generation version 6.0 to the previous 5.0.2 release. The goal of the test was to verify that the performance of 6.0 operations were the same or better than their 5.0.2 equivalents. The test methodology involves these steps:- Run a standard 250 user workload against version 5.0.2 for 1.5 hours (repeat 3 times)
- Run a standard 250 user workload against version 6.0 for 1.5 hours (repeat 3 times)
- Compare the 6 runs.
Findings
The 6.0 release performs the same or better than the 5.0.2 release, when using the 6.0 release with the new configuration management features disabled.Disclaimer
The information in this document is distributed AS IS. The use of this information or the implementation of any of these techniques is a customer responsibility and depends on the customers ability to evaluate and integrate them into the customers operational environment. While each item may have been reviewed by IBM for accuracy in a specific situation, there is no guarantee that the same or similar results will be obtained elsewhere. Customers attempting to adapt these techniques to their own environments do so at their own risk. Any pointers in this publication to external Web sites are provided for convenience only and do not in any manner serve as an endorsement of these Web sites. Any performance data contained in this document was determined in a controlled environment, and therefore, the results that may be obtained in other operating environments may vary significantly. Users of this document should verify the applicable data for their specific environment. Performance is based on measurements and projections using standard IBM benchmarks in a controlled environment. The actual throughput or performance that any user will experience will vary depending upon many factors, including considerations such as the amount of multi-programming in the users job stream, the I/O configuration, the storage configuration, and the workload processed. Therefore, no assurance can be given that an individual user will achieve results similar to those stated here. This testing was done as a way to compare and characterize the differences in performance between different versions of the product. The results shown here should thus be looked at as a comparison of the contrasting performance between different versions, and not as an absolute benchmark of performance.Test details
Topology
The topology under test is based on Standard Topology (E1) Enterprise - Distributed / Linux / DB2.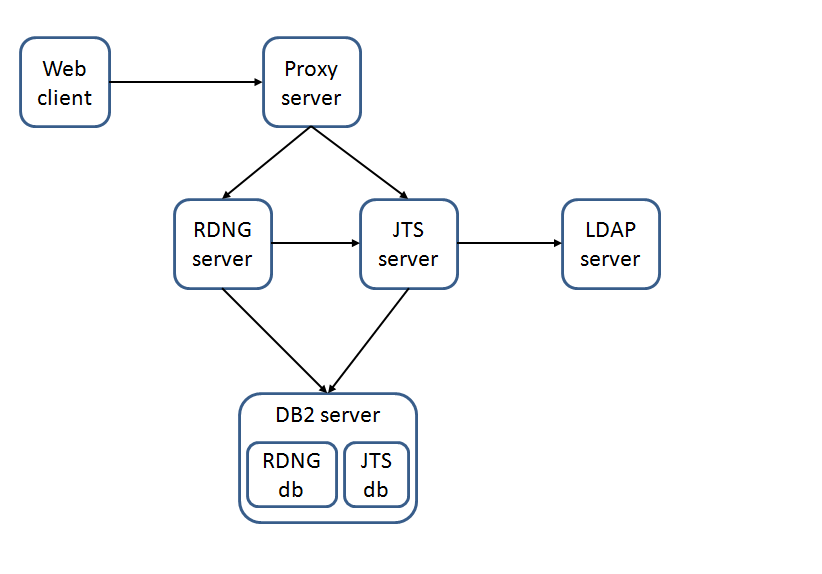 The specifications of machines under test are listed in the table below. Server tuning details listed in Appendix A
| Function | Number of Machines | Machine Type | CPU / Machine | Total # of CPU Cores/Machine | Memory/Machine | Disk | Disk capacity | Network interface | OS and Version |
|---|---|---|---|---|---|---|---|---|---|
| Proxy Server (IBM HTTP Server and WebSphere Plugin) | 1 | IBM System x3250 M4 | 1 x Intel Xeon E3-1240 3.4GHz (quad-core) | 8 | 16GB | RAID 1 -- SAS Disk x 2 | 279GB | Gigabit Ethernet | Red Hat Enterprise Linux Server release 6.3 (Santiago) |
| JTS Server | 1 | IBM System x3550 M4 | 2 x Intel Xeon E5-2640 2.5GHz (six-core) | 24 | 32GB | RAID 5 -- SAS Disk x 4 | 279GB | Gigabit Ethernet | Red Hat Enterprise Linux Server release 6.3 (Santiago) |
| RDNG Server | 1 | IBM System x3550 M4 | 2 x Intel Xeon E5-2640 2.5GHz (six-core) | 24 | 32GB | RAID 5 -- SAS Disk x 4 | 279GB | Gigabit Ethernet | Red Hat Enterprise Linux Server release 6.3 (Santiago) |
| Database Server | 1 | IBM System x3650 M4 | 2 x Intel Xeon E5-2640 2.5GHz (six-core) | 24 | 64GB | RAID 10 -- SAS Disk x 16 | 279GB | Gigabit Ethernet | Red Hat Enterprise Linux Server release 6.3 (Santiago) |
| RPT Workbench | 1 | VM image | 2 x Intel Xeon X7550 CPU (1-Core 2.0GHz 64-bit) | 2 | 6GB | SCSI | 80GB | Gigabit Ethernet | Microsoft Windows Server 2003 R2 Standard Edition SP2 |
| RPT Agent | 1 | xSeries 345 | 4 x Intel Xeon X3480 CPU (1-Core 3.20GHz 32-bit) | 4 | 3GB | SCSI | 70GB | Gigabit Ethernet | Microsoft Windows Server 2003 Enterprise Edition SP2 |
| RPT Agent | 1 | xSeries 345 | 4 x Intel Xeon X3480 CPU (1-Core 3.20GHz 32-bit) | 4 | 3GB | RAID 1 - SCSI Disk x 2 | 70GB | Gigabit Ethernet | Microsoft Windows Server 2003 Enterprise Edition SP2 |
| RPT Agent | 1 | Lenovo 9196A49 | 1 x Intel Xeon E6750 CPU (2-Core 2.66GHz 32-bit) | 2 | 2GB | SATA | 230GB | Gigabit Ethernet | Microsoft Windows Server 2003 Enterprise Edition SP2 |
| Network switches | N/A | Cisco 2960G-24TC-L | N/A | N/A | N/A | N/A | N/A | Gigabit Ethernet | 24 Ethernet 10/100/1000 ports |
Network connectivity
All server machines and test clients are located on the same subnet. The LAN has 1000 Mbps of maximum bandwidth and less than 0.3ms latency in ping.Data volume and shape
The artifacts were distributed between 6 projects for a total of 517,080 artifacts. The repository contained the following data:- 312 modules
- 510,000 module artifacts
- 7,800 requirement artifacts
- 715 folders
- 150 collections
- 0 reviews
- 1,563,492 comments
- 1800 public tags
- 0 private tags
- 1,428 terms
- 1,824,174 links
- 600 views
- JTS index size on disk = 1.2 MB
- RM index size on disk = 41 GB
- 52 modules
- 119 folders
- 1,180 requirement artifacts
- 85,000 module artifacts
- 14 collections
- 0 reviews
- 260,582 comments
- 300 public tags
- 0 private tags
- 238 terms
- 304,029 links
- 100 views
Methodology
Rational Performance Tester was used to simulate the workload created using the web client. Each user completed a random use case from a set of available use cases. A Rational Performance Tester script is created for each use case. The scripts are organized by pages and each page represents a user action. Based on real customer use, the test scenario provides a ratio of 70% reads and 30% writes. The users completed use cases at a rate of 60 pages per hour per user. Each performance test runs for 90 minutes after all of the users are activated in the system.Test cases and workload characterization
| Use case | Description | % of Total Workload |
|---|---|---|
| Login | Connect to the server using server credentials. | 0 |
| Create a collection | Create collections with 20 artifacts. | 2 |
| Query by ID and string | Within scope of a project search for a known artifact by using the ID and also by string (two separate searches) | 9 |
| Manage folders | Create a folder, move it to a new location, and then delete the folder. | 2 |
| Add comments to a module artifact | Open a module artifact and create a comment addressed to a person on the team. | 19 |
| Open the project dashboard | Open the project and dashboard for the first time. | 5 |
| Create a module artifact in a medium sized module | Open module with 500 requirements. Create a module artifact, edit three attributes and then delete the artifact from the module. | 6 |
| Create a module artifact in a large module | Open module with 1500 requirements. Create a module artifact, edit three attributes and then delete the artifact from the project. | 19 |
| Copy and paste module artifacts in a large module | Open module with 1500 requirements. Create 24 new requirements by copy and paste 24 existing requirements. | 1 |
| Create an artifact | Create a requirement that has 50 enumerations. Open the artifact and add three enumeration attributes | 3 |
| Display the hover information for a collection | Open Show Collections and hover over a collection. | 2 |
| Hover over module artifact | Open module. Display hover information for one of the artifacts. Edit and save the module | 2 |
| Open a module and page down | Open a module with 1500 artifacts. Page down 20 pages, one page at a time. | 19 |
| Change columns to display in a module | Open a module with 1500 artifacts. Add a column to the display. Filter the display by an attribute | 14 |
| Upload 4MB file in new artifact | Upload 4MB file. | 4 |
Test case execution during test
| Use case | % of Total Workload | Times executed in 5.0.2 | Times executed in 6.0 |
|---|---|---|---|
| Create a collection | 2 | 40 | 41 |
| Query by ID and string | 9 | 475 | 492 |
| Manage folders | 2 | 72 | 74 |
| Add comments to a module artifact | 19 | 815 | 843 |
| Open the project dashboard | 5 | 520 | 534 |
| Create a module artifact in a medium sized module | 6 | 132 | 133 |
| Create a module artifact in a large module | 19 | 255 | 270 |
| Copy and paste module artifacts in a large module | 1 | 40 | 38 |
| Create an artifact | 3 | 121 | 125 |
| Display the hover information for a collection | 2 | 108 | 111 |
| Hover over module artifact | 2 | 87 | 90 |
| Open a module and page down | 19 | 308 | 376 |
| Change columns to display in a module | 14 | 1002 | 1056 |
| Upload 4MB file in new artifact | 4 | 157 | 164 |
Response time comparison
The response time charts that follow use the median value (not the average). The median is more consistent than the average in these tests, which makes it easier to compare response times between releases. Response times are reported in milliseconds, where not otherwise specified. In the repository that contained 517,080 artifacts with 250 concurrent users, no obvious regression was shown when comparing response times between runs. A number of use cases have improved in 6.0.Results
The chart below is an amalgam of all measurements from all use cases. This indicates that performance is generally improved in 6.0.
Observation
- Memory and CPU utilization is similar in 6.0 as in 5.0.2, although there is slightly less CPU utilization on the RM server in 6.0.
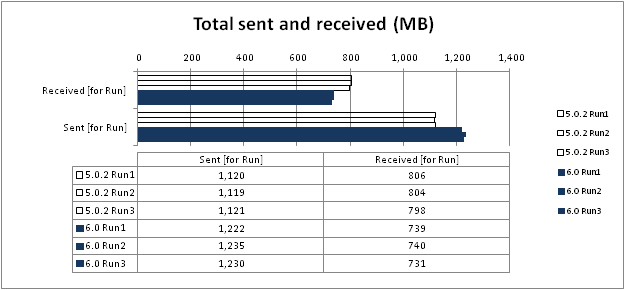
 Network traffic
 - The following chart shows the amount of data sent over the network
 Garbage collection
Verbose garbage collection is enabled to create the GC logs. The GC logs show very little variation between runs.
Below is an example of the output from the GC logs for each of the JTS and RDNG application servers, including versions 6.0 and 5.0.2.
RDNG
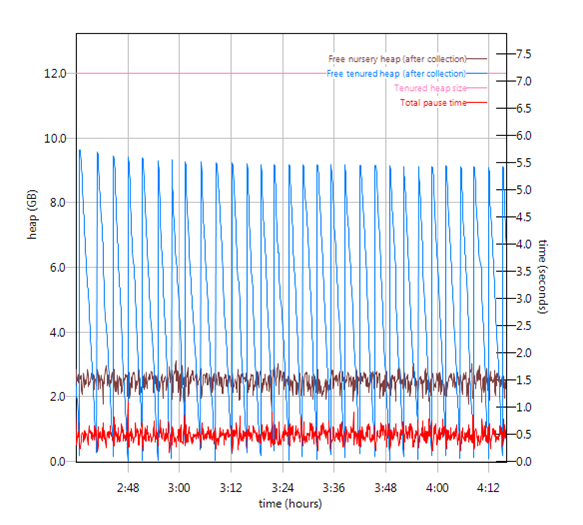
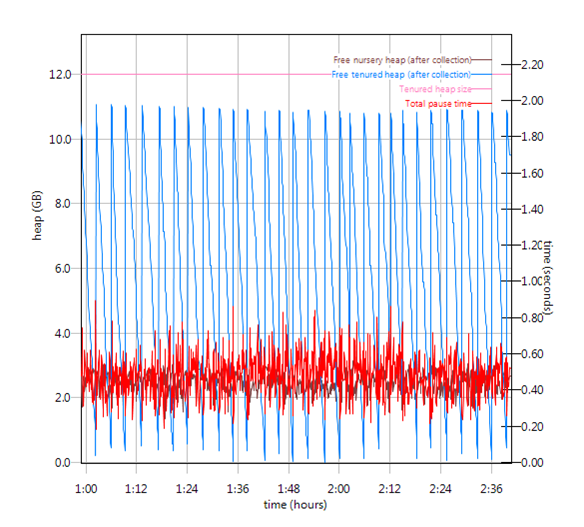
Garbage collection
Verbose garbage collection is enabled to create the GC logs. The GC logs show very little variation between runs.
Below is an example of the output from the GC logs for each of the JTS and RDNG application servers, including versions 6.0 and 5.0.2.
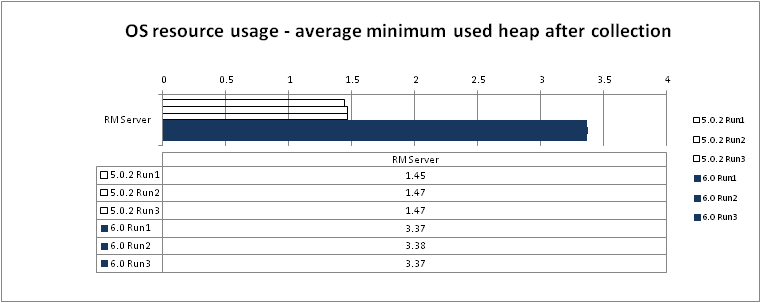
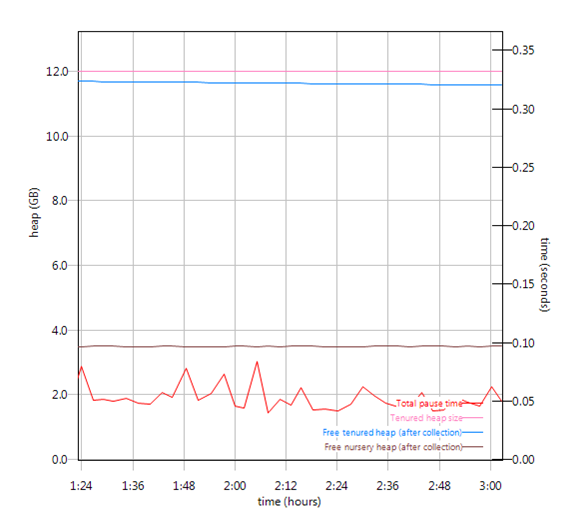
RDNG - Observation: 6.0 uses roughly 2G of additional Java heap space. Additional data is cached in memory as part of the 6.0 support for configuration management.
- RDNG 6.0
- RDNG 5.0.2
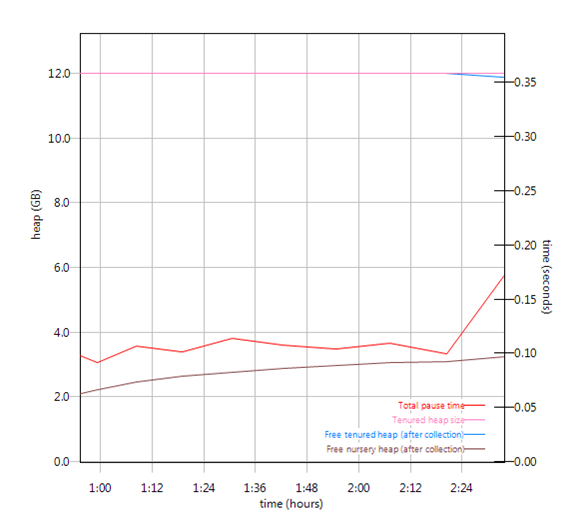
 JTS
JTS - Observation: The graphs show similar behavior in 6.0 as in 5.0.2. The activity is so small that there is not much to graph.
- JTS 6.0
- JTS 5.0.2
Create a collection
 Back to Test Cases & workload characterization
Search an artifact using ID and a string
 Back to Test Cases & workload characterization
Create, move and delete folders
 Back to Test Cases & workload characterization
Create a comment for a module artifact
 Back to Test Cases & workload characterization
Open the project dashboard
 Back to Test Cases & workload characterization
Create a requirement in a medium sized module
 Back to Test Cases & workload characterization
Create a requirement in a large module
 Back to Test Cases & workload characterization
Copy and paste 24 artifacts
 Back to Test Cases & workload characterization
Create an artifact
 Back to Test Cases & workload characterization
Display hover information for an artifact in a collection
 Back to Test Cases & workload characterization
Display hover information for a module artifact. Open and edit artifact
 Back to Test Cases & workload characterization
Page down in a large module
 Back to Test Cases & workload characterization
Change display in a module
 Back to Test Cases & workload characterization
Uploading 4 MB file in new artifact
The Save operation shows a small (200ms) regression in the runs below. This operation has varied substantially from run to run, and there have been some 5.0.2 runs with substantially larger response times. Our sense is that this is a "false regression", most likely caused by varying network conditions. Back to Test Cases & workload characterization
Appendix A
| Product |
Version | Highlights for configurations under test |
|---|---|---|
| IBM HTTP Server for WebSphere Application Server | 8.5.5.1 | IBM HTTP Server functions as a reverse proxy server implemented
via Web server plug-in for WebSphere Application Server. Configuration details can be found from the CLM infocenter.
HTTP server (httpd.conf):
|
| IBM WebSphere Application Server Network Deployment | 8.5.5.1 | JVM settings:
-XX:MaxDirectMemorySize=1g -Xgcpolicy:gencon -Xmx16g -Xms16g -Xmn4g -Xcompressedrefs -Xgc:preferredHeapBase=0x100000000 -Xverbosegclog:logs/gc.logThread pools:
|
| DB2 | DB2 10.1 | |
| LDAP server | ||
| License server | Hosted locally by JTS server | |
| RPT workbench | 8.3 | Defaults |
| RPT agents | 8.5.1 | Defaults |
| Network | Shared subnet within test lab |
For more information
About the authors
GustafSvenssonQuestions and comments:
- What other performance information would you like to see here?
- Do you have performance scenarios to share?
- Do you have scenarios that are not addressed in documentation?
- Where are you having problems in performance?
-
 Deployment web
-
 Planning and design
- Installing and upgrading
- Migrating and evolving
- Integrating
- Administering
- Monitoring
- Troubleshooting
-
 To do
To do
-
 Under construction
- New
-
 Updated
-
 Constant change
- None - stable page
- Smaller versions of status icons for inline text:
-


Contributions are governed by our Terms of Use. Please read the following disclaimer.
Dashboards and work items are no longer publicly available, so some links may be invalid. We now provide similar information through other means. Learn more here.