Sizing and tuning guide for Rational DOORS Next Generation 6.0
Author: Lee ByrnesDate: April 28, 2015 Build basis: Rational Doors Next Generation 6.0
Introduction
This report is to document the results of increasing the user load within a single test to explore the limits of the test architecture.Goal statement
The purpose of this test was to find the current sustainable user limit of the RM component of the CLM solution for the CLM 6.0 release with the Change Management options in use. The acceptable goals for a 300 users run can be found in the following link, deterioration of a noticeable number of transactions past these would be deemed a failure for the runhttps://jazz.net/rm/web#action=com.ibm.rdm.web.pages.showArtifact&artifactURI=https%3A%2F%2Fjazz.net%2Frm%2Fresources%2F_c6-88UqfEeSG_5Ml8dGbfg
Test description
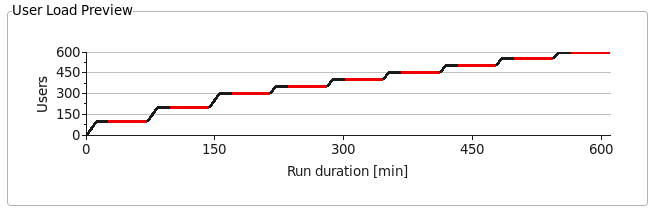
Previous testing had given us a clear indication of where our limit was, this test was configured to run just over that point The test was configured to reach 600 users in 9 incremental steps, each step involves a ramp up phase, a settle time and a run time. The first three stages added 100 users to the test system bringing it to the preferred test level of 300 users- 100 users ramped at 1 user every 7 seconds
- 15 minute settle
- Run duration of 45 minutes
- 50 users ramped at 1 user every 7 seconds
- 15 minute settle
- Run duration of 45 minutes
 All of this testing is performed with the Configuration Management (CM) functionality enabled and in use. All edit transactions are being submitted in an explicit change set and there is baseline and stream functionality being exercised.
Management summary
This test run shows that the system under test is stable up to and including 450 users, during the 500 user phase the transaction times start to escalate along with CPU usage. The CPU usage is a symptom of the system encountering lock contention issues. The current system limitation with respect to the work rate/user numbers is lock contention in the Jena component.Disclaimer
The information in this document is distributed AS IS. The use of this information or the implementation of any of these techniques is a customer responsibility and depends on the customers ability to evaluate and integrate them into the customers operational environment. While each item may have been reviewed by IBM for accuracy in a specific situation, there is no guarantee that the same or similar results will be obtained elsewhere. Customers attempting to adapt these techniques to their own environments do so at their own risk. Any pointers in this publication to external Web sites are provided for convenience only and do not in any manner serve as an endorsement of these Web sites. Any performance data contained in this document was determined in a controlled environment, and therefore, the results that may be obtained in other operating environments may vary significantly. Users of this document should verify the applicable data for their specific environment. Performance is based on measurements and projections using standard IBM benchmarks in a controlled environment. The actual throughput or performance that any user will experience will vary depending upon many factors, including considerations such as the amount of multi-programming in the users job stream, the I/O configuration, the storage configuration, and the workload processed. Therefore, no assurance can be given that an individual user will achieve results similar to those stated here.What our tests measure
We use predominantly automated tooling such as Rational Performance Tester (RPT) to simulate a workload normally generated by client software such as web browsers. All response times listed are those measured by our automated tooling and not a client. The diagram below describes at a very high level which aspects of the entire end-to-end experience (human end-user to server and back again) that our performance tests simulate. The tests described in this article simulate a large part of the end-to-end transaction as indicated. Performance tests include some simulation of browser rendering and network latency between the simulated browser client and the application server stack.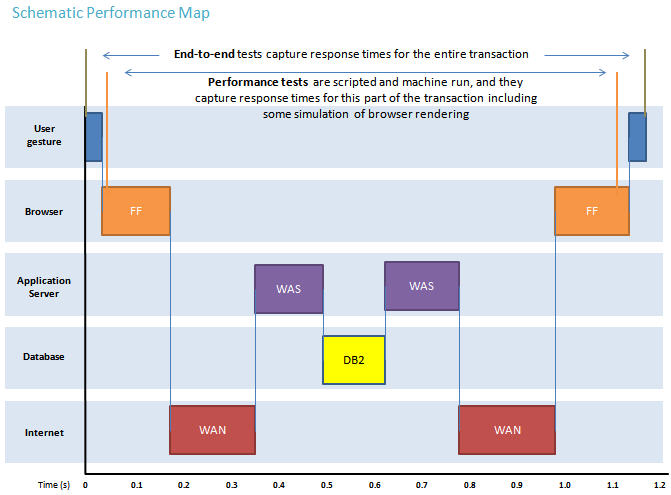
Topology
The topology under test is based on Standard Topology (E1) Enterprise - Distributed / Linux / DB2.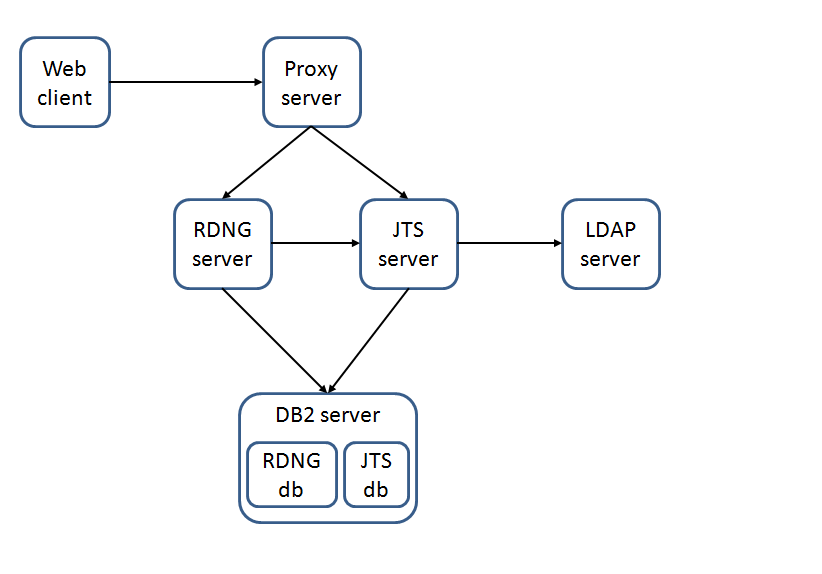
Detailed result description
Overall transaction profile
Counter data
Each phase of the stepped test is represented in the following table. The CPU value is an average taken from all the readings in each 45 minute stable run duration These graphs are using an overall average for all the transactions that occur in a test phase termed Page average we are using this to represent in broad terms how the system was performing, there is obviously variation in the 120 transactions that make up the overall test.| Users |
JTS CPU% | RM CPU% | DB2 CPU% | Page average (secs) | Page hits |
|---|---|---|---|---|---|
| 100 | 0.32 | 7.06 | 5.40 | 0.877 | 6,356 |
| 200 | 0.39 | 12.02 | 10.04 | 0.734 | 13,120 |
| 300 | 0.44 | 18.26 | 15.02 | 0.745 | 20,160 |
| 350 | 0.45 | 21.37 | 17.74 | 0.779 | 23,367 |
| 400 | 0.45 | 25.16 | 20.66 | 0.807 | 26,957 |
| 450 | 0.47 | 29.31 | 23.41 | 0.852 | 30,289 |
| 500 | 0.47 | 96.76 | 16.94 | 16.207 | 22,389 |
| 550 | 0.49 | 96.94 | 12.74 | 21.431 | 20,519 |
| 600 | 0.51 | 97.53 | 7.30 | 19.250 | 19,662 |
All servers CPU usage
This graph shows that the CPU usage for all three servers in the test environment. JTS - the CPU usage on the JTS server never rose above 1%, this server is under no strain. RM - the CPU usage was increasing in a smooth progression until 500 users were committed to the system and CPU usage escalated, from that point on the CPU was effectively being held at 100% on the RM server DB2 - the DB2 CPU usage was tracking with the RM CPU usage until the RM server encountered the bottleneck at which point the DB2 CPU usage began to drop off as the request volume dropped
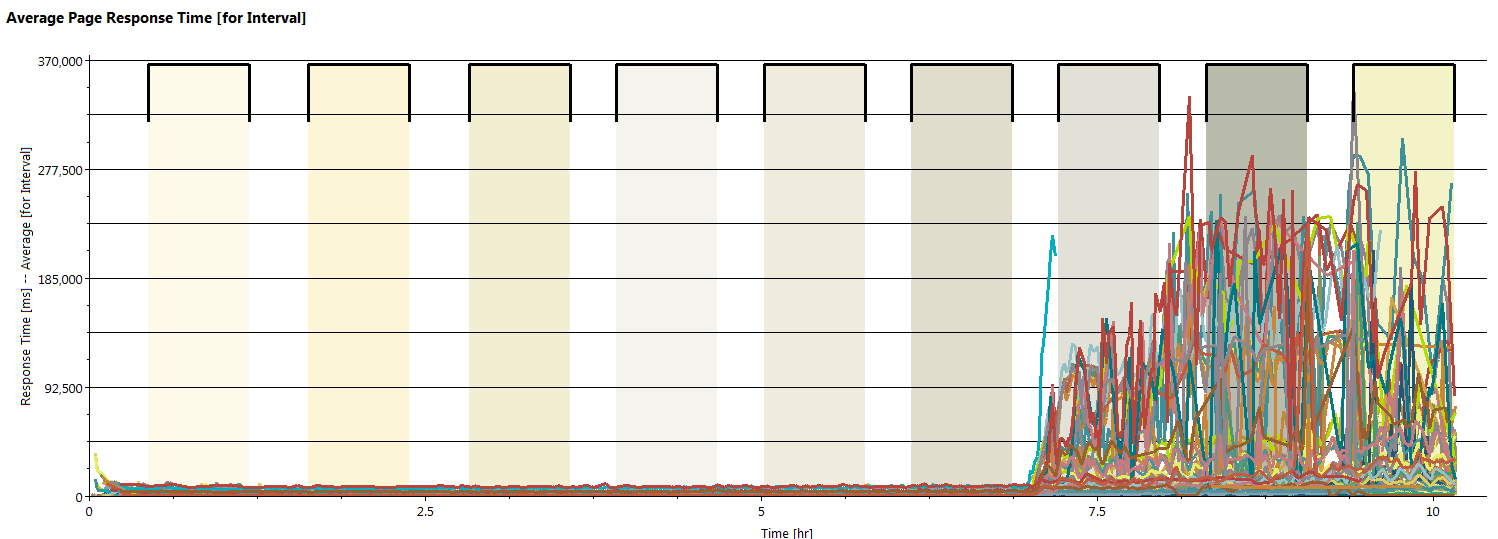
Overall test page averages
The Page averages for the test show that the increasing number of transactions (see next graph) were not causing the Page average to increase until the system had 500 users committed. At this time there is an escalation in the Page averages as the system begins to have trouble dealing with the workload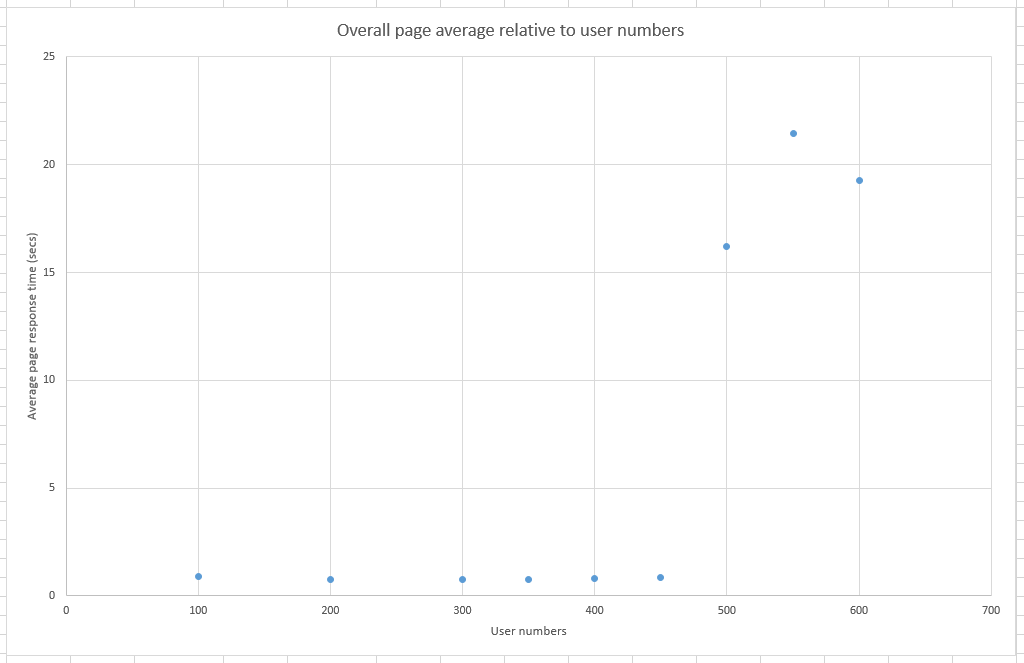
Overall test hit rate
This graph shows a linear progression in the workload the system is handling up to and including 450 users, once we pass that threshold into the 500 user phase the system cannot handle the higher rate which drives up response times. As we progress the Page hits drop off as the longer transaction times hold more and more resource.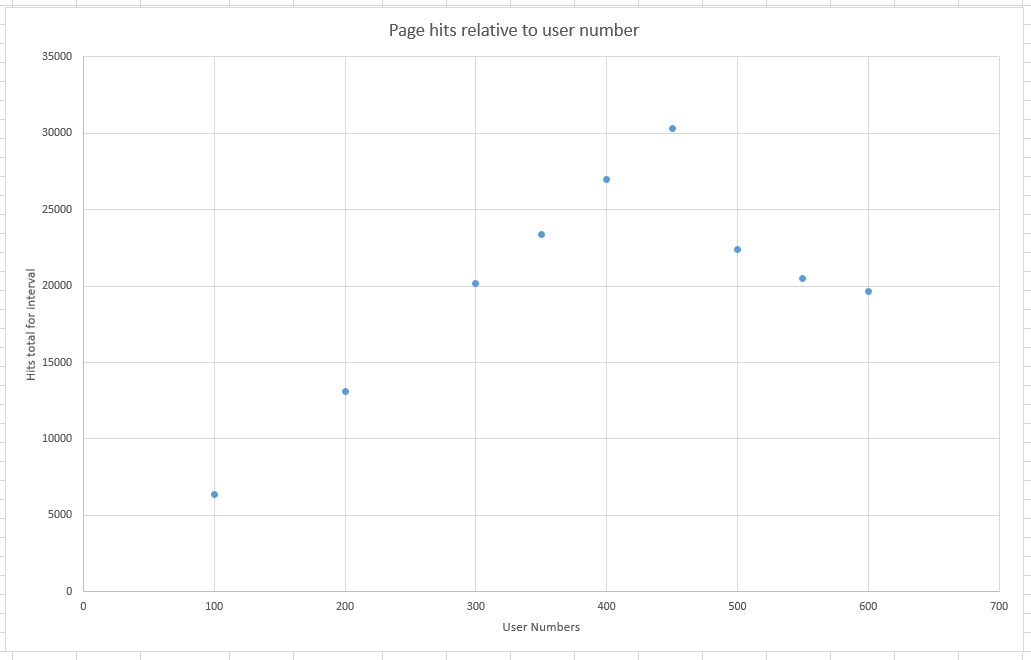
WAIT data
Need snappy back first Two links and analysis (smoking gun)JVM data
Server 31
The JVM on Server 31 had very light usage during this test, the Pause time never exceeds a quarter of a second and is around a tenth of a second for the majority of the test. Memory usage is effectively flat.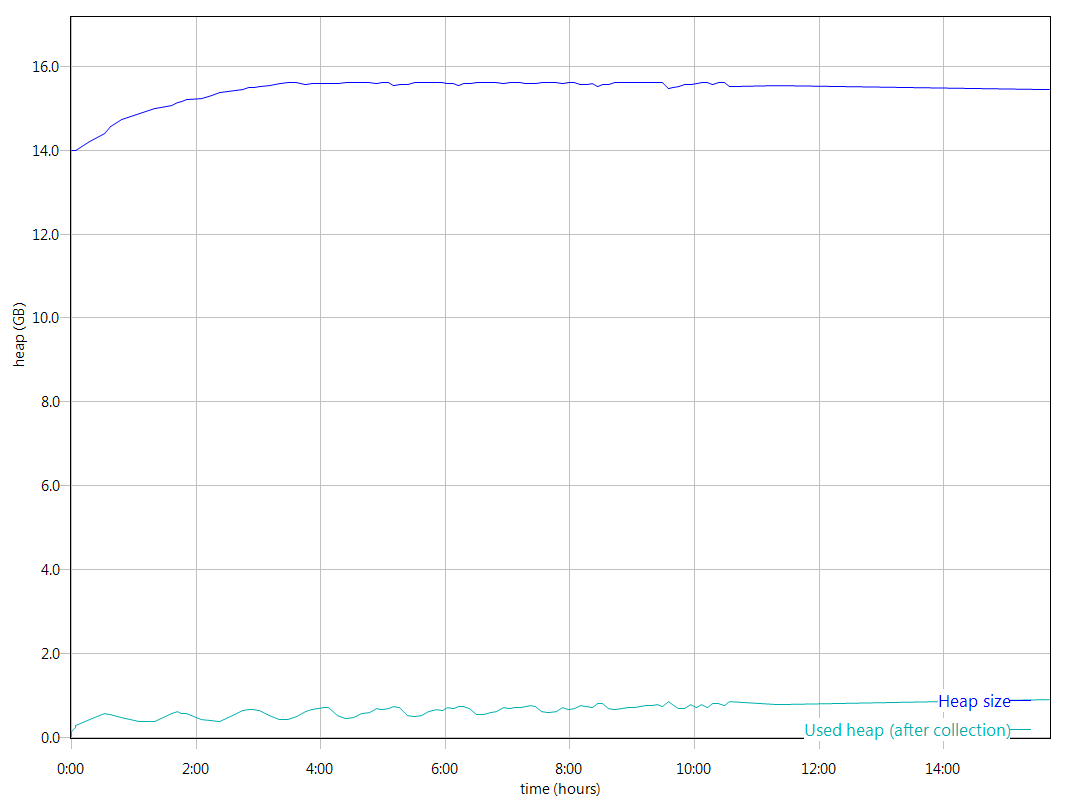
Server 32
The JVM on Server 32 was working hard in this test Pause times for the majority of the test were sub second however the JVM started to work harder as the load increase and from the 500 user point onwards we see multiple pauses at two seconds and a spike to nearly twenty seconds, this is unacceptable as the system cannot be performant under these conditions. The memory usage (Used Heap) shows two distinct behaviours- From the start of the test to the 8 hour mark we see a gradual consumption of the available memory as the system sets aside memory for the various system caches as they are populated
- At the 8 hour mark we see the system starting to struggle and there is a marked increase in memory consumption which does then level off but is never returned to the system.

Detailed environment description
IHS server
- rtpclmperf44.rtp.raleigh.ibm.com
- OS version: Redhat 6.5
- Physical hardware: 8 CPU / 16GB Ram
- IHS version: 8.5.0.2
JTS server
- rtpclmperf31.rtp.raleigh.ibm.com
- OS version: Redhat 6.5
- Physical hardware: 24 CPU / 31 GB Ram
- Websphere Version: 8.5.0.2
- Websphere LTPA: 240
- Websphere Webcontainer: 200
* Websphere Arguments:-Xdump:none -Xgcpolicy:gencon -Xmx16g -Xms16g -Xmn4g -XX:MaxDirectMemorySize=1G -Xcompressedrefs -Xgc:preferredHeapBase=0x100000000 -Xverbosegclog:logs/gc.log -Xdump:java:file=/home/wasdumps/javacore.%Y%m%d.%H%M%S.%pid.%seq.txt
RM server
- rtpclmperf32.rtp.raleigh.ibm.com
- OS version: Redhat 6.3
- Physical hardware: 24 CPU / 252 GB Ram
- Websphere Version: 8.5.0.2
- Websphere LTPA: 240
- Websphere Webcontainer: 600
* Websphere Arguments:-Xdump:none -Xgcpolicy:gencon -Xmx24g -Xms24g -Xmn4g -XX:MaxDirectMemorySize=1G -Xcompressedrefs -Xgc:preferredHeapBase=0x100000000 -Xverbosegclog:logs/gc.log -Xdump:java:file=/home/wasdumps/javacore.%Y%m%d.%H%M%S.%pid.%seq.txt
DB2 server
- rtpclmperf40.rtp.raleigh.ibm.com
- OS version: Redhat 6.3
- Physical hardware: 24 CPU / 62 GB Ram
- DB2 version: 10.1.0.2 (64-bit)
Test data
Our test data is created using an automatic generation script which uses a template to create identical projects, details as follows:Each project contains the following elements 52 modules, 121 folders, 1181 artifacts,
85000 module artifacts, 14 collections, 4 reviews,
258695 comments, 300 Public Tags, 50 Private Tags
238 Terms, 301817 Links and 200 Views There are 6 test projects in the test installation giving the following totals Total number of modules: 311
Total number of folders: 715
Total number of requirement artifacts: 7131
Total number of module artifacts: 500000
Total number of collections: 84
Total reviews: 16
Total comments: 1372302
Total public tags: 1800
Total private tags: 300
Total term count: 1428
Total link count: 1117456
Total number of views: 1200 For each project in the test data the Configuration management has been enabled to allow us to test that functionality under load. Each project had 15 direct child streams added and 25 change sets were created and delivered so that there was some history in the system.
Related topics: Deployment web home, Deployment web home
Author: Lee Byrnes
Questions and comments:
- What other performance information would you like to see here?
- Do you have performance scenarios to share?
- Do you have scenarios that are not addressed in documentation?
- Where are you having problems in performance?


| I | Attachment | Action | Size | Date | Who | Comment |
|---|---|---|---|---|---|---|
| |
CPU_USER.png | manage | 19.3 K | 2015-05-01 - 11:39 | UnknownUser | |
| |
HITS_USER.png | manage | 18.1 K | 2015-05-01 - 11:39 | UnknownUser | |
| |
JTS_JVM.png | manage | 23.7 K | 2015-05-01 - 11:38 | UnknownUser | |
| |
OverallDetailedTransaction.png | manage | 54.0 K | 2015-05-01 - 11:38 | UnknownUser | |
| |
PAGEAVG_USER.png | manage | 18.6 K | 2015-05-01 - 11:37 | UnknownUser | |
| |
RM_JVM.png | manage | 77.2 K | 2015-05-01 - 11:37 | UnknownUser | |
| |
ServerTopology.png | manage | 15.0 K | 2015-05-01 - 11:35 | UnknownUser | |
| |
UserProfile.png | manage | 7.4 K | 2015-05-01 - 11:35 | UnknownUser | |
| |
schematicperformancetestmap_somebrowsersim.jpg | manage | 52.3 K | 2015-05-01 - 11:36 | UnknownUser |
Contributions are governed by our Terms of Use. Please read the following disclaimer.
Dashboards and work items are no longer publicly available, so some links may be invalid. We now provide similar information through other means. Learn more here.