Trend reporting with Lifecycle Query Engine
Historical trend reports depict how data changes over time – for example, daily defect arrivals or test result success. Other Jazz.net articles describe how to create trend reports for the IBM Engineering Lifecycle Management (ELM) solution, focused primarily using metrics from the data warehouse (DW). There are additional considerations for trend reporting with the Lifecycle Query Engine (LQE), especially when reporting on versioned artifacts with configuration management enabled.
This article explores trend reporting with LQE, including:
- Available trend reports and metrics
- How to enable metrics collection, which is disabled by default
- Tips on authoring trend reports with Report Builder (RB)
- Summary of best practices
Trend reports and metrics available in LQE
LQE currently provides a starter set of trend reports, expected to grow over time based on client requirements. Some trends have multiple metrics; for example, the Work Item Totals trend includes artifact count and time estimate metrics. Each metric includes one or more attribute dimensions that you can use to set conditions or provide another level of detail in the trend report graph. The following table describes what is available:
| Artifact type | Trend | Metric Description | Dimensions |
| Work Item | Creation | Count of work items created in the time period | Project area, type, status, priority, severity, iteration, filed-against, team area |
| Closure | Count of work items closed in the time period | Project area, type, status, priority, severity, iteration, found-in | |
| *Totals | Count of all existing work items Sum of time estimates (in milliseconds) Sum of time spent (in milliseconds) | Project area, type, status, iteration, filed-against | |
| Test Case | Project area totals | Count of all test cases | Project area, state |
| Totals | Count of all test cases | Project area, state, test plan | |
| Test case execution record | Totals | Count of all test case execution records | Project area, test plan, test environment, verdict |
| Test case result | Totals | Count of all existing results Count of all current results | Project area, test plan, verdict |
| Iteration totals | Count of all existing results Count of all current results | Project area, test plan, verdict, iteration | |
| Requirement | Totals | Count of all requirements Count of all requirements by identifier | Project area, type |
| Requirement with Requirement Collection Totals | Count of all requirements Count of all requirements by identifier | Project area, type, collection/module | |
| Requirement with Test Plan Totals | Count of all requirements Count of all requirements by identifier | Project area, type, test plan |
*For work items, Totals currently includes only those that are open or that have been closed in the past year; it does not count work items closed longer than a year ago to avoid potential performance issues with very large repositories. To mitigate the risk of misleading data, set the time range to less than a year or use the iteration setting. This behaviour is specific to the Work Item Totals trend in LQE only.
For requirements, all 3 trends count the total number of requirements. The Requirement with Requirement Collection Totals metric adds a dimension to categorize by collection or module; those not used in a module/collection are still displayed. Similarly, the Requirement with Test Plan Totals metric includes all requirements with a test plan dimension; note that this metric does not indicate whether a requirement has an associated test case, only whether it’s part of a collection/module linked to a test plan. If you don’t plan to use the collection or test plan dimension, select Requirement Totals.
In each of the Requirement metrics, you can choose to count total requirements or requirements by identifier (ID). If you re-use a requirement in multiple modules, a total count will count each module instance as well as the base artifact, while a count by ID will count that requirement just once. If you are applying the collection or test plan dimensions, you can count by ID to count the unique IDs within each collection or test plan.
You can create some trend-like time series reports using current data and the date attributes associated with artifacts. For example, the article Trend and Aging Reports shows how to build a time series report to show aging defects. You can apply the same steps to show a time series for creation rate of other types of artifacts.
In some cases, the DW provides more extensive metrics; this is especially true for work items. You can continue to use the DW trend reports for unversioned artifacts and for work items even if you use LQE for other reports. You must use LQE for all reports on versioned artifacts.
Enabling metrics collection in LQE
Because metrics calculations can be performance-intensive, especially for large numbers of configurations, LQE metrics collection is disabled by default. To enable trend reports, the LQE administrator must define and enable metric collection tasks on the LQE Data Metrics tab (https://server:port/lqe/web/admin/metric-config), including which metrics to collect and the task schedule. LQE then collects or calculates the metrics from the operational data in the index at the scheduled times. The Knowledge Center provides more details on defining collection tasks.
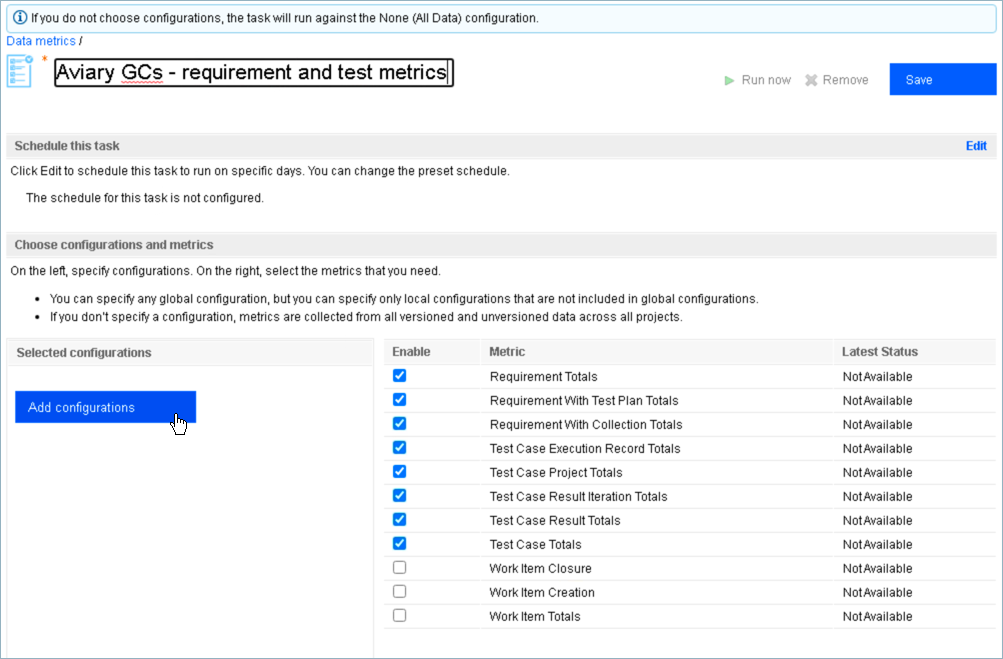
If you have enabled configuration management, your tasks must also specify which configurations to collect metrics for. Metrics are calculated on a per-configuration basis, since they can vary across different configurations of the same component. Selecting a global configuration automatically includes its contributions. Be sure to select streams; by definition, baselines do not change over time and therefore have no meaningful trend data.
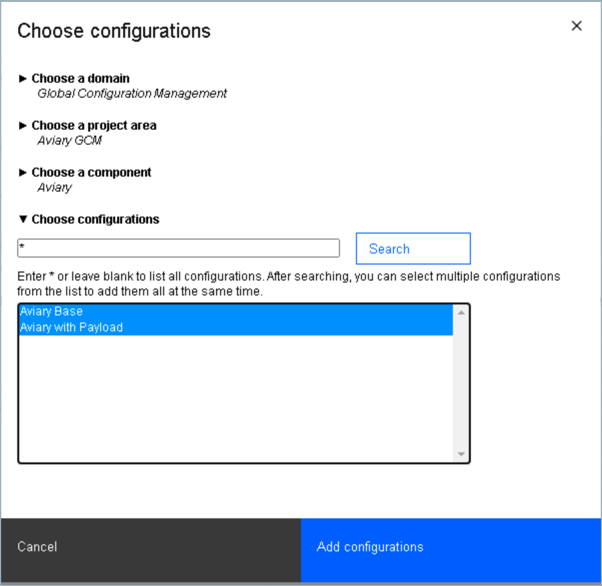
New configuration selection dialog in 7.0.1
Note: The metrics collection takes place based on the global configuration contributions in the hierarchy each time the job runs. If those contributions change significantly between collection times, for example you add new components, your metrics will reflect those changes.
When defining the schedule, consider the frequency of data points and how you’ll visualize trends (daily, weekly, monthly). Consider scheduling metrics collection tasks at times when server usage is low.

For project areas not enabled for configurations, define and enable a separate metrics task that does not select any configurations. LQE will then calculate the metrics for all resources in its data store. You can report on those metrics by choosing the LQE data source (not scoped by a configuration).
Note: When you enable metrics for any configuration, LQE also calculates metrics for all work items in all Engineering Workflow Management (EWM) project areas as well. In this scenario, those work item metrics are only available when you choose the LQE scoped by a configuration data source.
You can define multiple metric collection tasks, for example to collect different metrics for different configurations and for non-versioned artifacts.

Clearly establish what configuration contexts you need to report against; metrics are collected only against that context. To report at different levels of the hierarchy, you must either set conditions in the report to limit scope by project area or by a dimension, or collect metrics at each desired level. Users must set their run-time context to the same configuration specified in the task; they can’t choose a lower-level configuration in the hierarchy because it will show only configurations at that level, and not the parent global configuration.
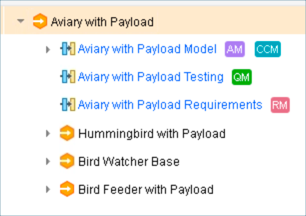
For example, given the Aviary with Payload configuration shown below, if you collect metrics against Aviary with Payload, users can’t set the run-time context to Bird Watcher Base, or the RM stream Aviary with Payload Requirements. Those contributions are counted within the Aviary with Payload context, but the counts are not saved with the individual contributions.
Because metric calculations can be performance-intensive, especially for large numbers of configurations, be judicious in choosing only the metrics you will report on, and only the configurations that require those metrics. Communicate to report authors and users what metrics are available for which configurations, so they don’t try to report on data that doesn’t exist.
Calculation for a metric begins the first time you run the associated task; there is no retroactive calculation. For example, if you enable the Requirements Totals metric starting June 1, a trend report for May would show no results.
If LQE is offline or reindexing during a scheduled metrics task, it can’t collect metrics, which can lead to data gaps in the trend reports. If that is a concern, consider deploying a second LQE server for increased availability, as described in the article Scaling the configuration-aware environment.
Authoring historical trend reports
Before you begin authoring reports, ensure you have run the task for the needed metrics at least once so you can preview results. The metrics tasks shows the latest run status. You can manually run a task from the metrics administration page, as shown in the screen capture of the multiple metrics above. If you have only run the collection once, use a bar visualization initially; a line with one point will not display and will show no results.
Authoring a trend report with LQE is much the same as with the DW. To report on versioned artifacts in a configuration context, choose the LQE scoped by a configuration data source; to report on unversioned artifacts, choose LQE. Select the Historical Trends report type.
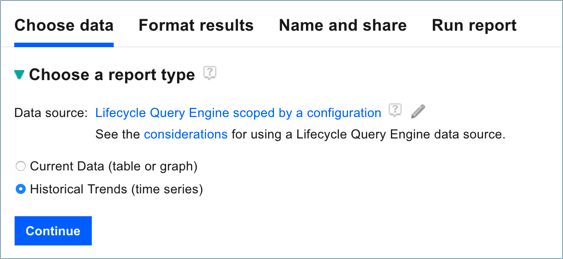
Note: Currently when you select LQE (not scoped by a configuration), metrics include both unversioned and any versioned artifacts. To exclude versioned artifacts, use the Limit Scope section to explicitly select the desired project areas that are not configuration-enabled. Otherwise your metrics can be misleading, with different versions of the same artifact counted multiple times with different dimensions.
When you select the trend report in the Focus on artifact trends section, be sure to choose metrics that are enabled for collection, especially for reports that require configuration context. You can include multiple trends in a single report, for example to compare work item creation and closure trends, or total test results compared to execution records.
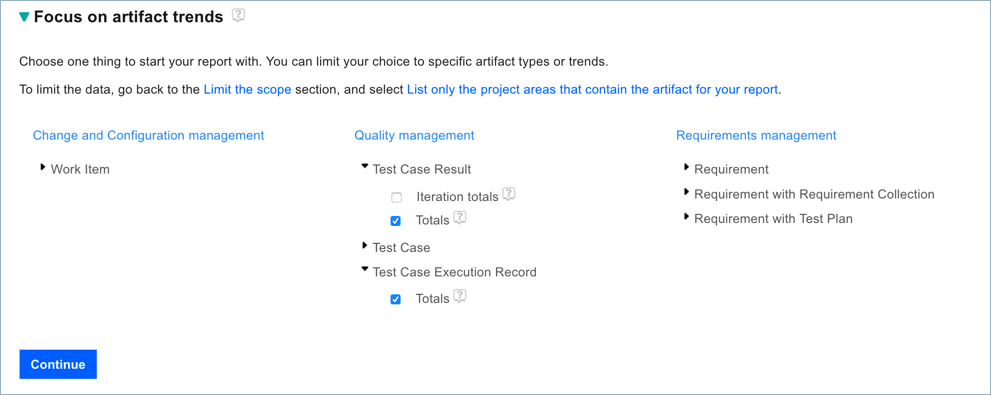
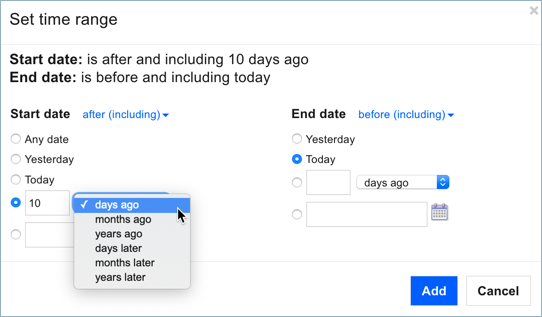
You must set a time range, using either absolute or relative dates. The default setting is relative: from 3 months ago until today; the specific dates are determined when the report is run. At run time, the report user can either use the built-in settings, or edit the Filters to set a specific data range. Keep in mind that larger date ranges typically include more data points, and can take longer to run and render. In this example, we set the range for the past 10 days.
In addition to time range, you can set conditions on one or more of the metric dimensions, for example to filter work items by type or in this example, test artifacts to specific test plans.
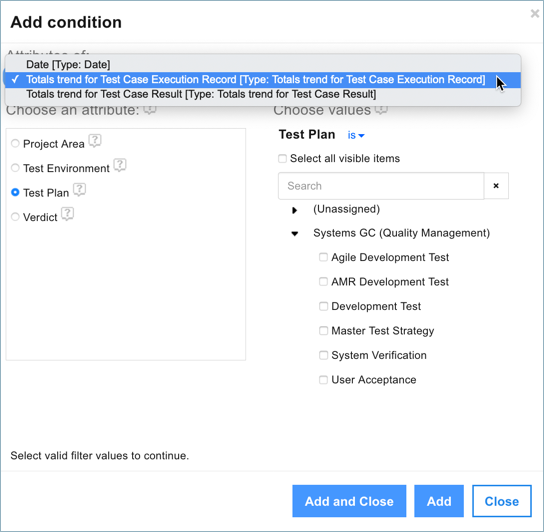
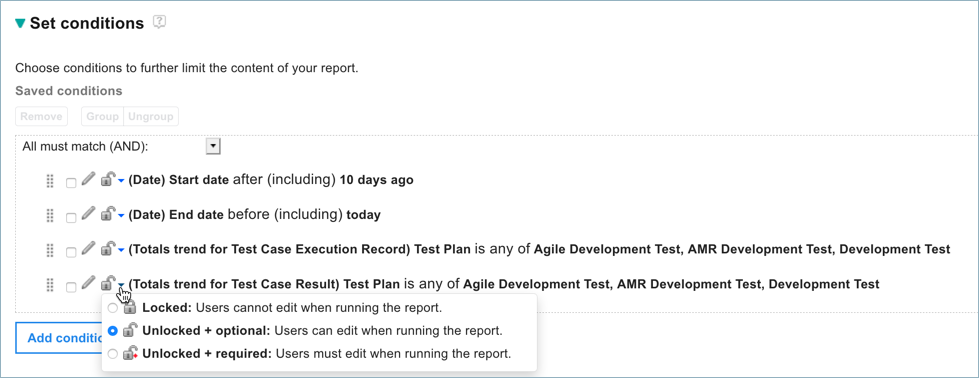
The metric dimensions are the only attributes you can use for conditions for trend reports. Remember that if you want to scope the results to a subset of the global configuration, you might set conditions on project area. While you can set conditions on Date dimensions, typically you would not; exceptions might be if you wanted for example to see only data collected every Wednesday, or the 1st of the month. Usually you manipulate the date by time range and graph settings. As with other reports, you can lock the conditions so they can’t be changed by report users, or allow or require the user to change them at run time.
Configuring the report graph
You can choose the graph type (line or bar), and the date scale to use (days, weeks, months, or years) on the X axis. When you set the date scale, you can also choose to substitute a zero value for any missing data; this is important for line graphs, which would otherwise simply connect the data points and possibly show a misleading trend.
For the Y axis, choose the metric to report on:
- To show the trend for one metric, choose Count values of a single attribute, setting the Units drop-down menu to the desired metric, for example the totals or current totals for Test Case Results.
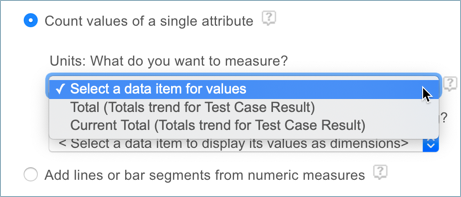
Optionally set the Dimension menu to one of the metric’s dimensions to subdivide the values into separate lines, bars, or bar segments. For example, you could show separate lines or bars for Test Case Results based on test plan, verdict or another dimension. You can select at most one dimension to display for the trend.

- To show multiple trends, such as totals for both Test Case Results and Test Execution Records, select the Add lines or bar segments option. Switch between the available trends and select the metrics for each, then click Add. When including multiple metrics, you cannot select any dimensions; each metric will be a line, bar, or bar segment.

To preview your graph, click Continue or Refresh. If you are using LQE scoped by a configuration, you might need to switch to the Run report tab and select a configuration from the Filter; then return to the Format results tab to preview graph. Remember that the trends you choose must reflect the enabled metrics tasks, or you won’t get any results. The following illustrations show an example of Test Case Results by Verdict (single metric with dimension) trend shown as a stacked bar, and of total Test Case Results and Test Case Execution Results (two metrics) shown as a line graph:
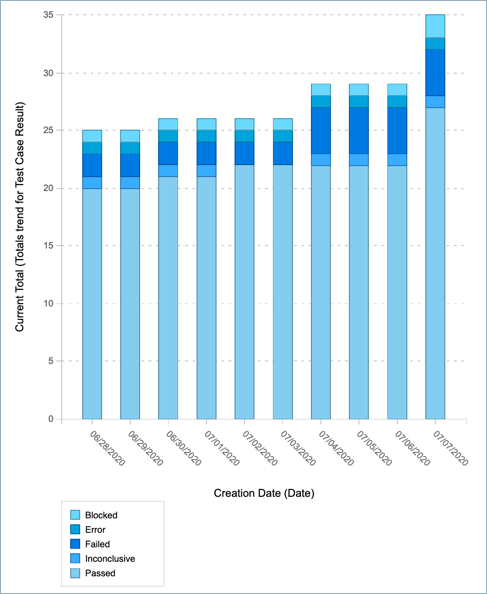
Stacked Bar of single metric with dimension
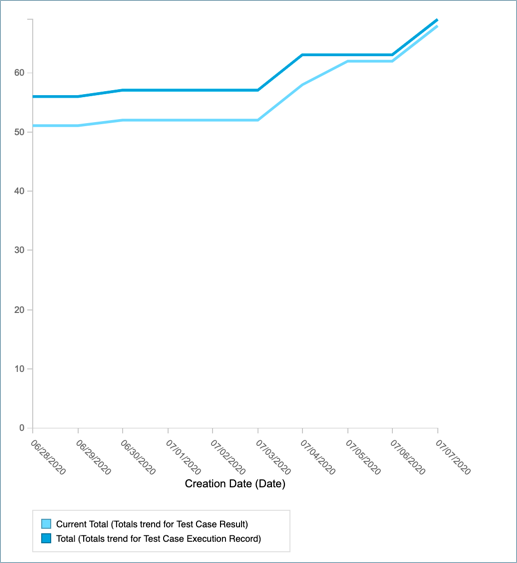
Line graph of 2 metrics
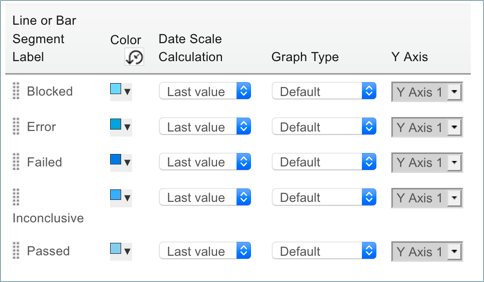
From the list of measures, you can customize the colours, display type (line or bar), and add a second Y axis, as you can for other reports. If you chose Add lines or bar segments, you can add goal lines to indicate targets, or vertical date lines to indicate key milestones, as described in the article Trend and aging reports in Report Builder.
You can also change the Date Scale Calculation value. If you are showing a Totals trend, you most likely want to show the last value collected for the timeframe, whether that is the same frequency as your collection or rolled up to a longer time period (weeks or months). In some cases, you might choose to show the first value, or the average for the time period. When rolling up, summing total counts would give incorrect results. Note: If your date scale and collection period are the same frequency, the first, last, sum, and average values are the same. For trends like creation and closure, if you are rolling up to a longer time period, you likely want the Sum Total of all created or closed during the period.
You cannot create any additional calculated values or custom expressions for trend reports. You can modify the query in the Advanced section, but that limits further changes you can make in Report Builder: you can change some of the graph display characteristics, but you can’t choose different metrics or dimensions. Save a backup copy of your report before making any changes to the Advanced section.
Running trend reports
When you run trend reports for versioned artifacts, be sure to specify configuration contexts for which metrics are available. If metrics collection is not enabled, the report will show no results.
As described in the section on enabling metrics collection, your run-time context must match the context you chose for collecting metrics. You cannot choose a lower-level global or local component in the hierarchy because it will show only the respective configurations at that level, and not the global configuration you chose for metrics. It is important to communicate appropriate context selections to report users to avoid confusion.
Managing configuration change and metrics impact
LQE does not cache the global configuration hierarchies. When the scheduled job runs, it calculates metrics based on the contribution hierarchy that exists at that time. If you change the hierarchy (add, remove, or replace contributions), metrics for the updated global configuration might differ from those collected from the previous instance, changing the overall trend. Earlier metrics are not changed or removed. In most cases, this would be expected behaviour; however, there might be exceptions. If your team is making significant configuration changes, consider the impact to your existing trend reports and make appropriate updates, such as defining new time ranges, or using a date line to indicate when changes occurred.
Summary of best practices
As you plan your trend reporting with LQE:
- Be selective in the metrics you collect and which configurations you collect them for. You can define multiple tasks.
- Schedule metric tasks to run at times of low LQE usage, and monitor LQE performance.
- Ensure report authors and users know what metrics are available, and if applicable, for which configurations.
- If continuous collection is critical, consider deploying a parallel LQE server.
- For more extensive metrics for work items, consider using the data warehouse.
- Follow general best practices for Report Builder in terms of limiting scope, naming and tagging conventions, and so on.
- More data typically takes longer to load. Set time ranges and scoping criteria appropriately, and test report performance.
- Review your metrics tasks periodically to ensure they still reflect your needs, and disable or delete those you no longer need.
For more information
- Introducing historical trend reporting in Jazz Reporting Service Report Builder
- Trend and aging reports in Jazz Reporting Service Report Builder
- Collecting metrics for historical trend reports in the IBM Knowledge Center
- Reporting on metrics and historical trends across projects in the IBM Knowledge Center
- Report Builder best practices
- Scaling the configuration-aware reporting environment
About the author
Kathryn Fryer is a Senior Solution Architect focused on the IBM Engineering Lifecycle Management solution, particularly around global configuration management. Drawing on 30 years at IBM in software development, management, and user experience, Kathryn works closely with clients and internal development and offering teams to develop usage models, aid adoption, and improve product offerings. She can be contacted at fryerk@ca.ibm.com.
© Copyright IBM Corporation 2020