Scaling the configuration-aware reporting environment
Tim Feeney, Kathryn Fryer, Jim Ruehlin IBM
Last updated: 29 Sep 2023
Build basis: IBM ELM Solution 6.0.6.1, 7.0.2
The IBM Engineering Lifecycle Management (ELM) solution provides configuration management capabilities that extend beyond the traditional software configuration management provided by applications such as Engineering Workflow Management (EWM). IBM ELM can also version lifecycle artifacts such as requirements, designs, and tests. Each of the ELM applications maintains its repository of versioned artifacts to support the creation and maintenance of those artifacts.
To report on versioned artifacts using the Jazz Reporting Service (JRS) or Engineering Insights (a.k.a. RELM), you need to use the Lifecycle Query Engine (LQE) as a data source. See the Reporting architecture overview for a short description of all the reporting components available.
LQE can be used to report on non-versioned data as well. Though much of the guidance in this article applies to reporting on data in non-configuration-aware environments, that data is not the focus of this article, since configuration-aware environments can reach greater scale and complexity.
Because LQE is both an application for indexing data and a data source for report execution, the LQE server is resource-intensive and needs sufficient resources to respond to reporting queries and keep up with all updates published by the ELM applications. It can be affected by the increased use of any ELM applications because it consumes data from all of them. You should monitor LQE regularly to ensure users continue to see an acceptable performance.
You must deploy appropriate infrastructure to support your reporting needs and the scale of your ELM environment. A typical standard enterprise topology includes a single separate server for LQE and another for Report Builder. This may be insufficient as the size and complexity of the ELM data and the number of users of the IBM ELM solution grows. Increasing the frequency and complexity of reports and queries needed to provide critical data insights is also a factor to consider.
This article describes patterns and techniques for architecting your configuration-aware reporting environment to support your data, user, and query scale needs, including the following:
- Supporting a high volume of data available for reporting
- Individual LQE servers for each product line
- “Federated” LQE server at an Enterprise level for cross-product line reporting needs
- Supporting a high volume of users for report authoring and execution
- Identical LQE servers fronted by Reverse Proxy server for high volume query requests
- Multiple Report Builder servers to group related reports for a high volume of report authoring and rendering
- Improving LQE server availability while reindexing
- Deploy secondary LQE server to perform reindexing
Initial LQE server configuration
For enterprise deployment, at a minimum, your server hardware should start with 16 cores (2GHz minimum) and 96GB of memory. Your disk should be an SSD connected directly to the LQE server. Avoid using NFS or other non-local file systems. Follow Configuring LQE or LDX for improving performance and scalability to set up your LQE server. That guidance recommends LQE be deployed on a Linux-based system. Although LQE works fine on a Windows-based system, due to limitations in I/O throughput, we have seen customers achieve better success moving to Linux or running LQE on physical rather than virtual servers.
Monitor your overall memory usage. The total amount of RAM should be larger than Apache Jena index size + JVM heap + 2GB. The Jena index, Java heap, and OS all need to be in memory at the same time. If this sum is approaching your physical memory, you need to add additional RAM. With insufficient memory, server performance will suffer and LQE may hang. Find the Jena index and JVM heap sizes in the Statistics section of the Health Monitoring page.
Determining when current reporting environment sizing or topology is insufficient
Monitor your LQE server regularly by checking the LQE Health Monitoring page. The memory consumption chart on the Performance page should have a regular saw-tooth pattern. Each drop indicates that Java garbage collection is working to reclaim JVM heap from unused references. This process takes time and the system may become slower to respond. Shorter teeth in rapid succession near the maximum heap size mean the JVM can’t reclaim a significant amount heap and is spending a lot of effort to try and keep the process running without a lot of free heaps to play with. This leads to an unresponsive LQE. Check that the JVM heap and RAM are large enough.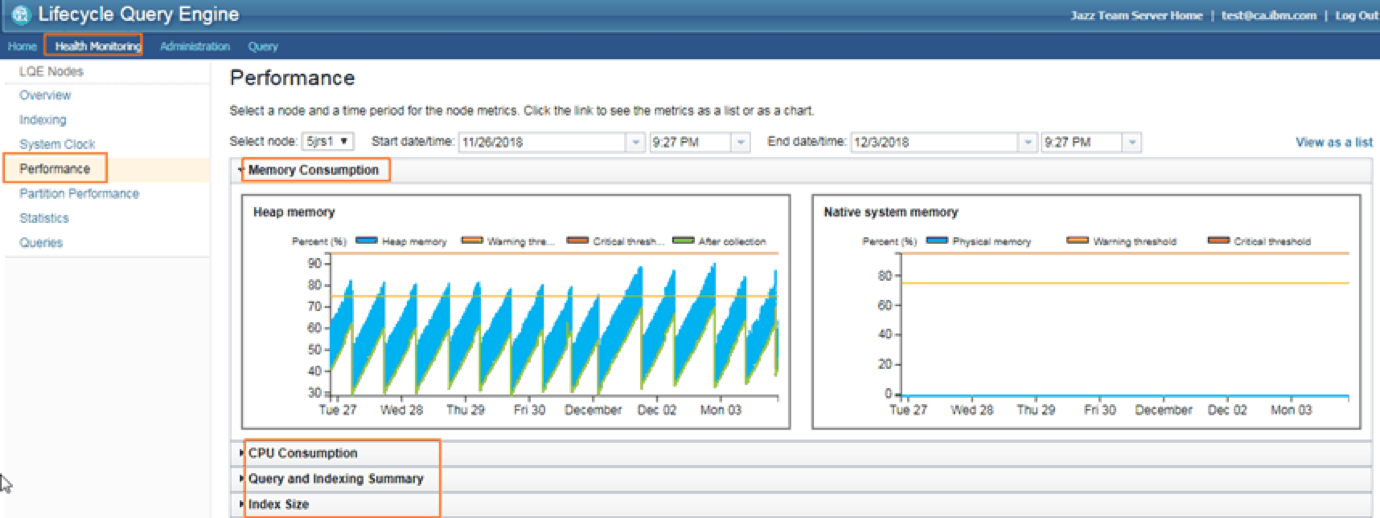
In the Queries page, look for Completed Queries that take a long time or whose response time is increased compared to past response times. Queries that take more than 10 seconds may indicate a performance issue. These queries should be analyzed for possible optimization (see Report Builder best practices). If many queries run longer than 10 seconds to run, it might indicate a performance issue that could be addressed by scaling LQE servers.
Also, look at the Running Queries to identify queries that are running longer than the timeout setting. You can also check for blocked queries, which administrators have explicitly blocked from running, typically because they are known to exceed the environment’s timeout setting.
Check the Query Execution Summary graph to see if the read times are increasing, which might indicate you need to scale LQE. In particular, check the scale of the graph. You may see it change from milliseconds to seconds, indicating that I/O issues are impacting performance.
On the Statistics tab, review the peak number of running queries and the number of completed queries for a partition. The Queries tab is also a bubble chart for the last 500 queries, which can show a trend for queries as a whole. Watching these for increases over time can also give you some insight into when it’s time to scale LQE.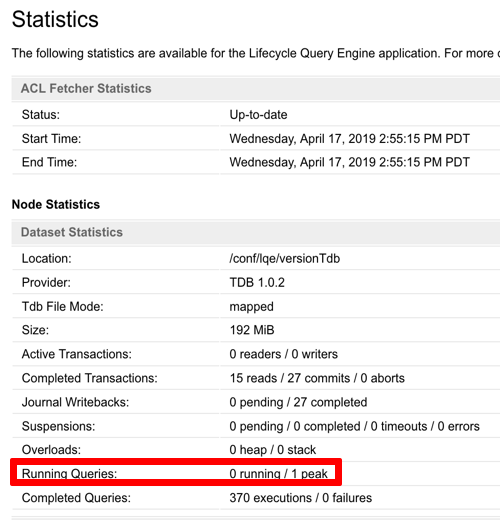
As of 6.0.5, JMX MBeans are available for monitoring aspects for LQE performance. See Monitoring the performance of Lifecycle Query Engine using MBeans. If you have implemented an enterprise monitoring strategy, consider incorporating these MBeans as part of monitoring the health and performance of LQE. While these MBeans provide useful information, they are supplemental to the more complete picture on the LQE Health Monitoring page.
The Jazz.net article Improving LQE Performance includes recommendations for adjusting parameters to improve performance. Adjust parameters or scale vertically (add memory and CPUs) before you decide to scale LQE horizontally. The vertical approaches are easier, less complex, and less expensive. However, if you find that you often need to adjust parameters to address performance degradation, or if adjusting the parameters don’t improve performance, consider scaling your LQE topology using the patterns summarized below.
Supporting a high volume of data available for reporting
Individual LQE servers for each product line
If a single LQE server is proving insufficient, consider deploying multiple LQE servers to expand the available system resources to handle the data volume. One strategy is to separate the data collection into logical groupings, typically along organizational boundaries, such that each group has its own LQE server in its own ELM environment. For example, an organization with multiple product lines (or business units) would have their own LQE server; smaller groups that generate less data could share an LQE server. Each LQE server would have its own distinct set of data collected from the IBM ELM applications; ideally corresponding to a set of IBM ELM application servers dedicated to that organizational grouping.
For example, as shown above, Product Line 1 (PL1) has its own ELM applications and LQE server, which includes data only for the Product Line 1 applications. Similarly, Product Line 2 (PL2) has a second set of ELM applications and LQE server, distinct from Product Line 1, which includes data from only the Product Line 2 ELM environment. This reduces the amount of total data for each LQE server, and therefore the resource requirements for the server.
Note that with this configuration, you can report on either Product Line 1 or Product Line 2, using the appropriate LQE server; you can’t report across the two product lines, that is, a report cannot be built with data from both LQE servers. To report across all of the Product Lines, you would need an LQE server that collects data from all of the Product Line environments, as described in the next section.
“Federated” LQE server at an Enterprise level for cross-product line reporting needs
To support reporting on data across product lines (from above example), ELM applications from each of the product line deployments would need to publish their data to a central or “federated” LQE server. This would be similar to having a single LQE to support your entire ELM deployment, which likely requires a more powerful server than the product line LQE servers. However, you should have fewer users running fewer reports at the enterprise level, and less frequently; the product line LQE servers would take most of the departmental reporting load, so the overall demand on the enterprise level LQE server would be less than if it were your only LQE instance. You should reserve the use of the “Federated” LQE for reports that cross-product line LQE boundaries and try to avoid overly complex queries as there is much more data in the federated instance.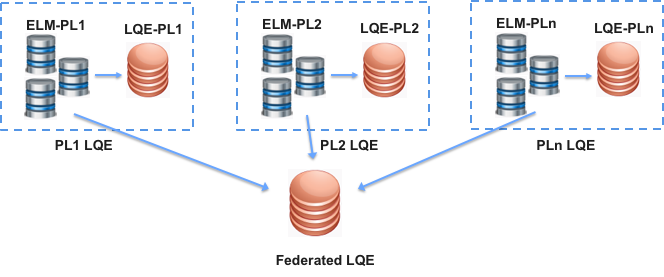
In the above figure, the Federated LQE receives inputs from each of the Product Line application instances so that reports can be created that span product lines.
Supporting a high volume of users for report authoring and execution
The previous section described approaches to address large amounts of data for reporting. The topologies below offer suggestions to support scaling your environment to support a large number of users running reports (including scheduled reports) in general, several executions requiring complex rendering of results, and large-scale authoring of reports.
Identical LQE servers fronted by Reverse Proxy for high volume query requests
In some cases, the volume of report executions and resulting query load on the LQE server can become so high that the LQE server cannot respond fast enough, leading to delays in the availability of new data for reporting. The resource demand is further compounded because LQE is also constantly indexing updates published from the ELM applications.
The recommended solution is to deploy multiple LQE servers, each receiving the same data feeds from the ELM applications. This differs from the solution described earlier, where each LQE server had separate and distinct sets of data. Set up a reverse proxy server to route requests from the Report Builder server to either of the LQE servers.
Note that this is not a clustered LQE topology; each LQE server gets its data from the same data feeds, and each has its own independent, duplicate copy of the application data. In this configuration, each LQE server also has its own independent relational database.
Because the application data is published to and indexed by each LQE server independently, it is possible that the LQE servers could become slightly and temporarily out of sync. Any disparities should be quickly remedied as the indexing catches up to changes.
The exact steps to accomplish this configuration are documented in Distributing query workload.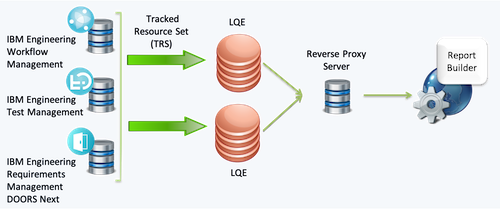
Multiple Report Builder servers to group related reports for a high volume of report authoring and rendering
A less common scenario occurs when the load on the Report Builder server is high due to the volume of users authoring or running complex reports. In this case, the approach adds a second Report Builder server. In such cases, you would group reports along some sensible boundary so each Report Builder server manages a distinct group of reports, and the user load is spread between them. In this case, a report would reside only on the Report Builder server where it was originally authored, and users would go to the Report Builder server for their business unit, program, etc.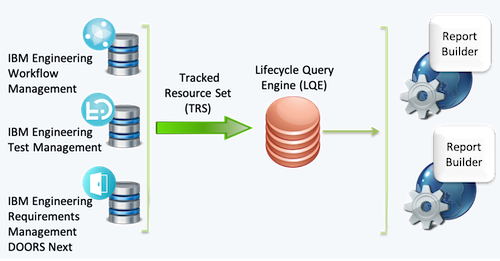
Improving LQE availability while reindexing
Ideally, you would never need to reindex your LQE data source. In many cases, validating TRS feeds and the LQE index can be used to bring LQE reportable data back into alignment with its source. However, specific issues or scenarios such as major changes in an application data schema might require reindexing; while doing so, the LQE server is unavailable for reporting. Reindexing large amounts of data can take a long time, potentially impacting users who need to run reports as well as the collection of metrics data during the reindexing period.
To minimize downtime and metrics gaps, you can deploy a second LQE server with the same data feeds as the first (similar to the Identical LQE servers fronted by Reverse Proxy pattern). The second LQE server runs the reindex while users continue to use the initial LQE server for production reporting. Once the second server completes the reindex, copy the updated index to the production LQE server. The second LQE can be a standby server used only for this reindexing purpose, in which case it could be a smaller server than your production reporting server.There are several detailed steps to this scenario that are documented in “Reducing downtime during LQE reindexing” along with details on the variations. Given the complexity of this approach, we recommend contacting IBM Support to review your implementation plan.
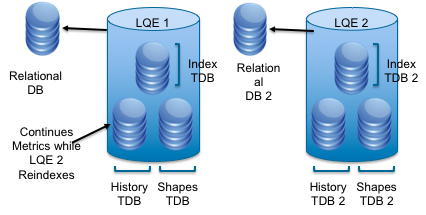
This technique can be combined with the topology described in “Identical LQE servers fronted by Reverse Proxy”. In such a scenario, you would set the reverse proxy to route users to only one of the LQE servers while you reindexed the other. Once the reindex completes and both LQE servers are refreshed with the updated index, bring both LQE servers back online and configure the reverse proxy to route to either of them again.
Using DCC/Data Warehouse in a configuration-aware reporting environment
As established earlier, you must use LQE to report on versioned artifacts. So what does that mean for the data warehouse (DW)?
The DW does not collect data from RM and QM project areas that are enabled for configuration management. If most of your projects are configuration-enabled, that will mean slower growth for your DW database.
Once you’ve configured applications to use LQE, it collects data for all of the project areas in the registered applications, whether they use configuration management or not. You could choose to use LQE for all reports, in which case you could disable the DCC jobs that feed the DW and stop the growth of that database.
However, it’s more likely that you would continue to use the DW for some of your reporting needs. For example, the DW continues to collect data for all work items in Engineering Workflow Management (EWM), and it supports out-of-the-box reports and rich work-item metrics that are not currently available in LQE. You can continue to use those DW reports for work items, although you do need to use LQE for reports that include links to versioned artifacts. The DW also includes some data not yet available in LQE, such as builds and work item history.
You could also continue to use the DW to report on non-configuration-enabled RM and QM project areas. Although that won’t reduce the amount of data stored in LQE, it would reduce the query workload and potentially impact performance.
Consider your reporting needs as you decide whether and how to use the two data sources, and then plan your infrastructure needs accordingly.
Summary
The IBM ELM solution provides powerful reporting capabilities for configuration-aware data. The complexity and scale of this reportable data require sufficient computing resources to reliably and efficiently manage and generate reports. As described in this article, there are patterns available to adjust reporting environments to meet your scalability needs. Key to your success is proactively monitoring the health and well-being of the environment so you know when adjustments are needed.
For more information
- The Jazz reporting alphabet
- Choosing the right reporting data source
- Jazz Reporting Service: Data warehouse or LQE?
- Configuring LQE or LDX for improving performance and scalability
- Monitoring and managing the performance of Lifecycle Query Engine
- Monitoring the performance of Lifecycle Query Engine using MBeans
- Improving Lifecycle Query Engine performance
About the authors
Tim Feeney is an Executive Solution Architect who works with IBM’s key customers to architect lifecycle solutions, deployment topologies and usage models across the IBM Engineering Lifecycle Management solution; he uses these experiences to develop best practices and guidance and works with IBM Offering Management and Development to further improve the solution. Tim can be contacted at tfeeney@us.ibm.com.
Kathryn Fryer is a Senior Solution Architect focused on the IBM Engineering Lifecycle Management solution, particularly around global configuration management. Drawing on 30 years at IBM in software development, management, and user experience, Kathryn works closely with clients and internal development and offering teams to develop usage models, aid adoption, and improve product offerings. She can be contacted at fryerk@ca.ibm.com.
Jim Ruehlin is a Senior Solution Architect with the ELM Global Response Team and has supported, developed, and deployed ELM solutions for over 10 years. Jim can be contacted at jruehlin@us.ibm.com.
© Copyright IBM Corporation 2020