Introducing Historical Trend Reporting in Jazz Reporting Service Report Builder 6.0.1
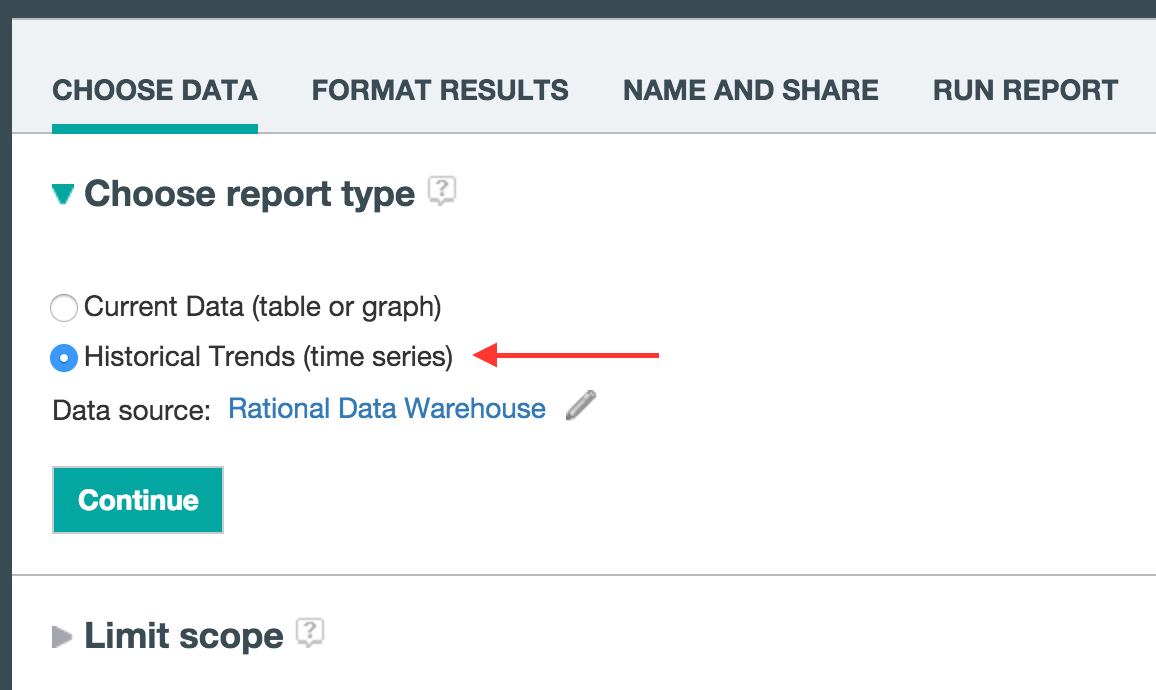
The Report Builder now supports creation of historical trend reports. These reports display trends of certain measures over time, possibly separated by an attribute dimension. Their unique character warrants a different flow than reports on current data. We have introduced a new section where you can choose your report type. You can pick either Current Data (same as existing flow) or the new Historical Trends report type, which has, instead of the traceability section, a section where you set the time range for the trend you are measuring. Historical trend reporting is currently available only for the Rational Data Warehouse data source.
Note: For a continued discussion of trend and aging reports in version 6.0.3, see Trend and Aging Reports in Jazz Reporting Service Report Builder 6.0.3.
Single trend with dimensions
Let’s consider an example where you want to display the total work items separated by a value dimension of their status (resolved versus unresolved). First, you pick the Historical Trends report type:
Next, you decide what trend and artifact you are interested in measuring. In the Focus on artifact trends section you select from a list of artifacts and associated trends. Since you want to measure work item totals, you pick the basic Totals trend under Work Item. Alternatively, if you wanted to find out about work item creation trends instead, you’d pick Creation trend. For information about specific trends refer to the appendix section of this document.

The next step is to select a time range to capture the trend within. In the Set a time range section the default time range is set to the last 3 months, and you can change it to any range you like. For this example, let’s set it to the last 2 months.
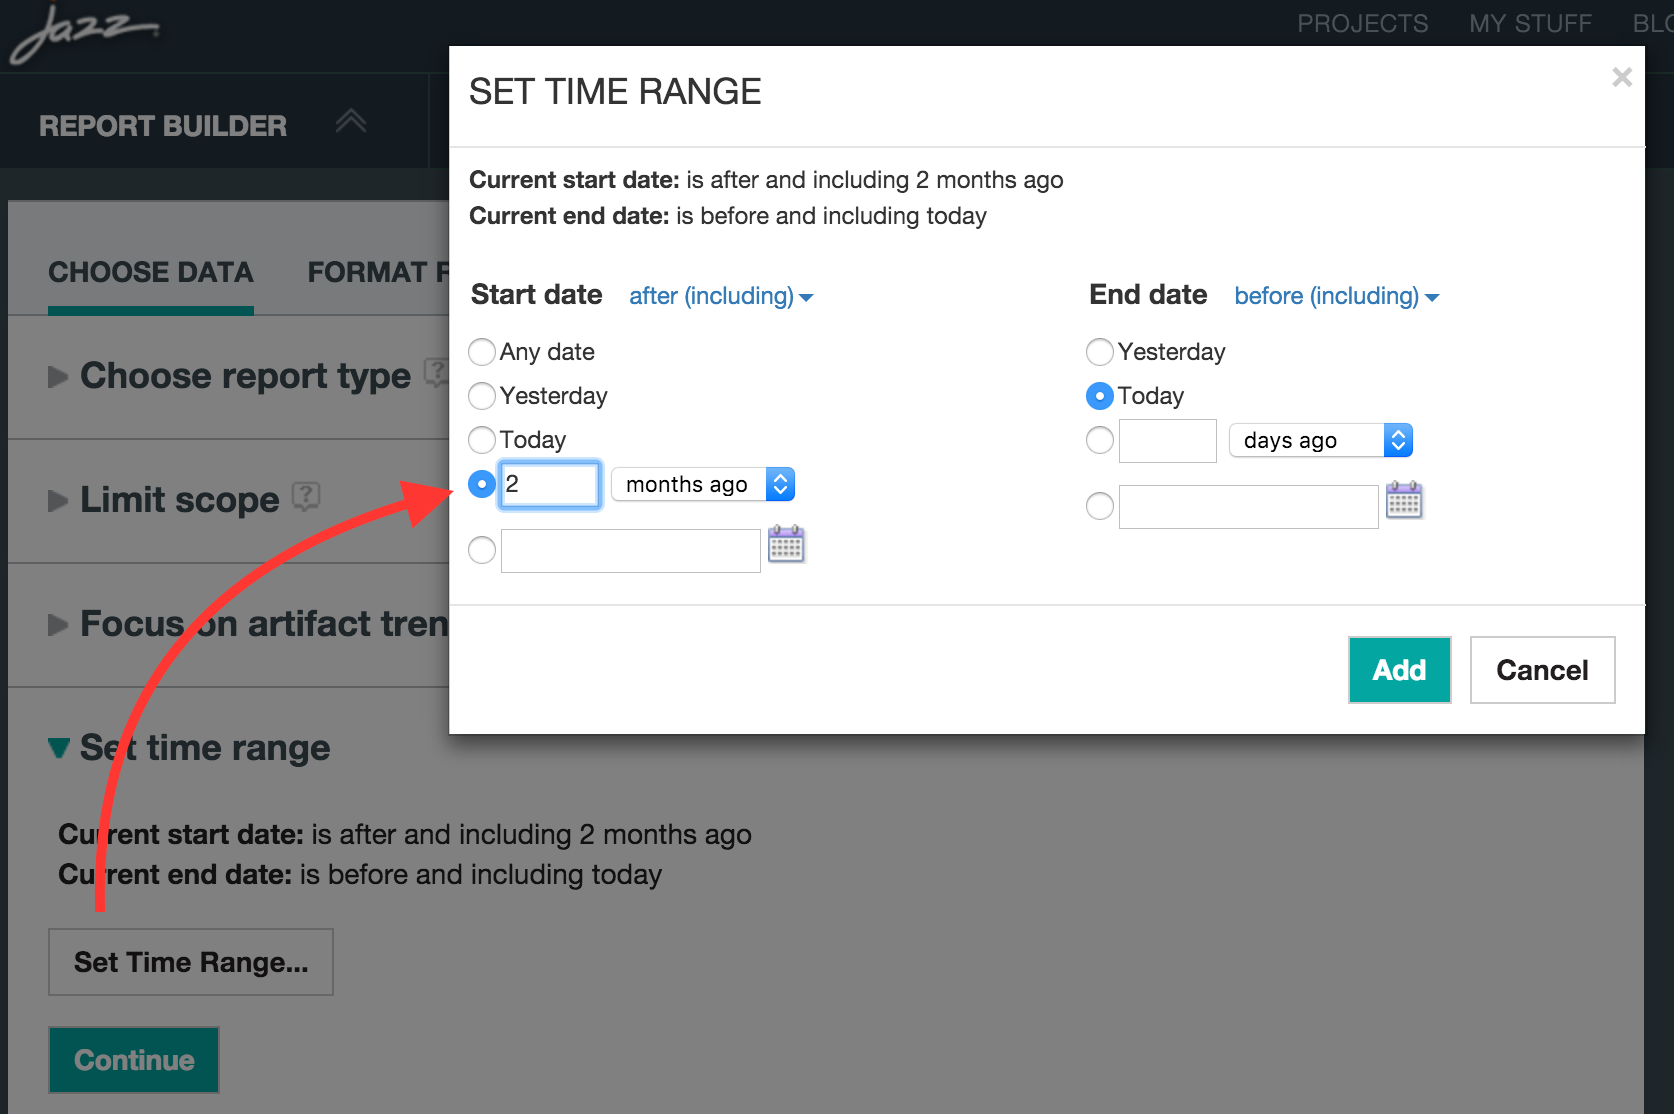
It’s also possible to set specific dates using the Calendar drop-down or set an End date to a relative date in the past (i.e. 14 days ago). You’ll notice under Conditions that you now see new conditions for Start date and End date after you set the time range, and you can change them here, too.
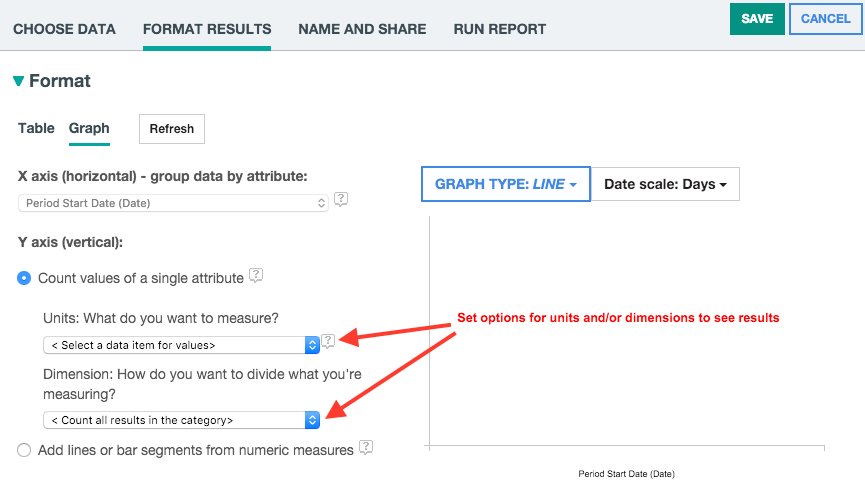
Continuing on to Format results, you’ll notice the default is a graph presentation. Historical trend reports are typically shown as a line graph, but you can also use a bar chart (stacked or grouped).
In the graph section you need to select the unit to measure: the total count of the related artifact (work items) or some other criteria that was captured in the metrics artifact. You can also select a dimension to separate the value being measured by all the values of the dimension, such as Status, Filed Against and so on. Before you can preview a graph, you must select a value for the unit of measure, and optionally, the dimension.
After you select Total Work Items for the unit of measure and Status Group Category for the dimension, the graph should look something like this:
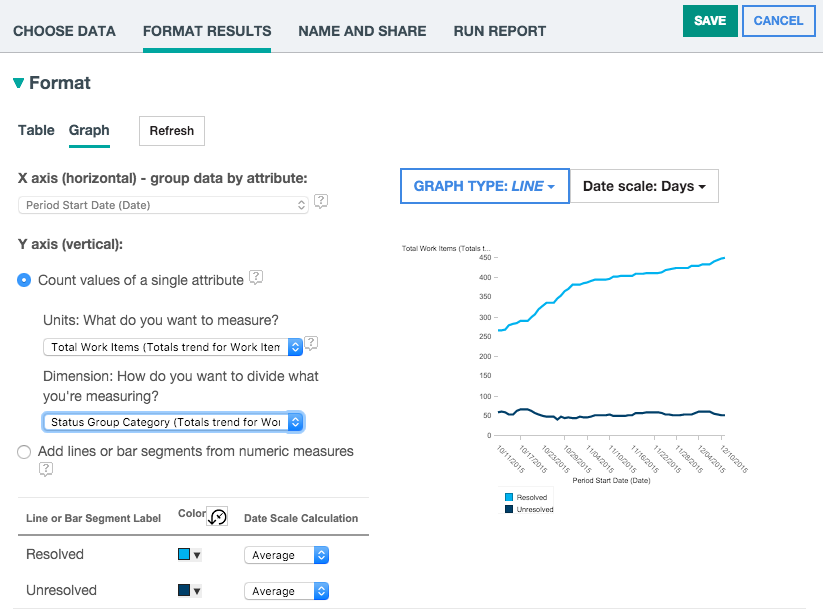
Then you can modify the line colours, change the date scale to weeks or months or alternatively, view the data in a bar chart. Now the report is done, and you can save and publish it to a dashboard like any other report created by the Report Builder.
Multiple historical trends
The ability to report on a historical trend capability is based on selecting a specific trend, such as creation or totals, and seeing its change over time. The artifact type and trends are organized hierarchically, you can look for the artifacts you want to report on and expand to see what trends are available.
Many different trends are stored in the data warehouse as part of the data mart / fact collection process in the Data Collection Component (DCC). For instance, work items have trends for discovering creation rates, general totals, and resolution rates. Now you can visualize more then one trend on a graph so you can compare them. You can select more than one trend in the Focus on artifact trends section:

Setting the time range is the same as is the single trend scenario. The time range will be effective for all selected trends.
Setting Conditions
Setting conditions that restrict or constrain the data is identical to how you would do this for a current data report (i.e. on a Work Item). Though the set of attributes available is limited to a specific set that were captured in the trend table. One limitation is that custom attributes are not available on the trend artifacts as well as some other standard attributes (Tags).
To add conditions, launch the conditions dialog and select the trend you want to add a condition for, followed by choosing an attribute and which values to constrain it to. For instance if we want to constrain our report to a particular release and for defects only, then we need to add Planned For and Type conditions for each trend we’ve selected (i.e. Creation, Resolution and Totals). After doing this, our Set conditions pane should look something like this:

Then we need to consider if there are any special considerations we need to make on each trend (see appendix for details). As an example, when considering total work items, we are probably only interested in currently open ones. Especially considering we’re looking at the resolution trends at the same time. We can add this by selecting the Totals trend for Work Item in the Attributes of drop down in the condition dialog and selecting the Status Group Category attribute and constraining it to unresolved.
The Resolution trend captures metrics around total number of resolved and closed Work Items on a given day. Consequently if we’re only interested in straight resolutions and not closures then we need to add an additional condition there on the State attribute to check only for resolved. Creation trend captures all Work Items created on a certain day so no special considerations need to done there.
Limiting or excluding trend dates
For trend reporting, you can select a date range to restrict the results. However you might want to restrict the result further by only allowing work days (i.e. Monday to Friday) or specific months or quarters of the year. You can do this when adding a condition by selecting the Date artifact type.
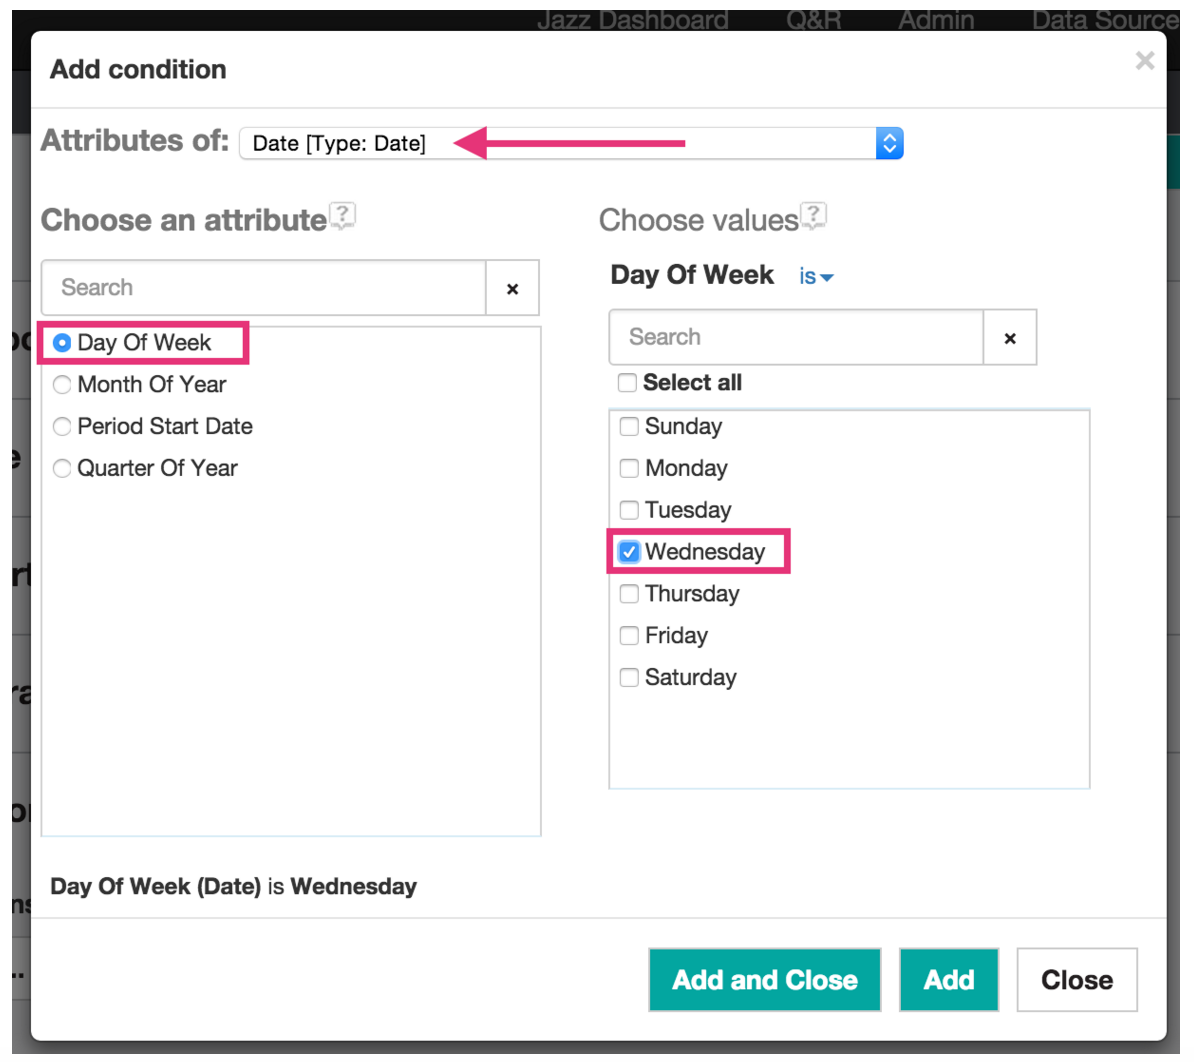
This ability could be most useful for improving report performance by reducing the results to a specific day of the week. If you’re examining a long date range, you can pick a specific day of the week to draw the trend from (such as Wednesday), significantly reducing the number of results the query and chart engine have to process while providing the same trending information.
Adding a condition on the Date artifact affects all the trends though. This might not be desirable if you need to accumulate trend values over the course of a period of time though. Especially if the trend captures some sort of daily value that may vary from day to day. In our example, we have one trend that captures a consistent snapshot – Totals. The total from one day to the next is stand-alone and doesn’t depend on the previous day. It can be compared to a total from the previous week if desired. So adding a Day of Week condition makes sense. For other trends such as creation or resolution, the metrics in these trends are a daily total – i.e. How many work items were created or resolved on a specific day. If you want to see a weekly trend total for these you can’t exclude any particular days from the result. So to add a Day of Week date condition on a particular trend, we need to select the trend in question and look for the Day of Week attribute.
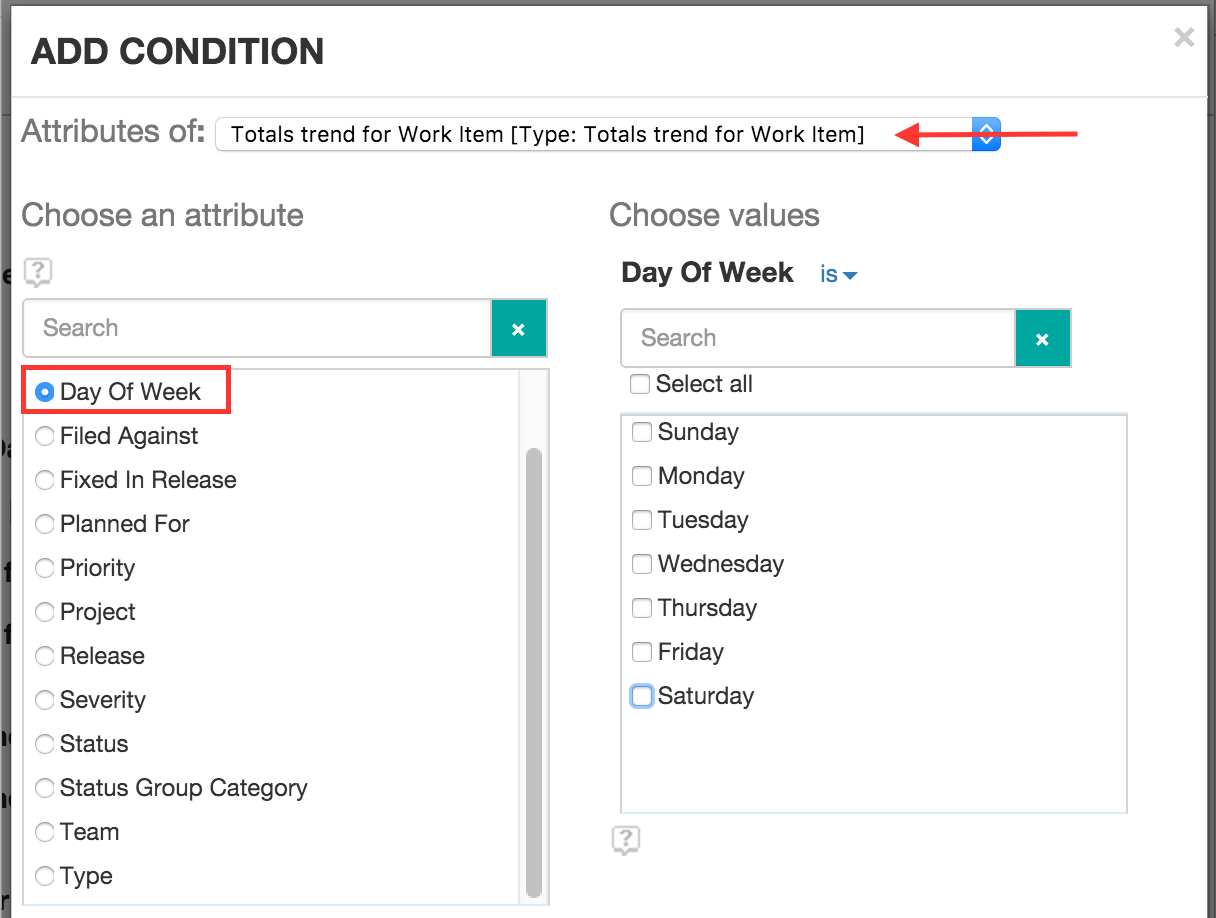
Now we can constrain only that particular trend to one or more days of the week without affecting the other trends data.
Formatting the trend data
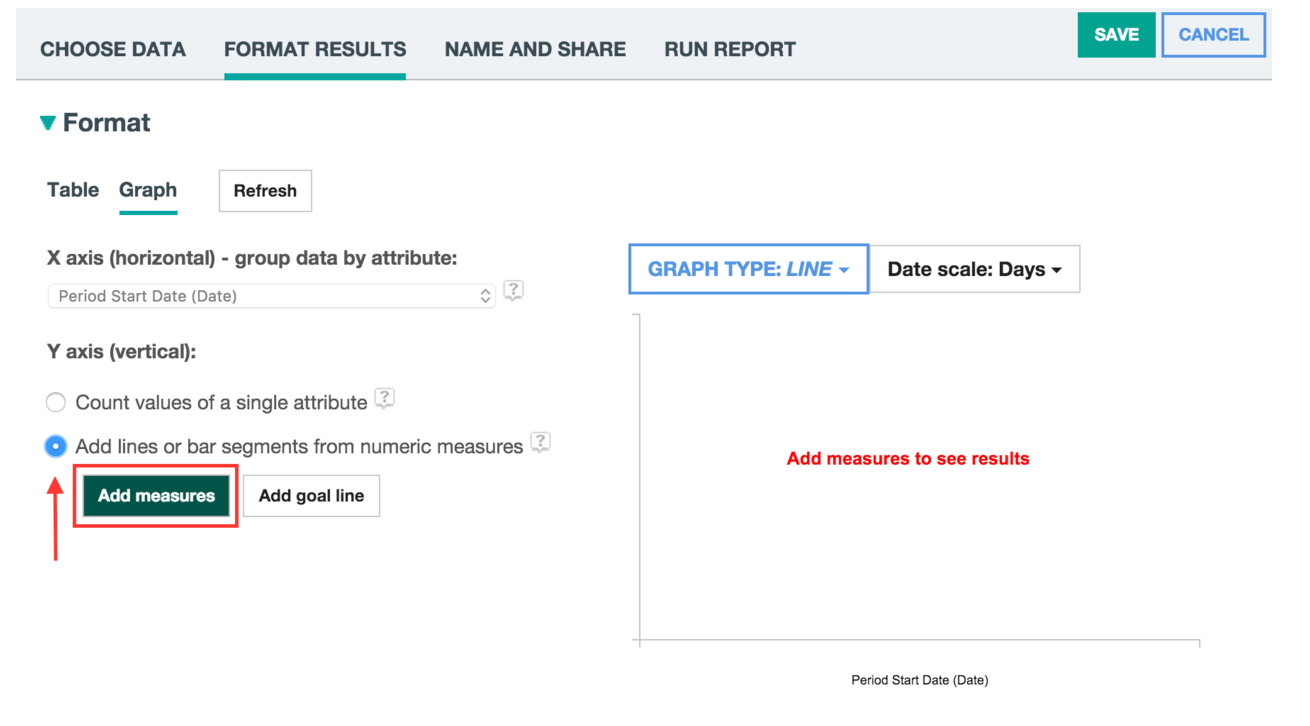
Then, in the Format Results section, since we want to visualize multiple measures, you select the radio button to add lines or bar segments based on numeric measures. This allows selection of more then one measure from one or more trends. Each of the selected measures can be displayed as a line or a bar segment, depending on which graph type you are using.
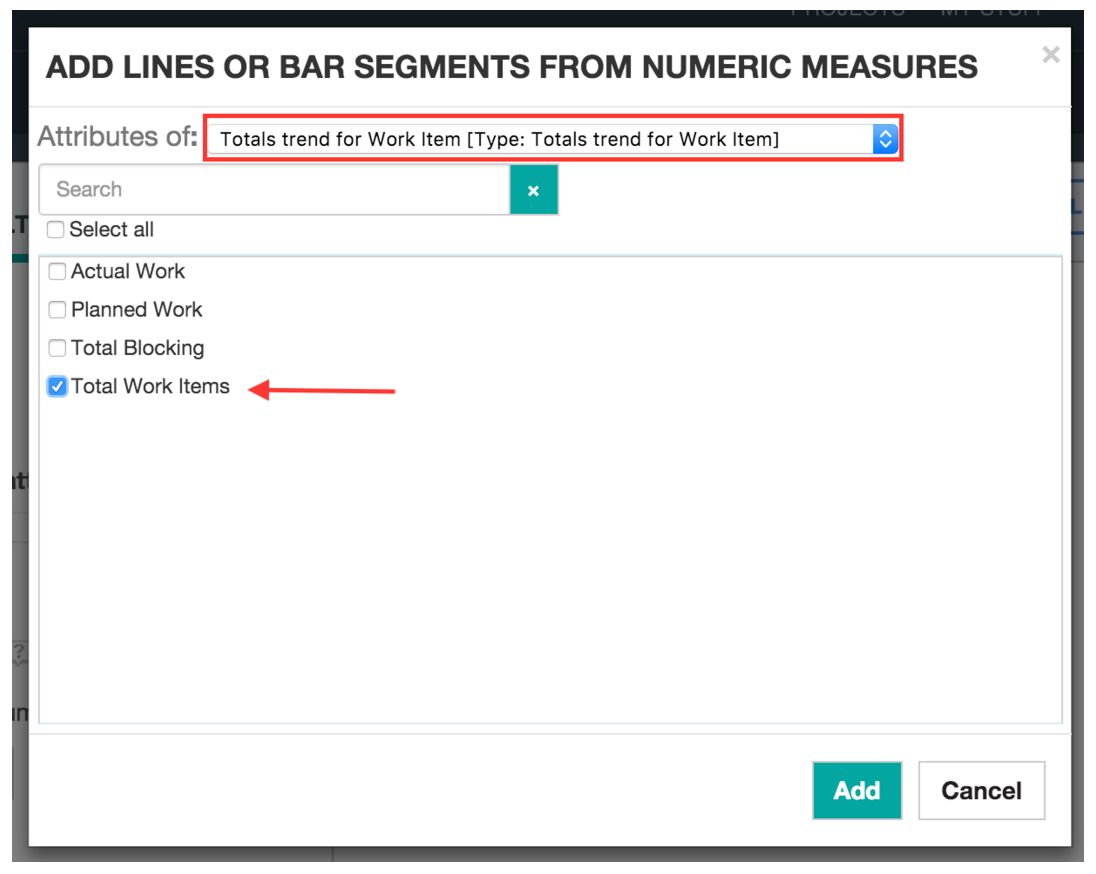
After you click Add measures you can choose an available trend and pick a measure to visualize in the graph. In this case you are interested in the Total Work Items measure that provides a count of all work items filtered by conditions you’ve added previously on the Choose Data tab. You can add multiple measures at one time by flipping between the different trends in the Attributes of drop down. For this example flip to the resolution and creation trends and select the Total measure for each of them.
After you choose the measures, the graph preview is generated with a line representing each measure. You can also choose the type of graph and the data scale (such as Weeks or Months) for the X axis. In this example we will change the date scale to be Weeks and modify the graph type to use Grouped Bar so we can easily differentiate and compare the measures on a week to week basis.
You might also want to decide how the data is gathered within the date scale period. the default is to average all of the data points discovered within the date scale range. You can also sum all the date points or consider only the first or last data points. In this example you want to sum all the created and resolved work items totals for the week since we want a total for them by week. For the Total Work Items measure we can leave it as is since we’ve already filtered it in the Conditions pane to a single day of the week. As such, the calculation is irrelevant for it since there will only ever be one value in each week interval to consider.
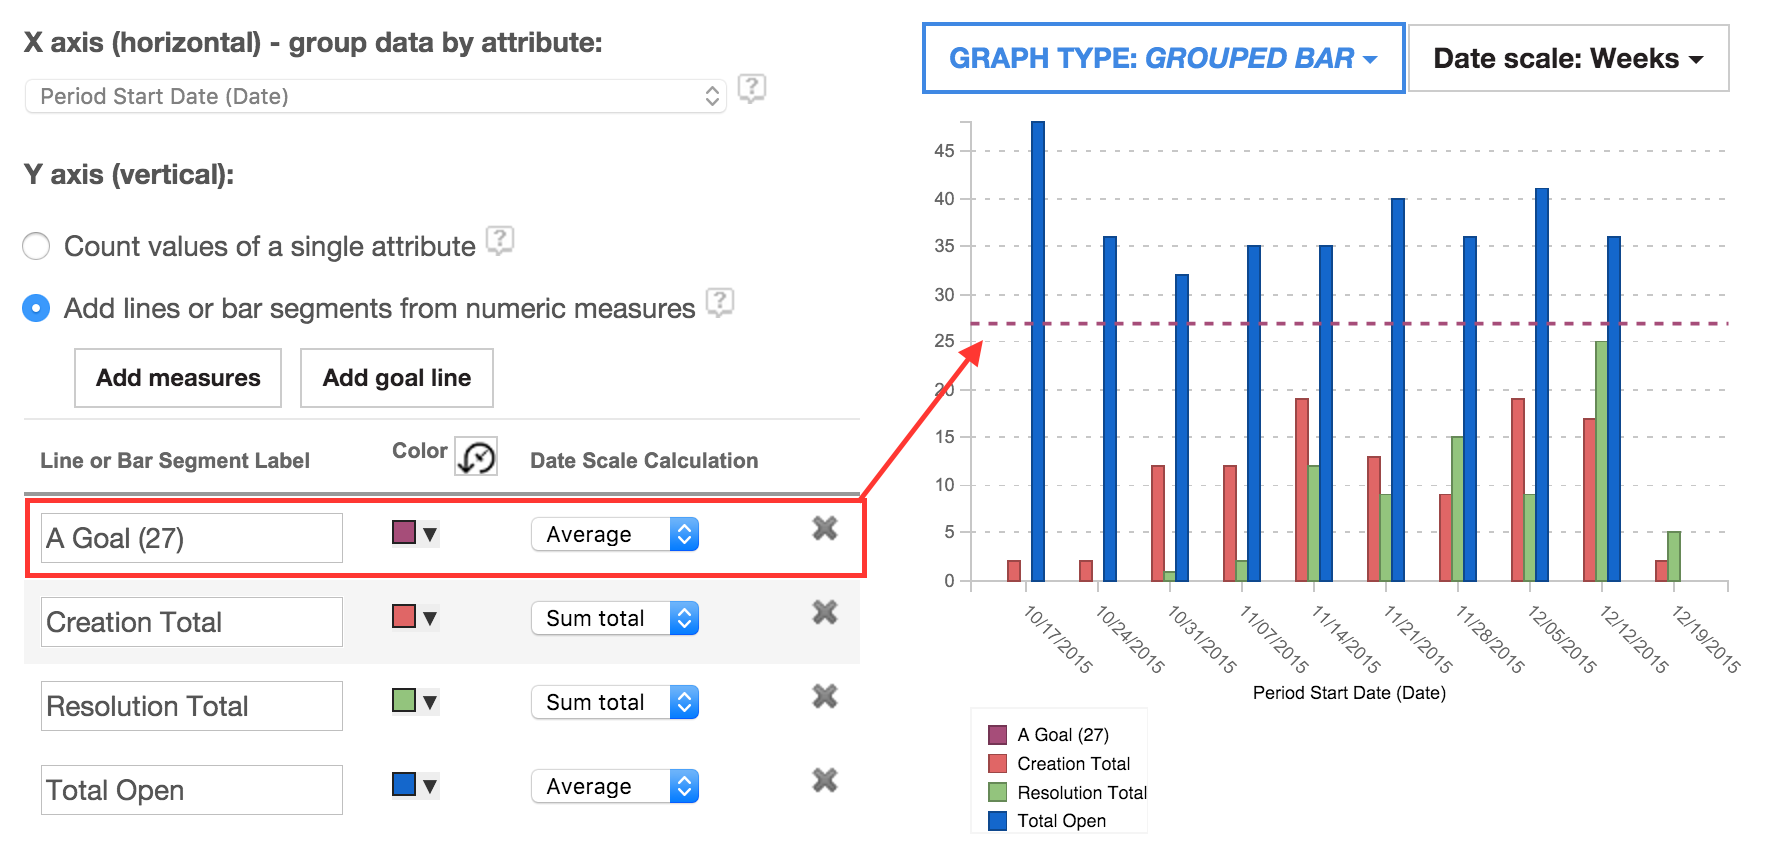
To polish the results, you may want to modify the default colors to something specific or make certain lines stand out versus the others. A drop-down control in a table underneath the Add measures button allows the color of an individual line or bar to be changed to a pre-defined color or you can even pick a particular RGB value. It is also possible to rename the legend entries to be more concise or consistent with the other entires. In the example we’ve changed the colors to red, green and blue and modified the labels to be more readable.

Set a Goal line
If you want to track a trend to a particular goal, click Add goal line. A dialog box opens so you can select a particular value.
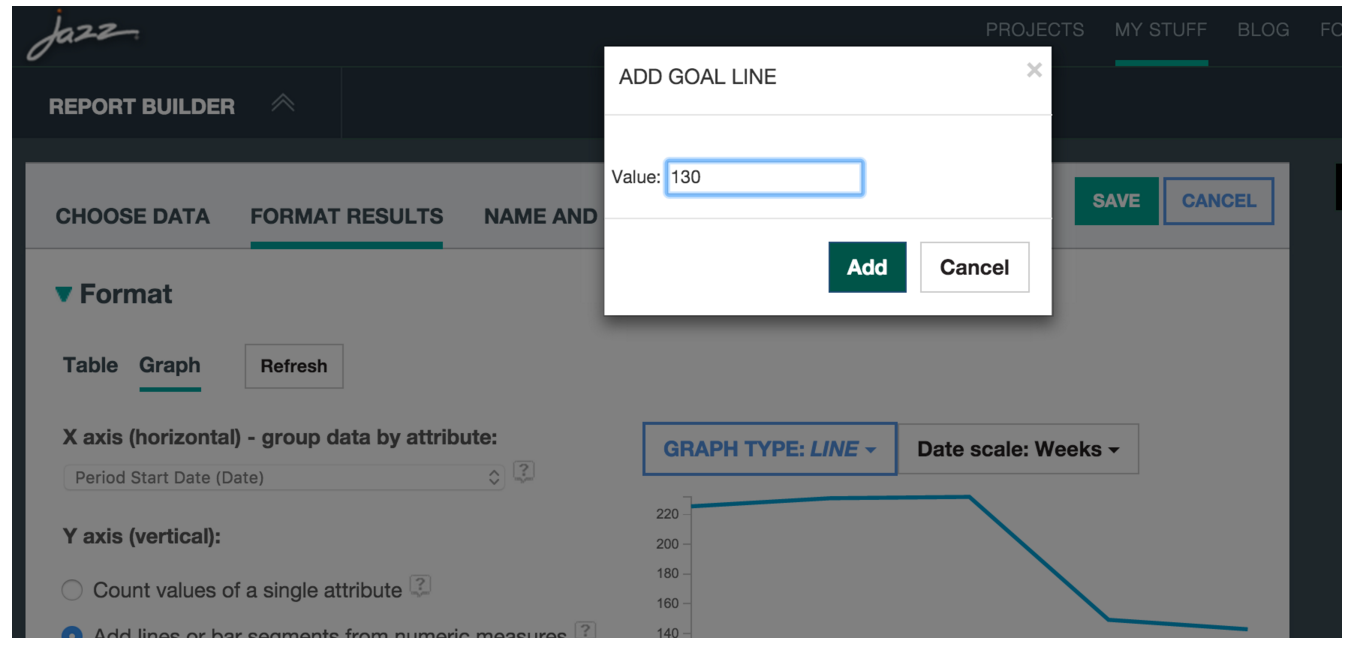
Your value will display as a horizontal dotted line in your graph. You can change its color and add additional goal lines by repeating the process. The legend is sorted alphabetically right now so if you want to adjust the order of an entry you’ll need to change it’s label accordingly. In the example, we’ve modified the label of the goal line to be “A Goal (27)” so that it appears first in the legend.
Validation for historical trend reports
Historical trend reports query against a vast set of data and potentially across multiple project areas. Some reports can take a long time to run if they are not filtered to a smaller subset of data. To make this easier, we have added validation to ensure that some constraints are in place to increase performance.
A time range is mandatory when creating trend reports. Although an infinite range is still possible, it is better to set a range within a specific time frame. You cannot format the results until you enter a time range.
The graph must include a value for the unit of measure. Again, this helps the report generation optimize the set of tables to query against.
You get a warning when you save if no conditions and project scoping are set. It is advisable to set some scoping to narrow down the results, such as work items with conditions on the Release (Planned for) and / or category (Filed Against) fields.
Appendix
Change and Configuration Trend Details
Artifact – Trend | Description | Data Warehouse Table | Measure (Metric) | Measure Description |
Work Item – Aging | Stores trends related to the age of how long work items were in a particular state. The information stored on this table makes sense only when viewed by State dimension. For instance, the total SUM of “Total Work Items” won’t produce the total number of work items, it will be a greater number since every request-state pair is counted individually. | RIDW.F_REQUEST_AGING
| Total Work Items
| When summarized by state, it will show the total of work items that are or have ever been on that particular state.
|
|
|
| State Min | The minimum number of days that work items were in a particular state. Best to view this for a particular State or separate by State dimension. |
|
|
| State Max | The maximum number of days that work items were in a particular state. Best to view this for a particular State or separate by State dimension. |
|
|
| State Total Days | Total accumulated number of days that work items were in a state on a particular day. Best to view this for a particular State or separate by State dimension. |
Work Item – Closure | Trend of number of work item closures that occurred on a particular day. | RIDW.F_REQUEST_CLOSURE_DATE_METRICS
| Total Count | Total count of work item closures that occurred on a particular day. |
Work Item – Creation | Trend of number of work item creations that occurred on a particular day. | RIDW.F_REQUEST_CREATION_DT_METRICS
| Total Count | Total count of work item creations that occurred on a particular day. |
|
|
| Story Points | FUTURE – not populated |
|
|
| Planned Duration | FUTURE – not populated |
|
|
| Actual Duration | FUTURE – not populated |
Work Item – Failure | Stores trends related to work items of type ‘Defect’ that were resolved but reopen later.
| RIDW.F_REQUEST_FAILURE_METRICS
| Total Re Failed
| Total number of work items that were reopened.
|
Work Item – Release totals | Stores trends related to number of work items created before or after the release date. | RIDW.F_RELEASE_REQUEST_METRICS
| Total Pre Release Work Items
| Total number of work items created before the release date.
|
|
|
| Total Work | FUTURE – not populated |
|
|
| Total Post Release Work Items | Total number of work items created after the release date. |
Work Item – Release Turnaround | Stores trends related to number of work items that have been resolved (i.e. Status is “Resolved” or “Closed”) and that were created before or after the release date. | RIDW.F_REL_REQUEST_TURN_METRICS
| Post Total Days
| For work items created after release date, total number of days between the date the work item was created and the date the work item was marked as resolved. |
|
|
| Pre Total Days | For work items created before release date, total number of days between the date the work item was created and the date the work item was marked as resolved. |
|
|
| Post Total Work Items | Total number of work items created after the release date. |
|
|
| Pre Total Work
| Total number of work items created before the release date. |
|
|
| Post Max Days | For work items created after release date, maximum number of days between the date the work item was created and the date the work item was marked as resolved. |
|
|
| Pre Max Days
| For work items created before release date, maximum number of days between the date the work item was created and the date the work item was marked as resolved. |
|
|
| Post Min Days
| For work items created after release date, minimum number of days between the date the work item was created and the date the work item was marked as resolved. |
|
|
| Pre Min Days
| For work items created before release date, minimum number of days between the date the work item was created and the date the work item was marked as resolved. |
Work Item – Resolution | Trend of number of work item resolutions that occurred on a particular day.
| RIDW.F_REQUEST_RESOLUTIO_DT_METRICS
| Story Points
| FUTURE – not populated |
|
|
| Total Count | Total count of work item resolutions that occurred on a particular day. |
|
|
| Actual Duration | FUTURE – not populated |
|
|
| Planned Duration | FUTURE – not populated |
Work Item – Totals | Trend of work item totals for a particular day. | RIDW.F_REQUEST_METRICS | Total Work Items
| Total number of work items that exist in the repository on a particular day. |
|
|
| Actual Work | Total accumulation of actual work values that exist in the repository on a particular day. |
|
|
| Total Blocking | Total number of blocking work items that exist in the repository on a particular day. |
|
|
| Planned Work | Total accumulation of planned work values that exist in the repository on a particular day. |
Work Item – Turnaround | Stores trends related to work items that were on status ‘Open’ or ‘InProgress’ and where marked as ‘Resolved’ or ‘Closed’ at a later date. | RIDW.F_REQUEST_TURNAROUND
| Turnaround Min
| Minimum number of days it took a work item to change from ‘Open’ or ‘InProgress’ to ‘Resolved’ or ‘Closed’. |
|
|
| Turnaround Max
| Maximum number of days it took a work item to change from ‘Open’ or ‘InProgress’ to ‘Resolved’ or ‘Closed’. |
|
|
| Total Work Items | Total number of work items that were initially open and were closed at a later date. |
|
|
| Total Days | Total accumulated number of days it took work items to change from ‘Open’ or ‘InProgress’ to ‘Resolved’ or ‘Closed’. |
Work Item with Requirement – Resolution | Stores trend of number of work items per requirement that were resolved on a particular date. | RIDW.F_REQUEST_RES_REQUI_DT_METRICS | Actual Duration | FUTURE – not populated |
|
|
| Planned Duration | FUTURE – not populated |
|
|
| Story Points | FUTURE – not populated |
|
|
| Total Count | Total number of work items resolved per requirement (and the other dimensions) |
Work Item with Test Plan – Resolution | Stores trend of number of work items per test plan that were resolved on a particular date. | RIDW.F_REQUEST_RES_TPLN_DT_METRICS | Actual Duration | FUTURE – not populated |
|
|
| Planned Duration | FUTURE – not populated |
|
|
| Story Points | FUTURE – not populated |
|
|
| Total Count | Total number of work items resolved per test plan (and the other dimensions) |
Build Totals | DEPRECATED for Report Builder – do not use. | RIDW.F_BUILD_EXECUTION_DT_METRICS |
|
|
Build Totals | Stores trend of total number of builds. | RIDW.F_BUILD_METRICS | Total Attempts | Total number of build attempts that occurred on a particular day. |
|
|
| Total Failed | Total number of failed build attempts that occurred on a particular day.
|
|
|
| Total Passed | Total number of passed build attempts that occurred on a particular day. |
Quality Management Trend Details
Artifact – Trend | Description | Data Warehouse Table | Measure (Metric) | Measure Description |
Test Case – Project totals | Trend of Test Case totals per Project (and the other dimensions) | RIDW.F_PROJ_TESTCASE_METRICS
| Total Test Cases
| Total number of Test Cases per Project (and the other dimensions)
|
Test Case – Totals | Trend of Test Case totals per Test Plan (and other dimensions) on a particular day. (Note: A test case can be linked to more than one test plan) | RIDW.F_TESTCASE_METRICS | Total Test Cases | Total number of Test Case items that exist in the repository on a particular day. |
Test Case Result – Iteration totals | Trend of Test Case Execution Result totals per Iteration (and the other dimensions) on a particular day. | RIDW.F_EXECUTION_RES_ITER_METRICS | Total Test Case Results | Total number of Test Case Execution Result totals per Iteration (and the other dimensions) on a particular day. |
Test Case Result – Totals | Trend of Test Case Result totals on a particular day. | RIDW.F_EXECUTION_RESULT_METRICS | Total Test Case Results | Total number of Test Case Result items that exist in the repository on a particular day. |
Test Plan with Test Case – Project totals | Exactly the same as Test Case – Project totals. Trend of Test Case totals per Test Plan (and other dimensions) on a particular day. (Note: A test case can be linked to more than one test plan) | RIDW.F_PROJ_TESTCASE_TPLN_METRICS
| Total Test Cases
| Total number of Test Case items that exist in the repository on a particular day.
|
Test Execution Record – Totals | Trend of Test Execution Record totals on a particular day. | RIDW.F_EXECUTION_WORKITEM_METRICS
| Total Test Case Execution Record
| Total number of Test Execution Record items that exist in the repository on a particular day.
|
Requirements Management Trend Details
Artifact – Trend | Description | Data Warehouse Table | Measure (Metric) | Measure Description |
Requirement – Totals | Trend of Requirement totals on a particular day. | RIDW.F_REQUIREMENT_METRICS
| Total Requirements
| Total number of Requirement items that exist in the repository on a particular day.
|
|
|
| Total Changes | Total number of revisions. |
Requirement with Test Plan – Totals | Trend of Requirement totals per associated Test Plan on a particular day. | RIDW.F_REQUIREMENT_TPLN_METRICS
| Total Requirements
| Total number of Requirements per associated Test Plan that exist in the repository on a particular day.
|
|
|
| Total Changes | Total number of revisions. |
Copyright © 2016 – IBM Corporation