Reporting Service (JRS): Is there a way to group filed againsts on a graph?
I have 5 categories with 10+ sub categories underneath each of them.
I want a graph that shows all the defects in the 5 categories(I want them to include all the defects inside their subcategories).
If i select filed against "is" then I dont get anything in their subcategories.
If I select "is in subtree" then the graph displays each category individually so instead of 5 bars, I get 50+ bars.
Does anyone know how to do this? I'm using 6.0.1.
It seems like it would be simple to do, but maybe I'm overlooking something.
My end goal is to display a "grouped bar" of those 5 categories which display closed defects by month.
I seem to be a long way from that, but any help would be appreciated.
Accepted answer
Hello Daniel,

I think the way to do this would be by using calculated columns.
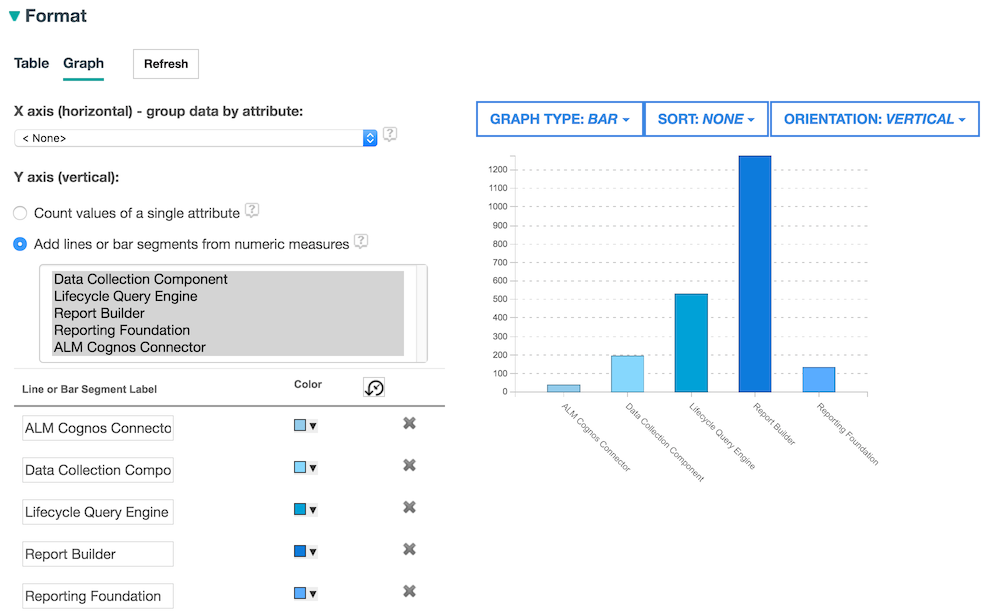
In format results, click "Add Calculated Column", then Count with a limit of Filed Against and one of the top categories you want to visualize. In addition select the "is in subtree" operator. Repeat this for each of the top categories you want to visualize. In the end you should have 5 calculated columns. You may want to rename the column labels to more specific.
Next click on the Graph tab and then click on the "Add lines or bar segments from numeric measures". Ensure all 5 of your calculated columns are selected. Then you can further group them by Project or choose "None" for the X-axis if you just want to visualize them individually.
See snap shot below of what this would look in the Graph section -->
