CLM Monitor 6.0.2 Not Capturing CPU & System Load Correctly.
I have setup the CLM Monitor 6.0.2 on Liberty server. I have connected the CSM Agent using JMX Localconnection not the IBM Rest Connection.
I have noticed that the PercentCPU is not being updated correctly in problem activities. I have had heavy usage and the CPU is sometimes more than 80% However, the problem records with PercentCPU enumerations are not being updated correctly.
Anyone else experiencing this?
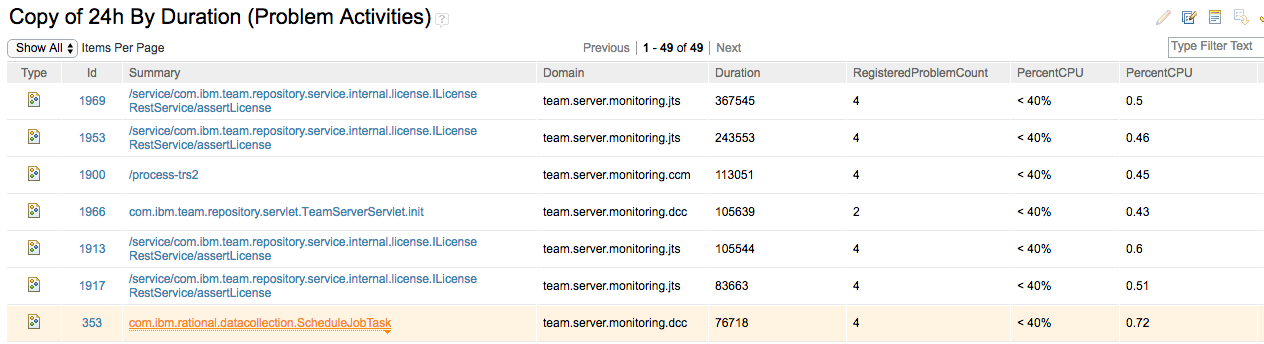
The OOTB report is using percentCPU as a number like, 90. But the field data in a decimal like this, .40. So the query, 24h By Duration (Problem Activities) or Past Hour By Duration (Problem Activities) never work. I have to change the query to use percentCPU as a decimal and then the query generates correct data.
I have an example of an activity record where the PercentCPU Enumeration is < 40%, but the decimal PercentCPU is > 40%. I think when the data is pulled in it is not assigning the correct enumuration and thus my OOTB queries are not working.
Comments
Robert Carter
May 11 '16, 2:17 p.m.I noticed the "System Load" is also effected by this as well. I created a series of queries to mimic the enumerated values of PercentCPU and SystemCPULoad. I tried to use the bulk edit feature int he query to update those enumerated fields, but it is not letting me change those values.
Ralph Schoon
FORUM ADMINISTRATOR / FORUM MODERATOR / JAZZ DEVELOPER May 13 '16, 4:49 a.m.I fail to see the question that is asked here.
Robert Carter
May 13 '16, 9:16 a.m.The CLM Server Monitor is not correctly reporting PercentCPU in the problem records. All records are have PercentCPU as < 40% CP utilization.
Ralph Schoon
FORUM ADMINISTRATOR / FORUM MODERATOR / JAZZ DEVELOPER May 13 '16, 9:22 a.m.But why is this a question in the Forum? Consider writing a PMR for support.
Robert Carter
May 13 '16, 9:21 a.m.I am asking to see if anyone else has this problem. Or maybe I did something wrong with my configuration of CLM Monitor. I will consider adding this as a PMR as well.
Ralph Schoon
FORUM ADMINISTRATOR / FORUM MODERATOR / JAZZ DEVELOPER May 13 '16, 9:26 a.m.In that case, please edit your post subject and/or body and add the question part.
Robert Carter
May 13 '16, 9:33 a.m.I have created a ticket here: