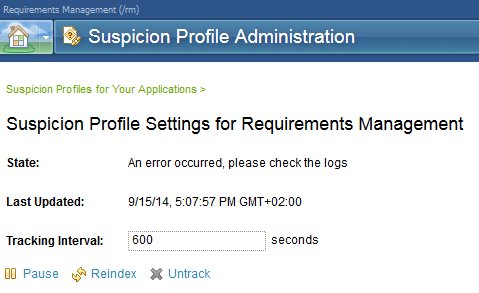
suspicion profile status directs to an error in rm.log / CutoffEventNotFoundException
When navigating to https://server.company.com/rm/suspect
The chapter Requirements Management (/rm) offers a "Manage Settings" sub-page with the status "An error occurred, please check the logs": (see attached screenshot)
The rm.log has only this entry in the questionable time frame:
How can I fix this error?
best regards
Danny
The chapter Requirements Management (/rm) offers a "Manage Settings" sub-page with the status "An error occurred, please check the logs": (see attached screenshot)
The rm.log has only this entry in the questionable time frame:
2014-09-15 16:37:43,813 [ Thread-93] ERROR ices.suspectlinks.indexer.internal.ChangeLogClient - An error occurred, please check the logs
com.ibm.rdm.fronting.server.services.suspectlinks.indexer.exceptions.internal.CutoffEventNotFoundException: The cutoff event 'urn:uuid:bd6269d4-7b94-4482-a4de-5040eb8ba8c9' was not found. A reindex should be performed.
at com.ibm.rdm.fronting.server.services.suspectlinks.indexer.model.internal.TrackedResourceSet.getChangeLogEntriesSince(TrackedResourceSet.java:108)
at com.ibm.rdm.fronting.server.services.suspectlinks.indexer.internal.ChangeLogClient$ChangeLogTask.rebuildIndex(ChangeLogClient.java:257)
at com.ibm.rdm.fronting.server.services.suspectlinks.indexer.internal.ChangeLogClient$ChangeLogTask.run(ChangeLogClient.java:163)
at java.util.concurrent.Executors$RunnableAdapter.call(Executors.java:450)
at java.util.concurrent.FutureTask$Sync.innerRunAndReset(FutureTask.java:328)
at java.util.concurrent.FutureTask.runAndReset(FutureTask.java:161)
at java.util.concurrent.ScheduledThreadPoolExecutor$ScheduledFutureTask.access$101(ScheduledThreadPoolExecutor.java:109)
at java.util.concurrent.ScheduledThreadPoolExecutor$ScheduledFutureTask.runPeriodic(ScheduledThreadPoolExecutor.java:191)
at java.util.concurrent.ScheduledThreadPoolExecutor$ScheduledFutureTask.run(ScheduledThreadPoolExecutor.java:215)
at java.util.concurrent.ThreadPoolExecutor$Worker.runTask(ThreadPoolExecutor.java:906)
at java.util.concurrent.ThreadPoolExecutor$Worker.run(ThreadPoolExecutor.java:929)
at java.lang.Thread.run(Thread.java:796)The suggested re-indexing does not solve the issue.
How can I fix this error?
best regards
Danny
Comments
Donald Nong
Sep 15 '14, 8:43 p.m.After you did the "reindex" (the middle icon in your screen shot), did the "cutoff event" uuid in the error message change? If the problem persists, you should contact Support to open a ticket.
Danny Müller
Sep 16 '14, 3:11 a.m.The cutoff event uuid stays the same. The error is logged roughly each time the "tracking Interval" is over.
I'll open a PMR now.