Introduction
This report compares the performance of an unclustered Rational Team Concert version 4.0.5 deployment to the previous 4.0.4 release. The test objective is achieved in three steps:
- Run 4.0.5 GA (build CALM-I20131107-2230) with standard 4-hour test
- Run 4.0.4 GA with standard 4-hour test
- Compare the results and file any defects observed.
Disclaimer
The information in this document is distributed AS IS. The use of this information or the implementation of any of these techniques is a customer responsibility and depends on the customers ability to evaluate and integrate them into the customers operational environment. While each item may have been reviewed by IBM for accuracy in a specific situation, there is no guarantee that the same or similar results will be obtained elsewhere. Customers attempting to adapt these techniques to their own environments do so at their own risk. Any pointers in this publication to external Web sites are provided for convenience only and do not in any manner serve as an endorsement of these Web sites. Any performance data contained in this document was determined in a controlled environment, and therefore, the results that may be obtained in other operating environments may vary significantly. Users of this document should verify the applicable data for their specific environment.
Performance is based on measurements and projections using standard IBM benchmarks in a controlled environment. The actual throughput or performance that any user will experience will vary depending upon many factors, including considerations such as the amount of multi-programming in the users job stream, the I/O configuration, the storage configuration, and the workload processed. Therefore, no assurance can be given that an individual user will achieve results similar to those stated here.
This testing was done as a way to compare and characterize the differences in performance between different versions of the product. The results shown here should thus be looked at as a comparison of the contrasting performance between different versions, and not as an absolute benchmark of performance.
What our tests measure
We use predominantly automated tooling such as Rational Performance Tester (RPT) to simulate a workload normally generated by client software such as the Eclipse client or web browsers. All response times listed are those measured by our automated tooling and not a client.
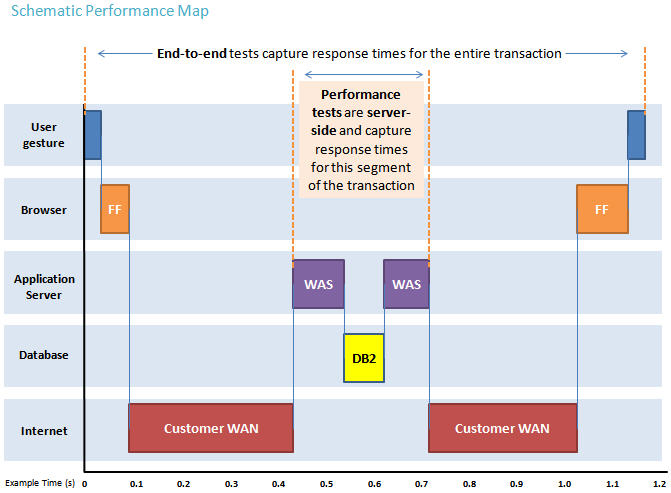
The diagram below describes at a very high level which aspects of the entire end-to-end experience (human end-user to server and back again) that our performance tests simulate. The tests described in this article simulate a segment of the end-to-end transaction as indicated in the middle of the diagram. Performance tests are server-side and capture response times for this segment of the transaction.
Findings
Performance goals
- Verify that there are no performance regressions between current release and prior release with 1100/1200 concurrent users using the workload described below.
Findings
- RPT reports show similar throughput (completed tasks) for 4.0.5 GA and 4.0.4 GA
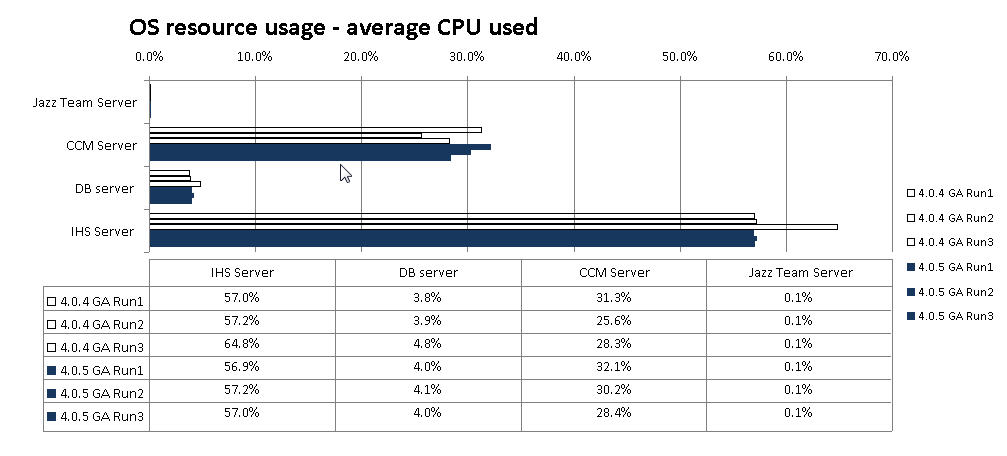
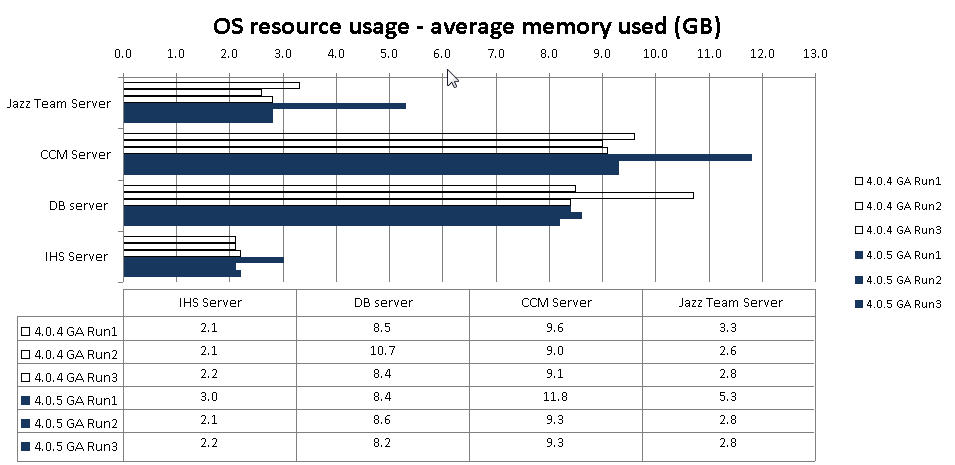
- Comparing nmon data for both 4.0.5 GA and 4.0.4 GA show similar memory and disk utilization on application server. CPU utilization is mildly higher in 4.0.5 GA due to known issues in the Java 1.6 that is supported with WAS 8.5.5.0. CPU utilization shows much improvement when 4.0.5 GA is tested under pre-released version of Java 1.7 available for internal testing within IBM only.
Topology
The topology under test is based on Standard Topology (E1)
https://jazz.net/library/article/820#Enterprise_Distributed_Linux__DB2
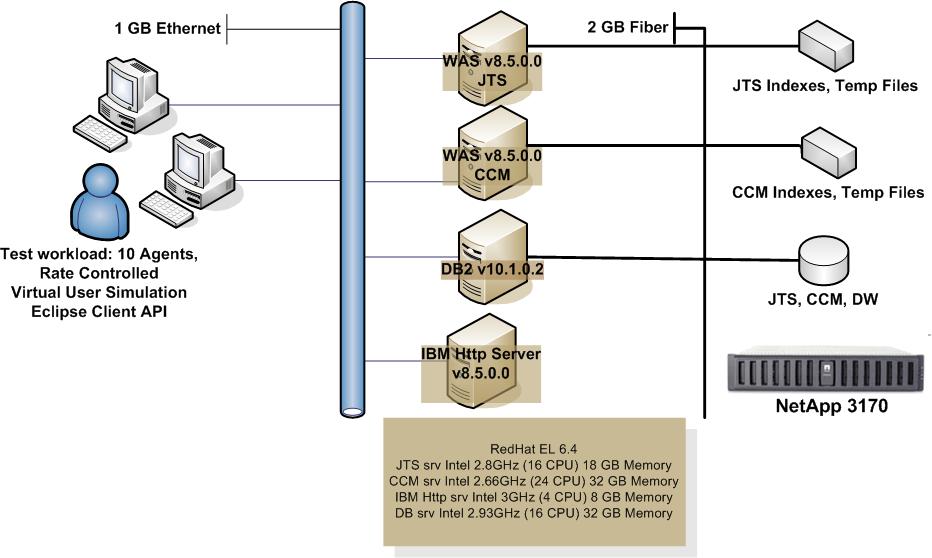
The specifications of machines under test are listed in the table below. Server tuning details listed in
Appendix A
|
Function |
Number of Machines |
Machine Type |
CPU / Machine |
Total # of CPU Cores/Machine |
Memory/Machine |
Disk |
Disk capacity |
Network interface |
OS and Version |
| JTS Application Server |
1 |
Intel Tylersburg (Loaner) |
2 x Intel® Xeon® X5560 CPUs (4-Core 2.8 GHz 64-bit) |
4 |
18 GB |
SATA |
450 GB |
Gigabit Ethernet |
Red Hat Linux 6.4 64-bit |
| CCM Application Server |
1 |
Intel |
4 x Intel® CPUs (6-Core 2.66 GHz 64-bit) |
6 |
32GB |
SATA |
150GB |
Gigabit Ethernet |
Red Hat Linux 6.4 64-bit |
| IBM HTTP Server 8.5.5.0 |
1 |
Intel |
2 x Intel® Xeon® CPUs (2-Core 3.0 GHz 64-bit) |
2 |
8 GB |
SATA |
300 GB |
Gigabit Ethernet |
Red Hat Linux 6.4 64-bit |
| Database Server |
1 |
IBM System x3950 M2 |
2 x Intel® Xeon®X7350 CPUs (4-Core 2.93GHz 64-bit) |
4 |
32 GB |
Netapp LUN FC |
600 GB |
Gigabit Ethernet |
Red Hat Linux 6.4 64-bit |
| RPT Workbench |
1 |
IBM x3250 M3 |
1 x Intel® Xeon®X3480 CPU (4-Core 3.06GHz 64-bit) |
4 |
16 GB |
RAID 0 |
100 GB |
Gigabit Ethernet |
Red Hat Linux 5.8 64-bit |
| RPT Agents |
5 |
VM Image |
1 x AMD Opteron 3.0GHz |
2 |
3GB |
SATA |
35GB |
Gigabit Ethernet |
Red Hat Linux 5.2 64-bit |
RPT Agents |
5 |
VM Image |
4 x Intel(R) Xeon(R) CPU E5-2687W 3.10GHz |
8 |
4GB |
SATA |
90GB |
Gigabit Ethernet |
Red Hat Linux 5.8 64-bit |
| Network switches |
N/A |
Cisco 2960G-24TC-L |
N/A |
N/A |
N/A |
N/A |
N/A |
Gigabit Ethernet |
24 Ethernet 10/100/1000 ports |
N/A: Not applicable.
Network connectivity
All server machines and test clients are located on the same subnet.
The LAN has 1000 Mbps of maximum bandwidth and less than 0.2 ms latency in ping.
Data volume and shape
The artifacts were distributed between 2 components in 1 project, 50 scm streams and artifacts.
The repository contained the following data:
- 134 folders
- 983 files
- 50 streams
- Database size = 15 GB
- JTS index size = 1 MB
- CCM index size = 1 MB
Methodology
Test cases and workload characterization
For release to release baseline performance comparison a rate controlled workload is used, named Rational Performance Platform (RPP). A rate controlled user is a user thread that runs at a controlled rate based on the user factors such as Builds (4): Developer (12): Contributors (10): Feeds (35). It may run at a multiple of the target rate to represent more than one user but it will run no faster than the target rate and will report exceptions if it can't keep up. In addition, the use of ratio-based sequences RPPSequences as explained below ensures that the proportion of user types is maintained as new threads are created. The default ratio is Builds(1): Developers(7): Contributors(14): Feeds(7)
This section describes in more detail what the RTC sequences do to emulate user activity.
RPPSequences are Java-based schedules that provide the setup and runtime iteration logic to drive a series of custom-code based "tasks" simulating user operations and use cases. Different user types are represented by named sequences to simulate activity by different user roles. A single user thread may be running at a higher than normal speed to simulate more than one user; for this reason each sequence has "factors" estimating how many individual tasks each user type would perform per hour and the estimated number of users is based on dividing total tasks for a user class by that "factor" to estimate number of users.
Communication between Developer and Build users rely on an intermediate API layer that calls an external process known as the "SCM Daemon" which handles the actual server connections; an agent usually has two of these daemons to distribute load. Contributor users include some local API calls as well as REST calls to simulate web browser
traffic.
File Downloads:
Projects and Streams: Users are assigned to different streams in the same project to spread them out into small to medium teams working in each stream. The project/stream structure is up to the tester but is typically 10-50 streams.
Components and Workspaces: User workspaces work with one of two components for different operations:
- "Stable" component is fixed size and is not subject to changes or growth during the run. The file number and size are up to the tester but are typically 5 K to 10 K files with an average size of 10 Kbytes per file. This is used to get predictable behavior for Load operations.
- "Active" component usually starts empty but this is where Developer users create and modify files, so it grows quickly with a lot of users in the same stream.
Builds (BuildJavaSequence)
Builds simulate an RTC Build Engine by requesting work (BuildRequests), then simulating a Build cycle by loading a workspace, sending status messages, and publishing artifacts to the server to simulate a load, compile, test, and publish build cycle. One build per hour is meant to simulate one build engine; in the test harness, a build "user" may perform one or more builds per hour, depending on configuration.
Currently one complete build cycle per hour represents one "build".
ONETIME SETUP:
- Create BuildDefinition, BuildEngine, and workspace as needed
RUNTIME LOOP:
BuildRequests: Simulate build engines by making multiple requests before build assignment by invoking the most commonly called webservices through the BuildToolkit at 6 different points in the sequence, doing the following each build cycle:
- 6 times 10x (getBuildDefinition)
- 6 times 30x (getBuildEngine, getNextRequest)
- 6 times 4x (setLastContactTime)
Build Cycle simulation: Send status messages and artifacts to the server simulating the communication process during real builds.
Workspace Loading: Completely unload and load the workspace STABLE component once
Note: Longest operation
Start build: getBuildDefinition, getBuildEngine, requestAndStartBuild, getBuildResult
Activities: Each activity begings with startBuildActivity and ends with completeBuildActivity
PublishLinks: Publish (one URL)
Compile: Publish (compile.logs.xml, compile.logs)
PublishArtifacts: Publish (test-artifact.txt, 2x(smallzipfile.zip), link)
Testing: Publish (5 different results.xml files plus buildlog.txt)
Note: Time intensive because artifacts are parsed on client side and cause many web service calls
Complete: makeBuildComplete (signal build finished)
WorkItems (ContributorSequence)
The WorkItem Contributor sequence simulates a mix of activities in specific proportions. A single contributor is set to perform 20 tasks per hour in the RPP simulation. Workitem traffic consists of some REST calls isolated from early SVT HTTP script based tests and a series of API based tests that create and modify workitems, refresh workitem contents, and create, run, and delete queries.
ONETIME SETUP:
RUNTIME LOOP:
|
Use case
|
Description
|
% of Total Workload
|
| Login
|
Logout/Login - Relogin to the current account
|
2
|
| Refresh Workitem |
Lookup and retrieve an existing workitem |
78 |
| Browser REST calls simulating some browser operations |
WorkItemRESTNavigation - IQueryRestService/queries and 10x(IQueryRestSerice/query). Other calls in this operation have been disabled over time because of version incompatibilities
WorkItemRESTOpenWIPage - IWorkItemReservice/allValues, IQueryRestService/queriesForOwner, IQueryRestService/scopedQueries |
1 |
| Browser REST calls simulating other operations |
GetEditorPresentation - IWorkItemRestService/editorPresentation
GetPredefinedQueries - IQueryRestService/scopedQueries
GetQuickInfoPresentation - IWorkItemRestService/quickInformationPresentation
GetValueSets - IWorkItemRestService/workItemEditableProperties |
2 |
| Create/Modify Workitems |
WorkItemCreateWorkItem - Create a new workitem. Recent changes add a larger description
WorkItemModify - Add link, subscripter, comment, approval, and change state of existing workitem |
14 |
| Add Attachment to Workitem |
Add a 1 megabyte attachment to an existing workitem. Recent changes reduce this to 20K but allow the test to control the size. |
1
|
| Queries |
CreateQuery2 - Create a new query looking for summary containing "test1"
CreateQueryAndDelete - Create same query but immediately delete it
2x RunQuery - Run a pre-established query and confirm it returns same 30 results expected
2x RunQueryAndOpen - Run same query and open first workitem in it
ModifyQuery - Modify and save the query created by CreateQuery2 |
1 |
| Reports |
Disabled |
1 |
Developer (DeveloperSequence)
Developers generally use the Eclipse rich client to download files, checkin changes, accept changes from other users and make deliveries; in addition they rely on Feeds data and perform Contributor operations. This sequence runs at 25 tasks per hour per developer. Each developer should be matched by a Feeds "user" at 40 tasks/hour and some additional Contributor traffic.
ONETIME SETUP:
- Create a new workspace and load the "Active" component used for making and receiving changes
- Create a private work directory of roughly 50 files and folders to use as a personal "scratch box" for making changes without conflicting with other users.
Note: Doing fresh setup periodically will probably smooth out longer runs
RUNTIME LOOP
Workspace operations
| Use case |
Description |
% of Total Workload |
| Workspace Load |
Unload and Load the "Stable" component, an unchanging component of 5-10K files |
1 |
| Workspace refresh |
Load the "Active" component, requiring workspace compare but usually no file downloads |
15 |
| Clone Workspace |
Clone and make another copy of workspace |
1 |
| Do nothing |
|
83 |
"During Day" activity loop (Runs 10 times within each runtime loop)
| Use case |
Description |
% of Total Workload |
| Make file changes in the private directory |
Make changes: Checkin changes to current changeset after making 1-8 changes to local filespace (change files(82%), create files(12%), delete files (5%), create folder(1%)) Modify the changeset: CloseChangeSet (8%), Suspend/Resume(6%), Discard(5%), do nothing (81%) |
50 |
| CompareWorkspace |
Compare workspace to another workspace |
5 |
| Accept/Deliver changes |
Accept/Deliver changes to and from local workspace to repository workspace |
5 |
| Accept incoming changes |
Accept incoming changes from repository workspace into local workspace |
20 |
| RefreshPendingChanges |
Refresh pending changes to see local changes made versus incoming changes |
10 |
| History |
Get history on single file |
5 |
| Deliver/Baseline |
Deliver changes to repository workspace or take a baseline off the workspace |
3 |
| CompareWorkspaceBaseline |
Compare baselines on a workspace |
2 |
| Do nothing |
|
10 |
Feeds (FeedsSequence)
Feeds simulate a feature of the Eclipse rich client which checks the server for recent workitem or build events of interest to the user. Feeds are normally repeated for each user every 10 minutes for the projects they are working with. RTC Development early on indicated that they had seen roughly 40 feeds operations per developer (Eclipse user) per hour and that is the basis for our simulation rate.
ONETIME SETUP:
Create one feed channel for the current project and one feed channel for the associated team area. Usually sets up two feeds channels per user; RTC developers average around eight.
RUNTIME LOOP:
RefreshFeeds: Called repeatedly during run
Request each feed channel parse its input (make a query to the server and parse results)
Reset time window: Simulate how client works by creating a new dummy news item to reset the time window subsequent feeds requests should use. Without doing this, all feeds produce news from the beginning of time.
Results
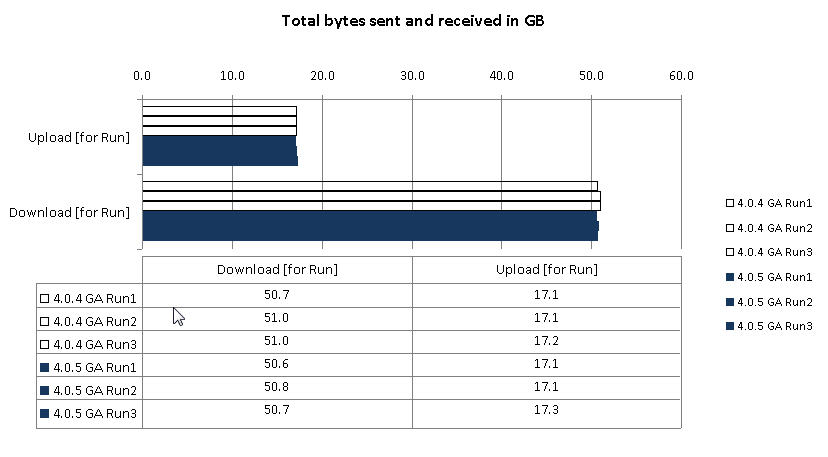
User Estimation
| |
4.0.4 GA |
4.0.5 GA |
| # of users |
2,361 |
2,361 |
| download/hr |
12.67 GB |
12.68 GB |
| upload/hr |
4.28 GB |
4.31 GB |
Task throughput
| |
4.0.4 GA |
4.0.5 GA |
| # of completed tasks |
341,473 |
341,568 |
Tasks represents use-cases based on frequently done standard user operations. Task throughput is the number of completed tasks throughout the run duration.
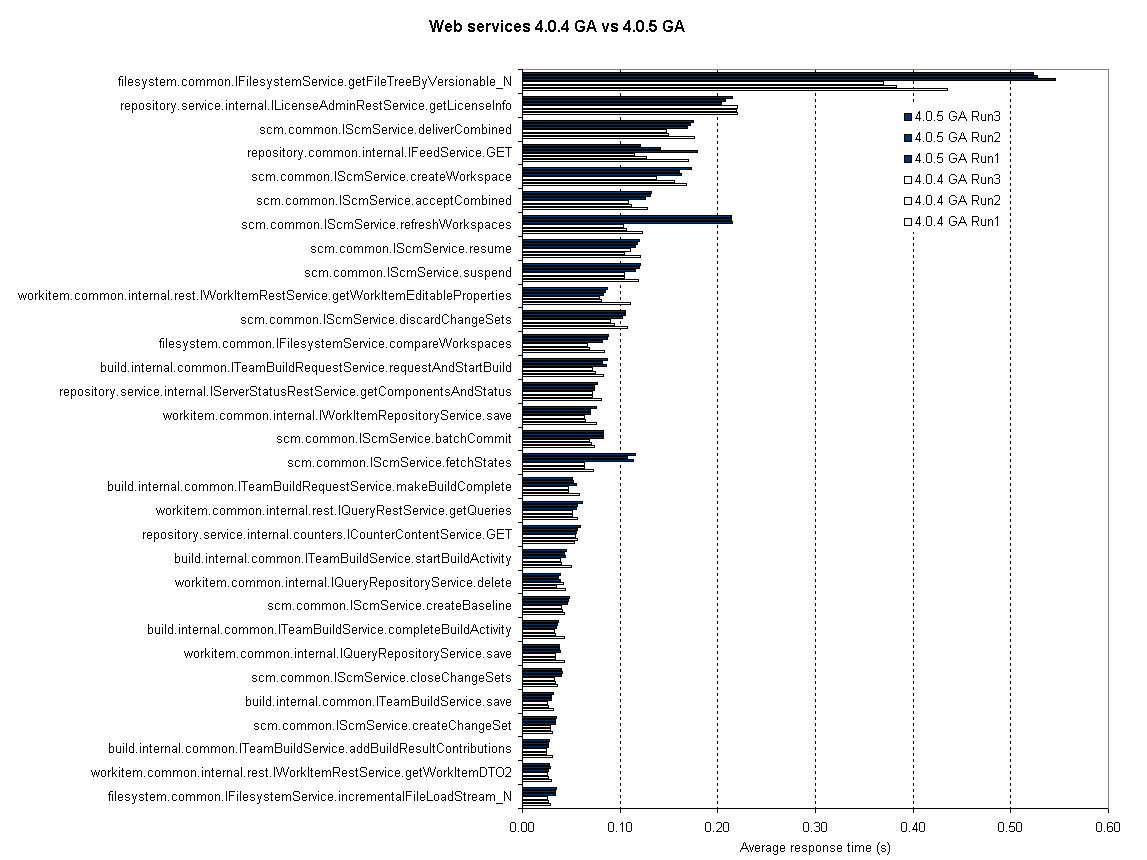
CCM Server web services
Server side web services data are collected from the CCM server using JazzMon / JTSMon monitoring tool. Comparing 4.0.4 to 4.0.5 RC1, all the web services listed below are comparable in response times and counts. However, due to known issues in Java 1.6 which is the default JVM included with WAS 8.5.5.0 two web services (filesystem.common.IFilesystemService.getFileTreeByVersionable_N and scm.common.IScmService.refreshWorkspaces) were slower. When 4.0.5 GA was tested with WAS 8.5.5.0 with a pre-release version of Java 1.7, web service response times and counts showed much improvement.

System comparison
OS resource usage - average CPU
 OS resource usage - average memory
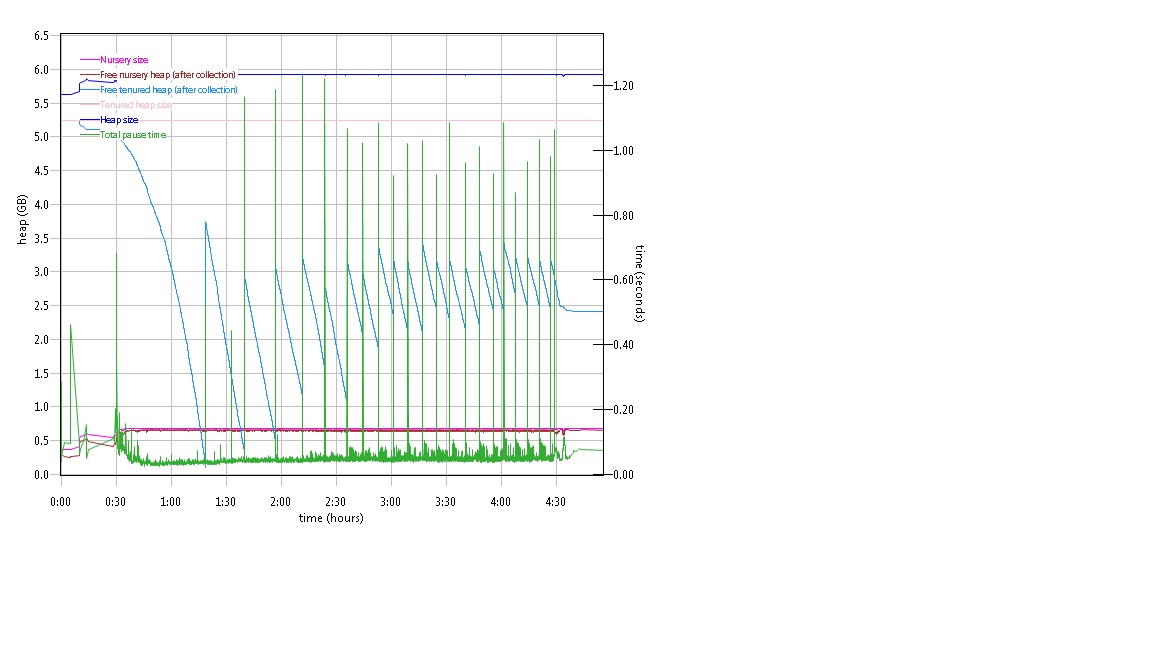
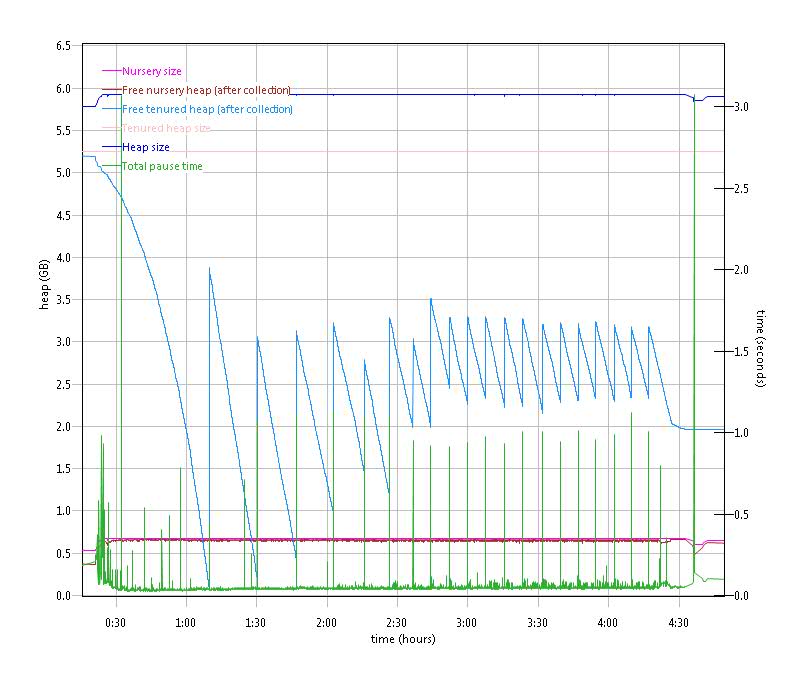
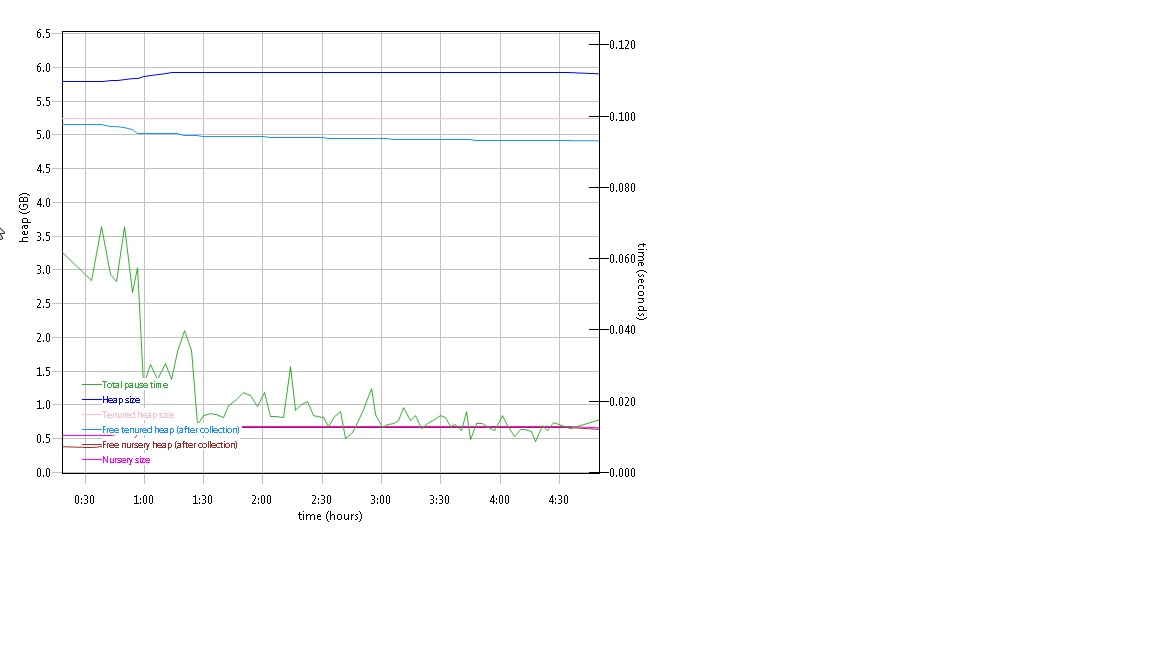
Garbage collection
Verbose garbage collection is enable to create the GC logs. The GC logs shows very little variation between runs except at 30 min duration there is a long pause time in 4.0.5 GA. There is also no discernible difference between versions.
Below is one example of the output from the GC log.
4.0.4 GA CCM garbage collection
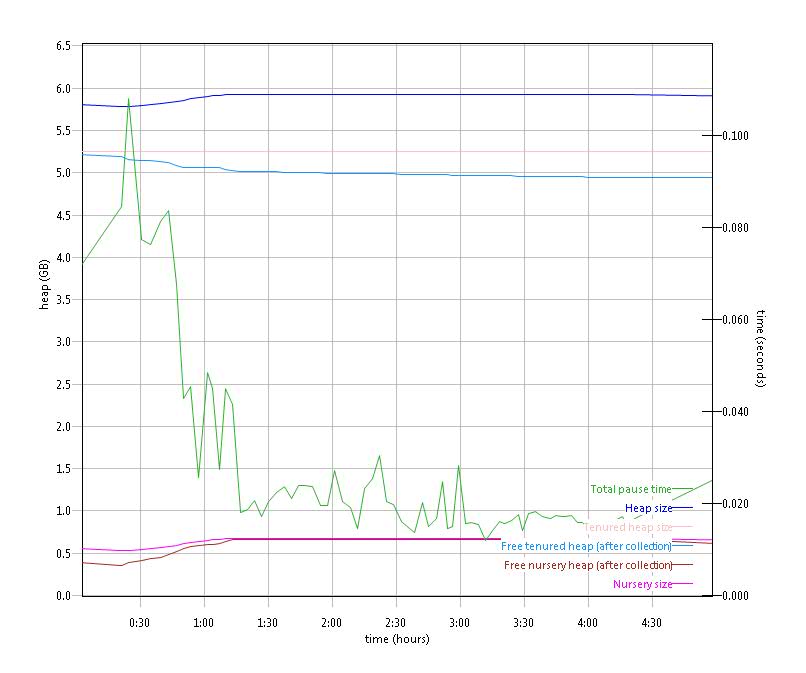
 4.0.5 GA CCM garbage collection
 4.0.4 GA JTS garbage collection
 4.0.5 GA JTS garbage collection
Appendix A
Product
|
Version |
Highlights for configurations under test |
| IBM HTTP Server for WebSphere Application Server |
8.5.0.0 |
IBM HTTP Server functions as a reverse proxy server implemented
via Web server plug-in for WebSphere Application Server. Configuration details can be found from the CLM infocenter.
HTTP server (httpd.conf):
OS Configuration:
|
| IBM WebSphere Application Server | 8.5.5.0 | JVM settings:
- GC policy and arguments, max and init heap sizes:
-Xmn768m -Xmx6g -Xms6g -Xgcpolicy:gencon -Xgc:preferredHeapBase=0x100000000 -Xloaminimum0.02 -Xsoftrefthreshold5 -Xdump:stack:events=fullgc -Xdump:java:events=systhrow+user,filter=java/lang/OutOfMemoryError,request=exclusive+prepwalk -Xdump:stack:events=allocation,filter=#20m,request= -XX:MaxDirectMemorySize=1500M
Thread pools:
- Maximum WebContainer = 300
- Minimum WebContainer = 50
OS Configuration:
Increase system wide resources for the app server process owner:
- max user processes = unlimited
- core file size = unlimited
- open files = 65536
- stack size = 65536
|
| DB2 |
DB2 Enterprise Server 10.1.0.2 |
Tablespace is stored on Netapp LUN storage device. |
| LDAP server |
Microsoft Active Director v2008 R2 |
Defaults |
| License server |
Same as CLM version |
Hosted locally by JTS server |
| RPT workbench |
8.2.1.5 |
Defaults |
| RPT agents |
8.2.1.5 |
Defaults |
| Network |
|
Shared subnet within test lab |
Appendix B - References
Appendix C - History
Prior reports are located on jazz.net development wiki:
About the authors
ChetnaWarade is has been a Software Engineer at IBM for over 9 years. She is part of the Rational Performance Engineering group.
Questions and comments:
- What other performance information would you like to see here?
- Do you have performance scenarios to share?
- Do you have scenarios that are not addressed in documentation?
- Where are you having problems in performance?
Warning: Can't find topic Deployment.PerformanceDatasheetReaderComments