The Jazz metronome tool keeps us honest
Authors: VaughnRokoszBuild basis: Rational Team Concert 3.0.1.1
Page contents
From Techworld.com How not to deploy an application over a WAN, Although the medical appointment application was advertised as being client/server based, it wasnt. In particular, the application was designed in such a way that the data in each field was sent character by character over the network. Hence, this was another example of an application that runs well over a LAN but presents performance problems over a WAN.
 The information displayed by the metronome tool is fairly low-level; it tracks which service and methods are called, the cumulative elapsed time in each request, and the slowest time. Whats also cool is that you can reset the counters and run something from the UI and see how chatty a particular feature is. With the service class grouping you can generally differentiate between work items, builds, process, or scm by looking at the service names.
Your feedback and potential defects are welcome and invited. To help you understand the information here are some usage hints:
The information displayed by the metronome tool is fairly low-level; it tracks which service and methods are called, the cumulative elapsed time in each request, and the slowest time. Whats also cool is that you can reset the counters and run something from the UI and see how chatty a particular feature is. With the service class grouping you can generally differentiate between work items, builds, process, or scm by looking at the service names.
Your feedback and potential defects are welcome and invited. To help you understand the information here are some usage hints:
 There are some service calls that are shared between all components. TeamContentService is used to fetch and upload all content to and from the server. This method will be chatty when you load a repository workspace or upload work item attachements, so it will be more difficult to blame a particular component for being chatty. In many cases its okay to hit the server several times since we pipeline some calls and reuse the underlying HTTP connection. This is why its best to interpret the information based on slowness of some operations and not only based on the round-trips in daily usage.
Open metronome and start measuring away when things feel slow over a WAN. If the numbers look fishy, open a bug report (dont forget to look for duplicates first)! There are probably some embarrassingly chatty actions lurking out there, but wed rather know about them sooner rather than later so that we can fix them. Lets all work to make Rational Team Concert WAN friendly.
Another feature of the metronome tool helps measure your connection speed to a Jazz server. This can help decide how responsive the client will be given the bandwidth and latency between the client and the server.
There are some service calls that are shared between all components. TeamContentService is used to fetch and upload all content to and from the server. This method will be chatty when you load a repository workspace or upload work item attachements, so it will be more difficult to blame a particular component for being chatty. In many cases its okay to hit the server several times since we pipeline some calls and reuse the underlying HTTP connection. This is why its best to interpret the information based on slowness of some operations and not only based on the round-trips in daily usage.
Open metronome and start measuring away when things feel slow over a WAN. If the numbers look fishy, open a bug report (dont forget to look for duplicates first)! There are probably some embarrassingly chatty actions lurking out there, but wed rather know about them sooner rather than later so that we can fix them. Lets all work to make Rational Team Concert WAN friendly.
Another feature of the metronome tool helps measure your connection speed to a Jazz server. This can help decide how responsive the client will be given the bandwidth and latency between the client and the server.
Metronome tool
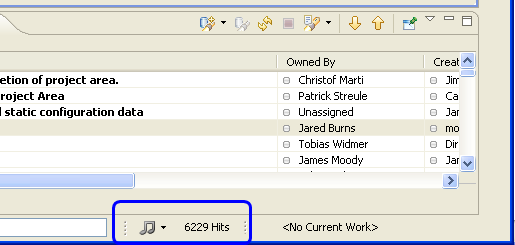
We really wanted to avoid this with Rational Team Concert so we built a utility called the Jazz metronome to keep us honest. We wanted to make it easy to debug the client and find out when the server was being contacted (i.e. round-trips) and how long each server request took, so that we could easily see how chatty the client was being and fix the problem areas. The Jazz metronome was previously part of the Source Control developer tools plug-in and wasnt part of the Rational Team Concert client. But it turned out to be so useful that starting in the next milestone build following Beta 2 (M5, planned for late February), well be including the tool in the milestone downloads so that our customers and developers can easily use it. You can enable the Jazz metronome from the Team > Jazz Source Control preference page which will enable a trim widget that shows the global round-trip count, then you can open the detail window from the trim widget to get service by service breakdown as shown in the video at the end of this entry.
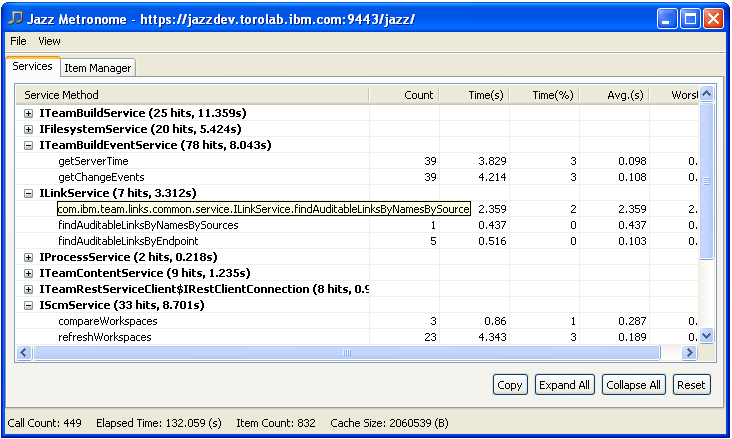
The information displayed by the metronome tool is fairly low-level; it tracks which service and methods are called, the cumulative elapsed time in each request, and the slowest time. Whats also cool is that you can reset the counters and run something from the UI and see how chatty a particular feature is. With the service class grouping you can generally differentiate between work items, builds, process, or scm by looking at the service names.
Your feedback and potential defects are welcome and invited. To help you understand the information here are some usage hints:
- If it aint broke if everything is running just fine then you can skip the rest of this blog entry and you never have to use the tool.
- However, if you are stuck in a hotel with spotty connectivity and find the client sluggish, open the metronome window and take a peek at what is happening.
- Turn off all background updating jobs in Team Central. Most of the query sections have a Refresh option in their drop-down menu, while the build section has a configuration parameter for how often to contact the server. This will both help isolate who is being chatty and help reduce the round-trips while your connection is slow.
- Open the metronome tool and rerun the action that is running too slow. Take note of the service calls. Since there are several factors that affect WAN performance, for example amount of data being sent or number of round-trips (latency) its best to simply take notes and open a bug report.
- If you can, include information in the bug report about your connection characteristics, ping time to the server, your connection speed, and dont forget to copy and paste the tree shown in the metronome window directly into the bug report. This can be done by selecting the rows in the tree and clicking the Copy action in the bottom right.
There are some service calls that are shared between all components. TeamContentService is used to fetch and upload all content to and from the server. This method will be chatty when you load a repository workspace or upload work item attachements, so it will be more difficult to blame a particular component for being chatty. In many cases its okay to hit the server several times since we pipeline some calls and reuse the underlying HTTP connection. This is why its best to interpret the information based on slowness of some operations and not only based on the round-trips in daily usage.
Open metronome and start measuring away when things feel slow over a WAN. If the numbers look fishy, open a bug report (dont forget to look for duplicates first)! There are probably some embarrassingly chatty actions lurking out there, but wed rather know about them sooner rather than later so that we can fix them. Lets all work to make Rational Team Concert WAN friendly.
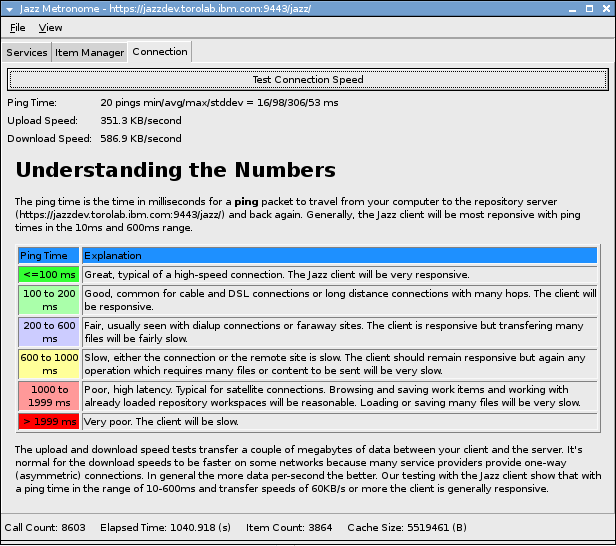
Another feature of the metronome tool helps measure your connection speed to a Jazz server. This can help decide how responsive the client will be given the bandwidth and latency between the client and the server.
Related topics:
External links:
- None
Contributions are governed by our Terms of Use. Please read the following disclaimer.
Dashboards and work items are no longer publicly available, so some links may be invalid. We now provide similar information through other means. Learn more here.