DOORS Next 7.2.0 Cross Server Linking Performance Report
Authors: Jayrajsinh GohilBuild basis: 7.2.0
Introduction
This article presents the results of performance testing conducted on version 7.2.0 for cross-server linking scenarios where link constraint rules are enforced. The test environment consists of requirements configurations with a data shape of 1 million artifacts on both local and remote DOORS Next (DN) servers. Each component was configured with 500 link constraint rules under an integrated global configuration (GC) setup. The test setup utilized global configurations and requirements in components managed in DN.Summary of Test scenario
The performance test was executed with a load of 500 concurrent users generating multiple links (25 links) between two artifacts hosted on separate servers, governed by link constraint rules. The primary objective was to evaluate the system's response time under high load conditions when link constraints are enabled across servers. Linking with Constraints (within-server vs cross-server): We executed a linking scenario with constraints between artifacts, covering both within-server and cross-server configurations. The objective was to assess the response time impact when creating multiple links (25 links) under constrained conditions. Testing was conducted across three component sizes: small, medium, and large. The results indicated that cross-server linking takes longer than within-server linking, with an observed increase ranging approximately from 0.3 to 1.9 seconds . Cross-Server Linking (with vs without constraints): Cross-server multi-link (25 links) creation was tested with and without link constraint rules across three component sizes: small, medium, and large. The results showed increase in response time when link constraint rules were applied. Specifically, the response time increased by approximately 3 to 4.9 seconds compared to scenarios where constraints were not applied.Standard Disclaimer
The information in this document is distributed AS IS. The use of this information or the implementation of any of these techniques is a customer responsibility and depends on the customers ability to evaluate and integrate them into the customers operational environment. While each item may have been reviewed by IBM for accuracy in a specific situation, there is no guarantee that the same or similar results will be obtained elsewhere. Customers attempting to adapt these techniques to their own environments do so at their own risk. Any pointers in this publication to external Web sites are provided for convenience only and do not in any manner serve as an endorsement of these Web sites. Any performance data contained in this document was determined in a controlled environment, and therefore, the results that may be obtained in other operating environments may vary significantly. Users of this document should verify the applicable data for their specific environment. Performance is based on measurements and projections using standard IBM benchmarks in a controlled environment. The actual throughput or performance that any user will experience will vary depending upon many factors, including considerations such as the amount of multi-programming in the users job stream, the I/O configuration, the storage configuration, and the workload processed. Therefore, no assurance can be given that an individual user will achieve results similar to those stated here. This testing was done as a way to compare and characterize the differences in performance between different versions of the product. The results shown here should thus be looked at as a comparison of the contrasting performance between different versions, and not as an absolute benchmark of performance.Data Shapes
The data shape for version 7.2.0 consists of a small number of standard-sized components distributed across five small project areas. The test environment is enabled for configuration management, and all operations are performed within the context of a global configuration. For each component across all five projects on both DN servers, 500 random link constraint rules have been defined. The configuration includes one main Global Configuration (GC) component and two child GC components, each referencing 215 RM components from both DN application servers. Link Constraints: Each component includes 500 random link constraint rules on both DN servers. These rules enable the creation of links between the two servers when the conditions are satisfied. For Performance testing , we used Requirement as the Source and Target artifact types, and Embeds as the link type for each component on both servers to create a links between 2 arfiacts.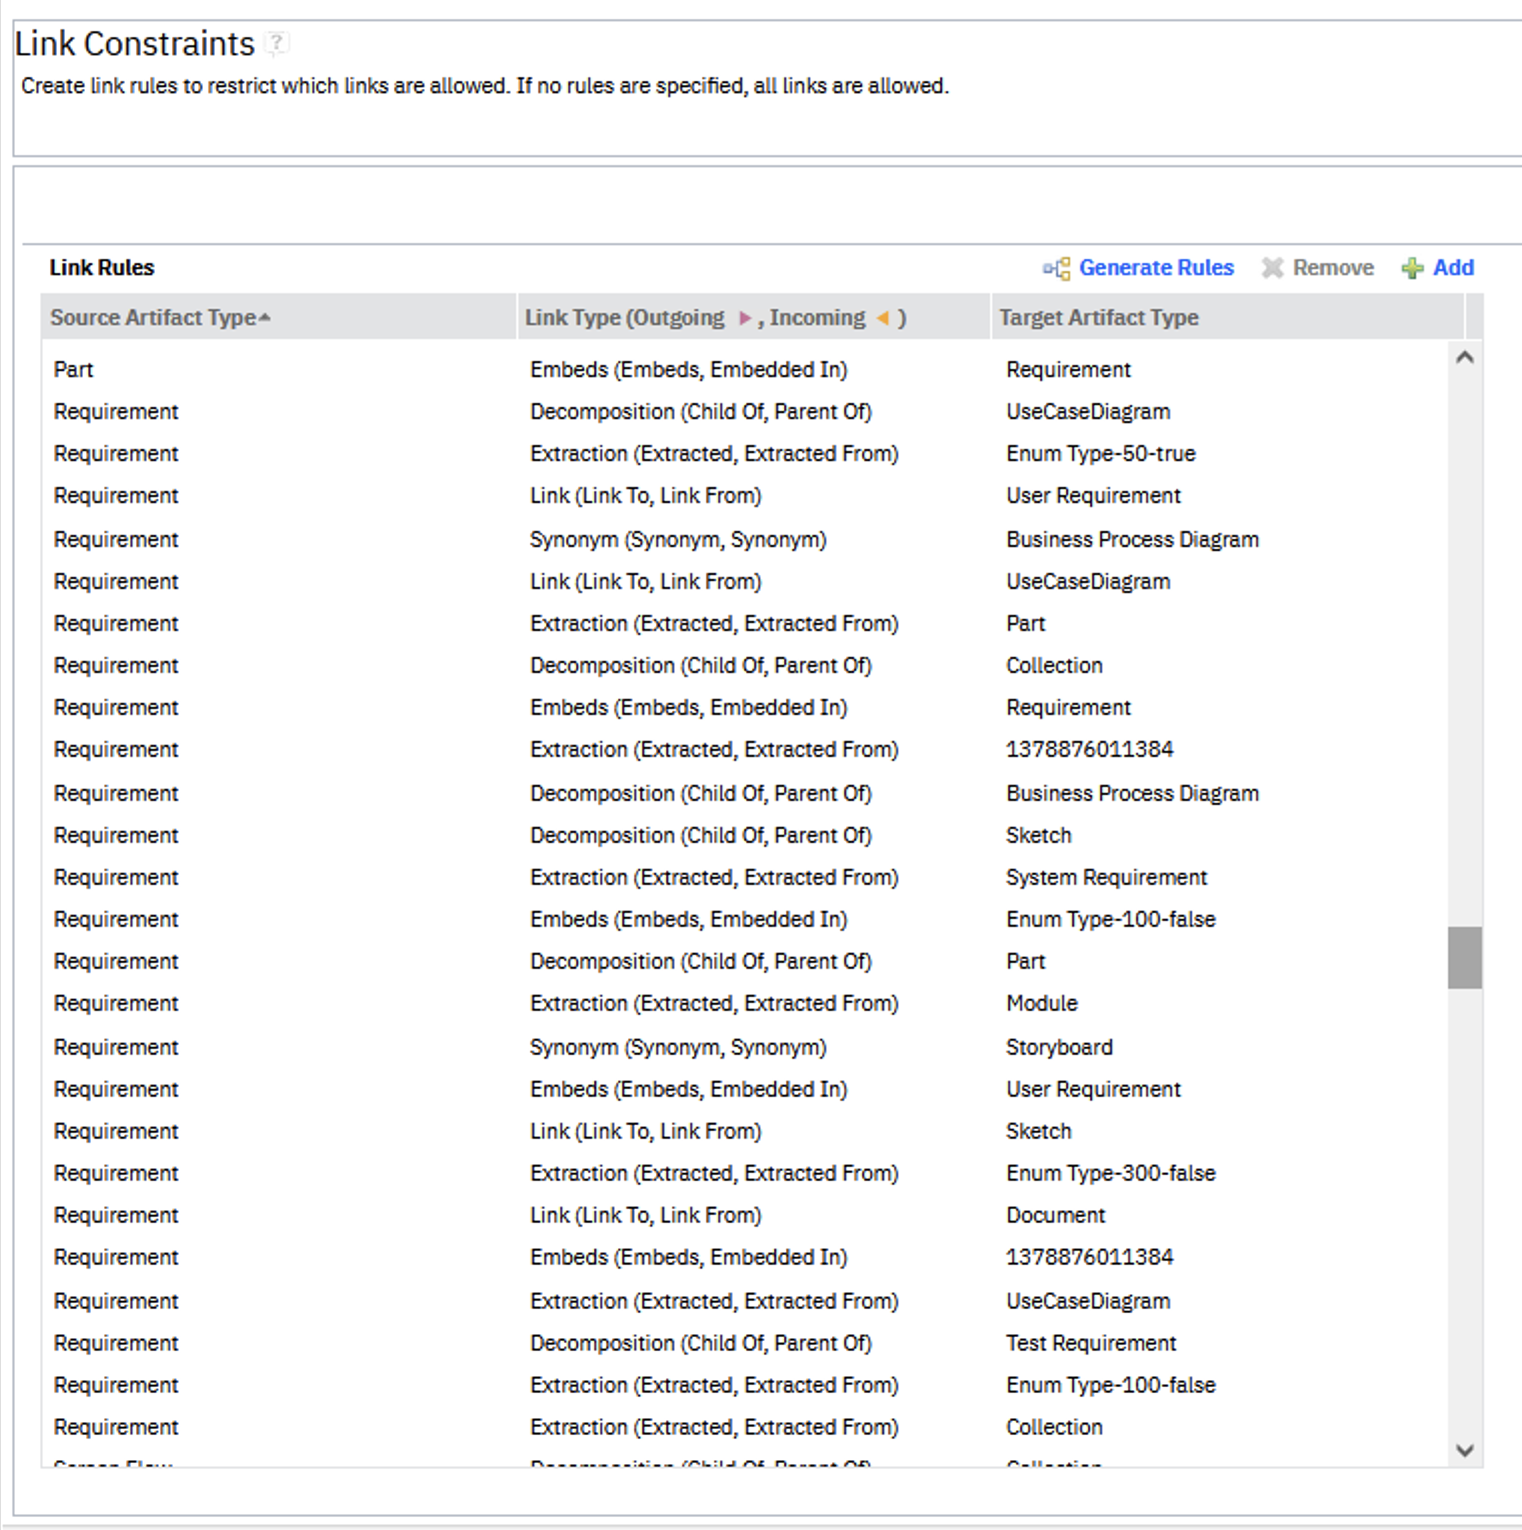
Global Configurations
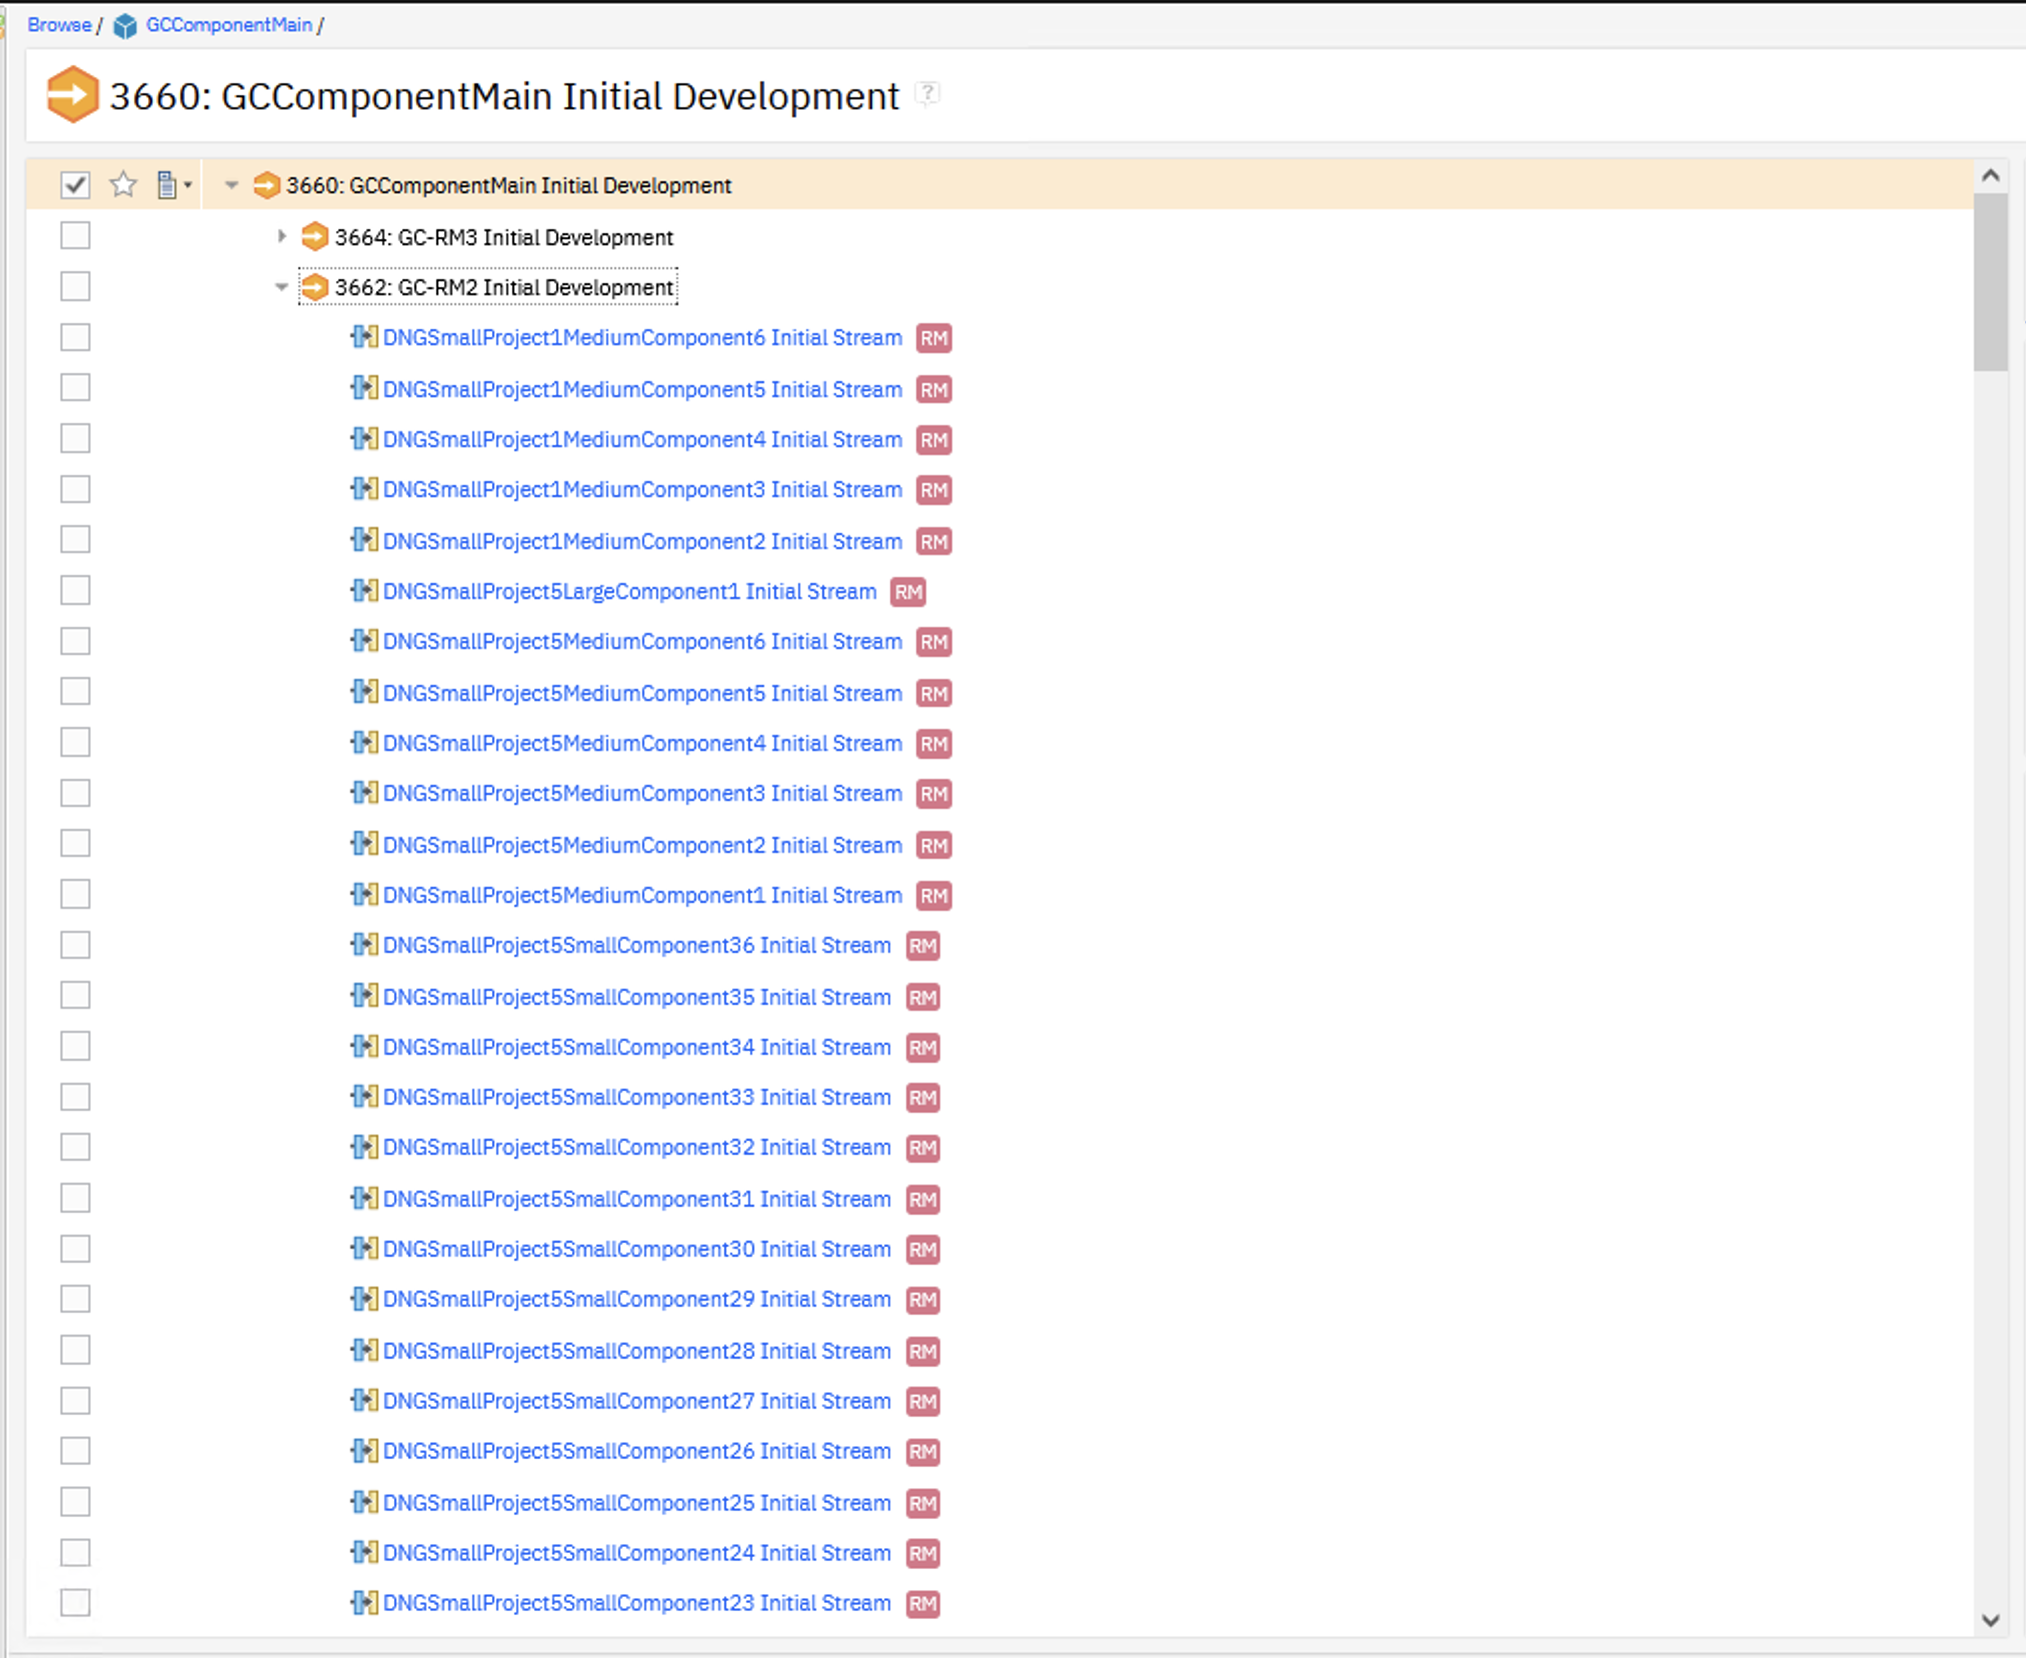
We created global configurations (GCs) and added the DN components as contributions.
- Main GC component
- 2 Child GC components
- Each Child GC contains 215 contributions
Artifact Counts
We have 3 different standard module sizes:- Small: (200 artifacts)
- Medium: (1500 artifacts)
- Large: (10,000 artifacts)
| Artifact Type | Small Component | Medium Component | Large Component |
|---|---|---|---|
| Number of large modules | 0 | 0 | 1 |
| Number of medium modules | 0 | 3 | 0 |
| Number of small modules | 20 | 0 | 0 |
| Total module artifacts | 4000 | 4500 | 10000 |
We use these standard components to create 5 small-sized projects. Artifacts are imported via components to create our standardized shape. In the first 1 million artifacts, each artifact inside a module has 20 links to a matching "Linksource module artifact", resulting in 18,100,000 links. The remaining 2 million links are with the link source module.
| Server Data | Local RM2 Server | Remote RM3 Server |
|---|---|---|
| Total Projects | 5 | 5 |
| Small Component | 36 | 36 |
| Medium Component | 6 | 6 |
| Large Component | 1 | 1 |
| Total Components/Project | 43 | 43 |
| Total Components/Server | 215 | 215 |
| Total Module Artifacts | 905,000 | 905,000 |
| RM Links (artifacts * 20 links) | 18,100,000 | 18,100,000 |
Performance Test Results
We performed a 500-user load test to assess cross-server linking functionality. The test involved selecting a remote server, creating 25 links between two artifacts, and subsequently removing those linksall while link constraint rules were in effect. The RPT schedule was configured with 500 users78% accessing small components, 20% medium, and 2% largerunning for a 1-hour steady-state duration. The test environment contained 1 million artifacts on each RM server. The objective was to validate the cross-server linking response time with link constraints enabled, using an Oracle database backend. All tests were conducted using a DOORS Next data source on the 7.2.0 M7 build.Test Configuration (DN 7.2.0 on Oracle):
- Performed on a Linux/Oracle environment
- Performance workload as detailed above
- Number of contributions in global configuration: 430
- XLinkconstraintschecker thread pool size: 20
- Repository size: 1 million artifacts on each DN servers
- Number of users: 500
- Run duration: Steady state 1 hr
Resource Utilization:
As part of performance testing, CPU and Disk usage were monitored across the 4 systems involved:
- DN Application Server 1
- DN Application Server 2
- JTS/GC Application Server
- Oracle DB with Application and LQE DB
Metrics were collected during a 1-hour steady state test to ensure consistent load conditions.
CPU Utilization- The DN database server OracleDB showed the Average CPU usage at ~48.51% throughout the run.
- The DN application Local server DN Server1 showed the Average CPU usage at ~34% throughout the run.
- The DN application Remote server DN Server2 showed the Average CPU usage at ~13.78% throughout the run.
- The JTS and GC server JTS/GC Server showed the Average CPU usage at ~3% throughout the run.
 Disk Utilization
- The DN database server OracleDB showed the disk utilization at ~69.45% throughout the run.
- The DN application Remote server JTS GC Server showed the disk utilization at ~1% throughout the run.
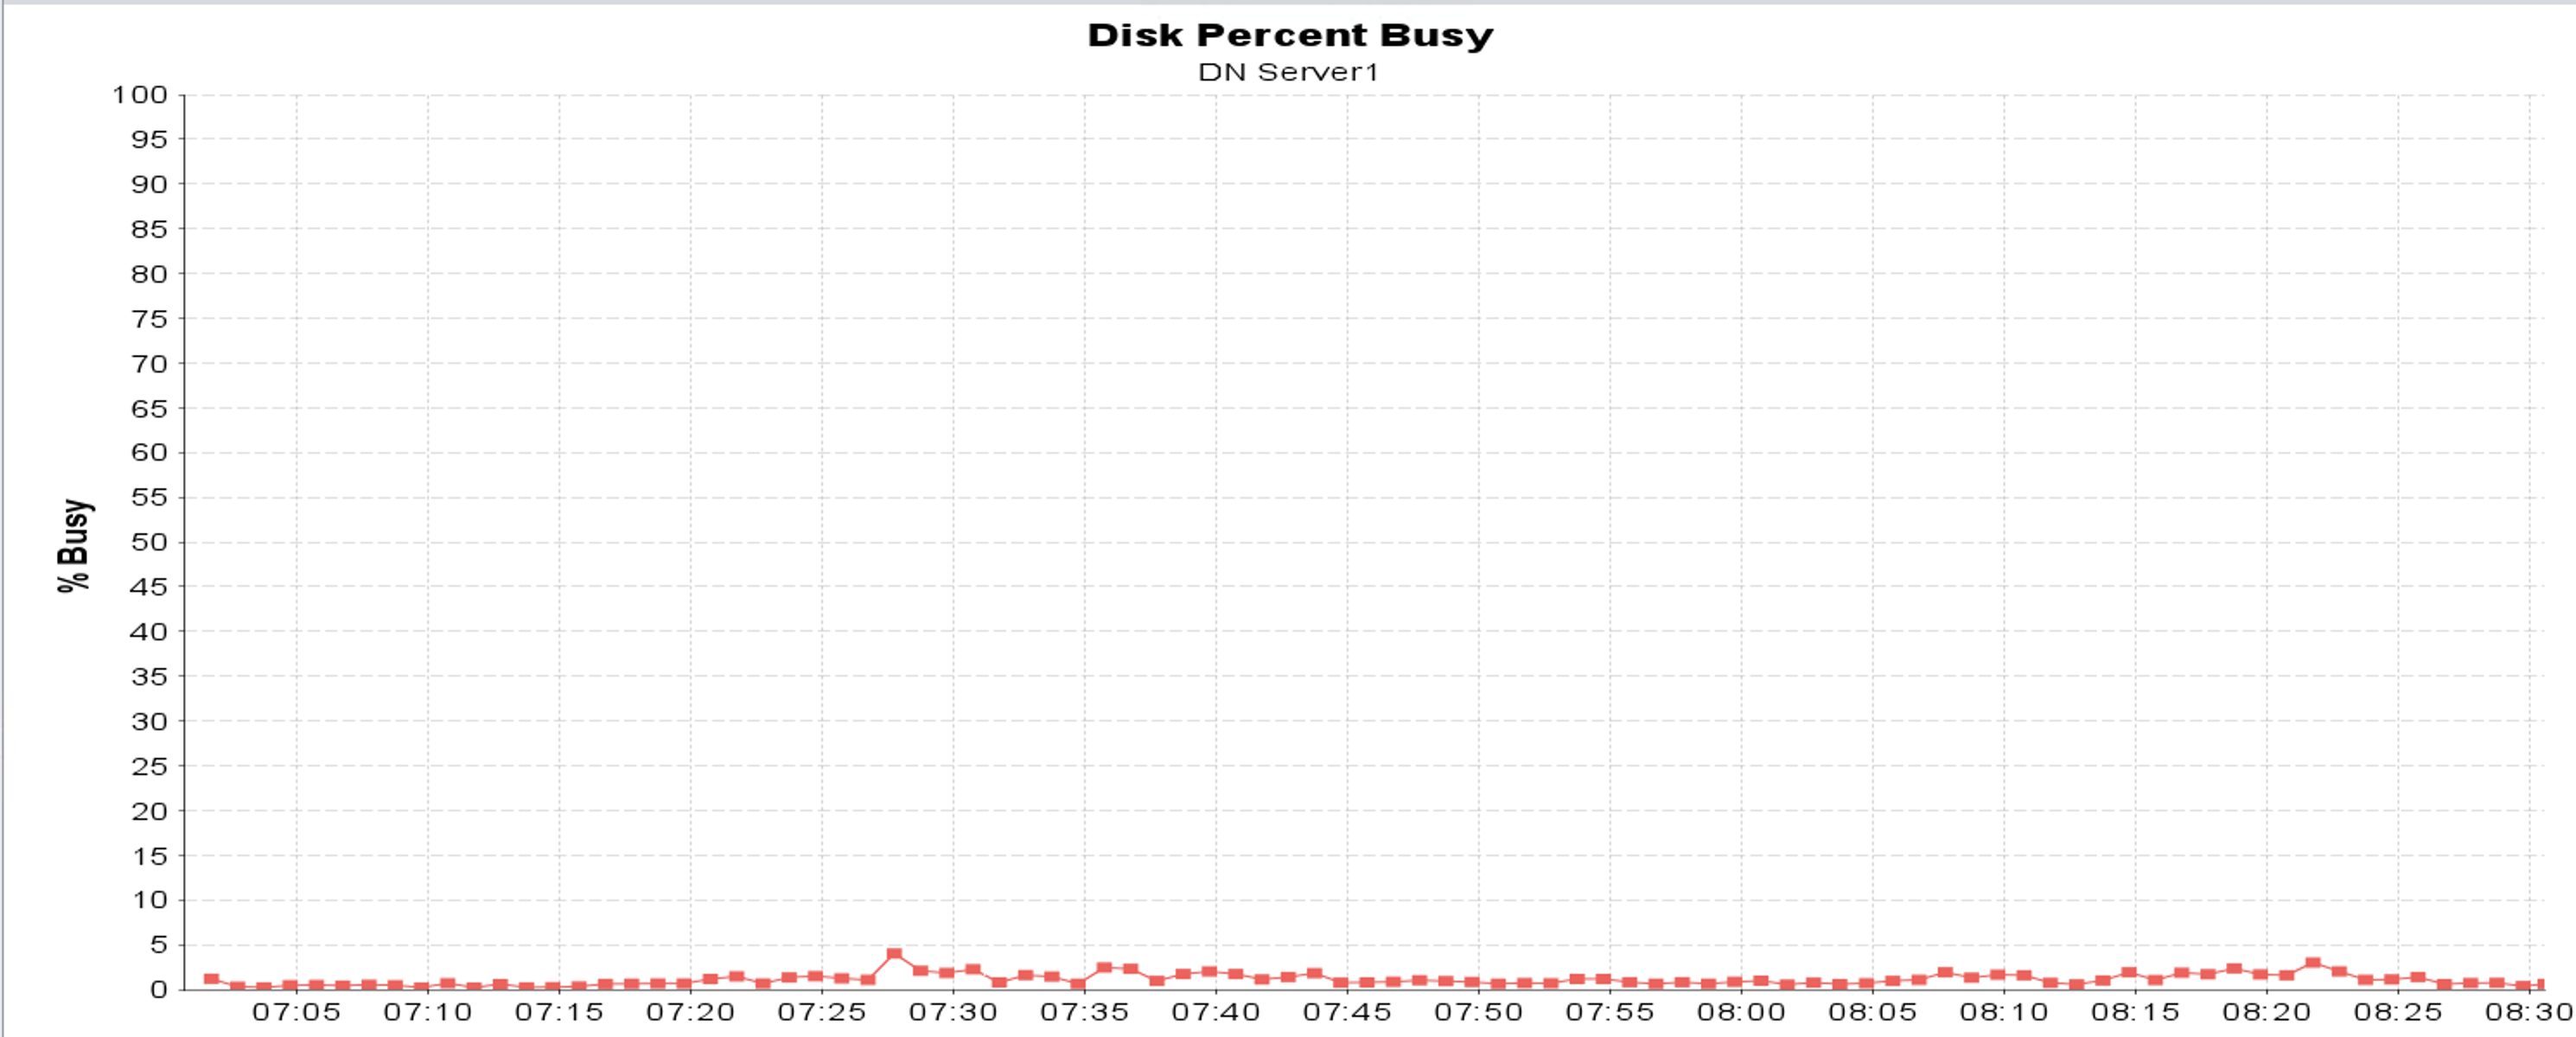
- The DN application Local server DN Server1 showed the disk utilization at ~2.18% throughout the run.
- The DN application Remote server DN Server2 showed the disk utilization at ~2.43% throughout the run.
- The LQE application server LQE Server showed the disk utilization at ~0.1% throughout the run.


 Page Element Throughput
The chart below shows how throughput (measured in transactions per second) scales with user load. A "page element" refers to an individual HTTP call. Throughput reached 142 transactions per second at 500 users.
 Response Time
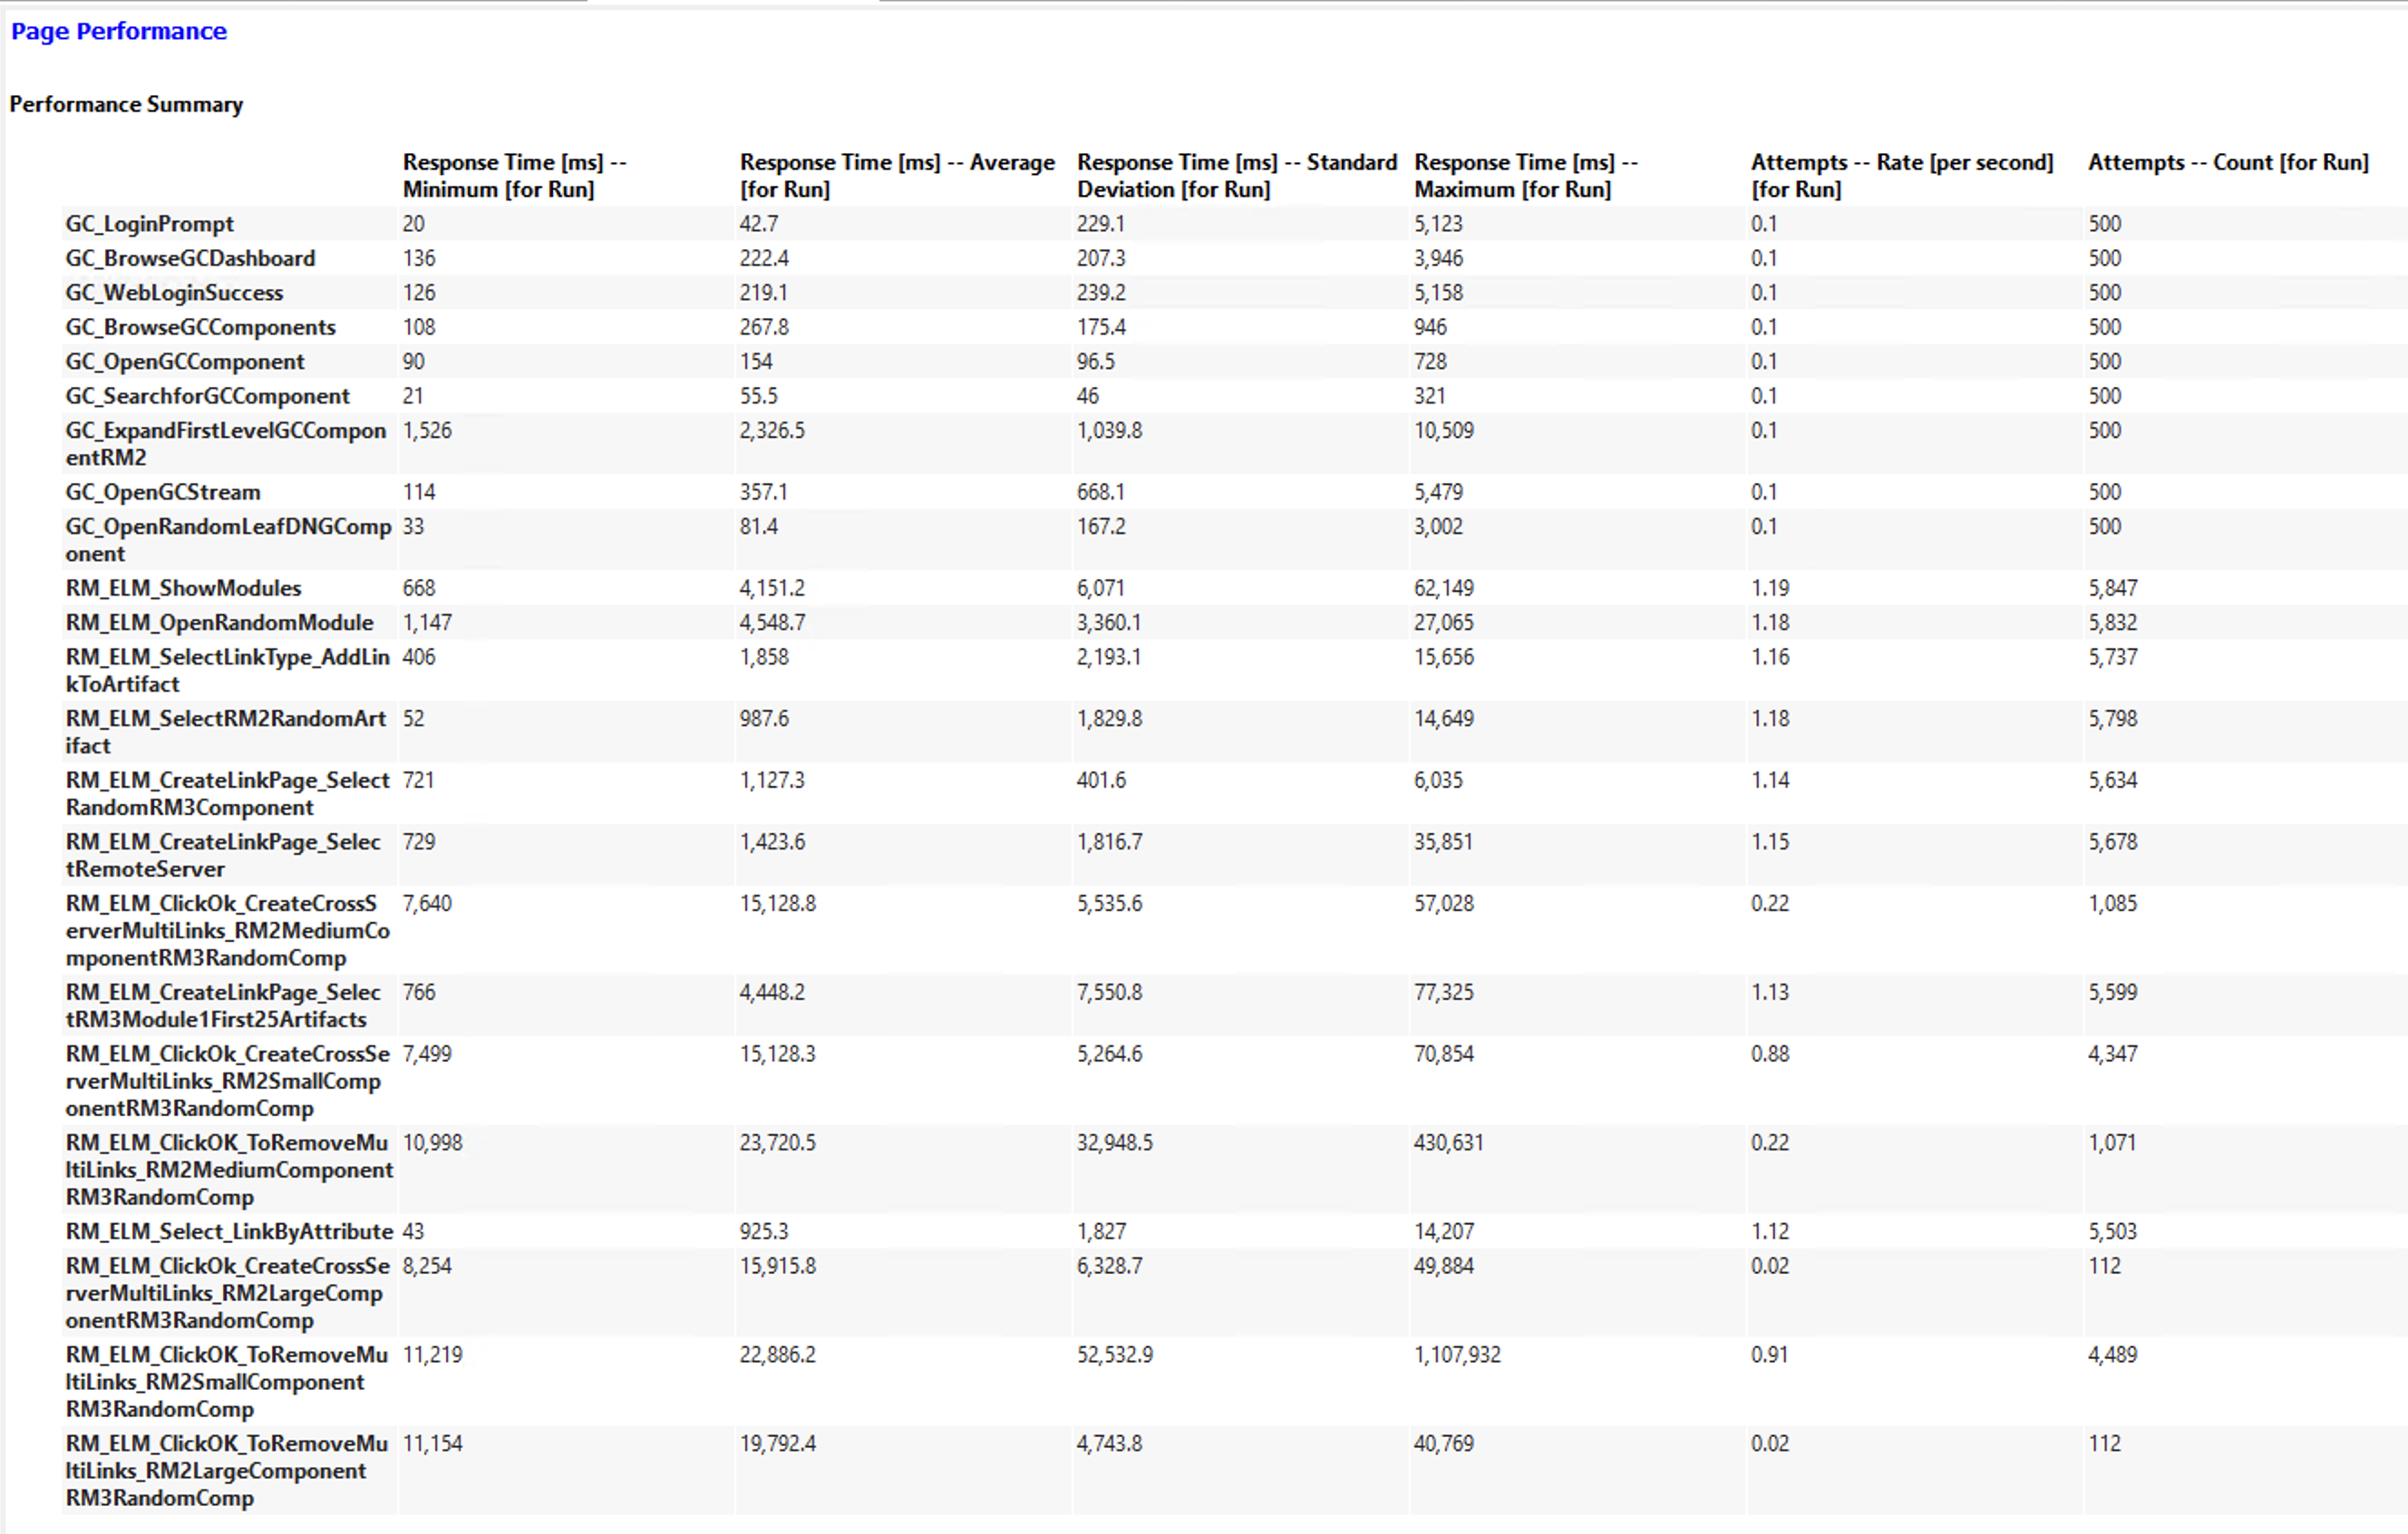
Creating 25 cross-server multi-links between two artifacts takes approximately 15 to 16 seconds across all three component sizes (Small, Medium, and Large) under a 500-user concurrent load.
| Page Name | Small Component (ms) | Medium Component (ms) | Large Component (ms) |
|---|---|---|---|
| Cross-server multi-link creation | 15128.3 | 15128.8 | 15915.8 |

Linking scenario with constraints (within server vs cross server) :
We executed a linking scenario to evaluate the response time when creating 25 links between two artifacts governed by link constraint rules. The test focused on both:
- Within-server linking
- Cross-server linking
Test Configuration
- XLinkconstraintschecker thread pool size: 20
- Repository size: 1 million artifacts on each DN servers
- Users: 10
- Duration:1 hour steady state
Observation
- Cross-server linking between two artifacts showed higher response times compared to linking within-server .
- The increase in response time for cross-server scenarios ranged between 0.3 to 1.9 seconds across three component sizes, as shown in the table below.
| Component Size | Create Multilinks within Server (ms) | Create Multilinks between Cross Server (ms) |
|---|---|---|
| Small | 6117.53 | 6740.12 |
| Medium | 6328.21 | 8231.17 |
| Large | 6599.71 | 6922.9 |
Cross-Server Linking Scenario (with vs without constraints) :
This test measured the difference in response times for cross-server multi-link creation with and without link constraint rules applied. The test focused on both:
- Without-Linkconstraints rules applied
- With-Linkconstraints rules applied
Test Configuration
- XLinkconstraintschecker thread pool size: 20
- Repository size: 1 million artifacts on each DN servers
- Users: 10
- Duration:1 hour steady state
Observation
- Cross-server linking between two artifacts with link constraint rules in place showed higher response times compared to linking without constraints.
- The increase in response time ranged from 3 to 4.9 seconds across three component sizes, as shown in the table below.