Introduction
This article presents the results of our "Extract, Transform, and Load" (ETL) performance testing for the Rational solution for Collaborative Lifecycle Managment (CLM) 4.0.5 release. The ETL type includes Java ETL and DM ETL. Data load includes full load and delta load. In this article, we focus on ETL performance comparison between the 4.0.5 release and the 4.0.4 release.
Disclaimer
The information in this document is distributed AS IS. The use of this information or the implementation of any of these techniques is a customer responsibility and depends on the customers ability to evaluate and integrate them into the customers operational environment. While each item may have been reviewed by IBM for accuracy in a specific situation, there is no guarantee that the same or similar results will be obtained elsewhere. Customers attempting to adapt these techniques to their own environments do so at their own risk. Any pointers in this publication to external Web sites are provided for convenience only and do not in any manner serve as an endorsement of these Web sites. Any performance data contained in this document was determined in a controlled environment, and therefore, the results that may be obtained in other operating environments may vary significantly. Users of this document should verify the applicable data for their specific environment.
Performance is based on measurements and projections using standard IBM benchmarks in a controlled environment. The actual throughput or performance that any user will experience will vary depending upon many factors, including considerations such as the amount of multi-programming in the users job stream, the I/O configuration, the storage configuration, and the workload processed. Therefore, no assurance can be given that an individual user will achieve results similar to those stated here.
This testing was done as a way to compare and characterize the differences in performance between different versions of the product. The results shown here should thus be looked at as a comparison of the contrasting performance between different versions, and not as an absolute benchmark of performance.
What our tests measure
We use predominantly automated tooling such as Rational Performance Tester (RPT) to simulate a workload normally generated by client software such as the Eclipse client or web browsers. All response times listed are those measured by our automated tooling and not a client.
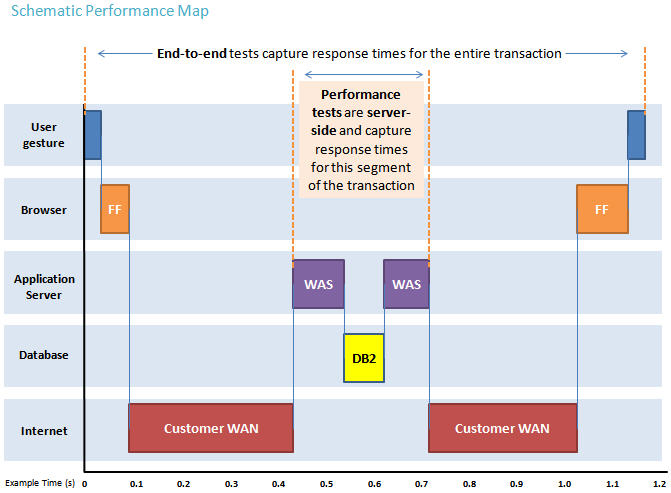
The diagram below describes at a very high level which aspects of the entire end-to-end experience (human end-user to server and back again) that our performance tests simulate. The tests described in this article simulate a segment of the end-to-end transaction as indicated in the middle of the diagram. Performance tests are server-side and capture response times for this segment of the transaction.
Findings
Performance goals
- Verify that there are no performance regressions between current release and prior release.
Findings
- DM ETL of JTS, CCM and QM has similar ETL throughput for 4.0.5 and 4.0.4.
- A design change in RM 4.0.5 results in properly loading all the data artifacts. RM 4.0.4 and prior releases inadvertently loaded only the first 100 artifacts in a module. This defect was fixed in RM 4.0.5 and tracked as "Modules only loading 100 children in DW" (79475). Consequently, 4.0.4 DM ETL of RM and Star appear faster, but this is because they were incomplete. 4.0.5 DM ETL of RM and Star appear approximately 10% slower compared to 4.0.4, but they are now complete and more accurate. See Appendix C for more details.
- JAVA ETL of JTS, CCM, QM and Star has similar ETL throughput for 4.0.5 and 4.0.4.
- A design change in RM 4.0.5 results in properly loading all the data artifacts. RM 4.0.4 and prior releases inadvertently loaded only the first 100 artifacts in a module. This defect was fixed in RM 4.0.5 and tracked as "Modules only loading 100 children in DW" (79475). Consequently, 4.0.4 JAVA ETL of RM appears faster, but this is because it was incomplete. 4.0.5 JAVA ETL of RM appears approximately 24% slower compared to 4.0.4, but it is now complete and more accurate. See Appendix C for more details.
Topology
The topology under test is based on
Standard Topology (E1) Enterprise - Distributed / Linux / DB2.

The specifications of machines under test are listed in the table below. Server tuning details are listed in
Appendix A
This report used the same test environment and same test data to test the ETL performance for CLM 4.0.4 and CLM 4.0.5. Test data was generated using automation. The test environment for the latest release was upgraded from the earlier one by using the CLM upgrade process. To create four VMs, one X3550 M3 (at 2.67 GHz, 48 GB RAM, and 12 physical cores) was used. In the topology, four CLM applications (JTS, CCM, QM, and RM) were installed on VM1; the CLM repository was installed on VM2; the Data Manager ETL tool was installed on VM3; and the data warehouse was installed on VM4.
The same software configuration was used for both CLM 4.0.4 and CLM 4.0.5. The WebSphere Application Server was version 8.5.1, 64-bit. The database server was IBM DB2 9.7.5, 64-bit. The Rational Reporting for Development Intelligence tool was version 2.0.5. The Jazz Team Sever, CCM, QM, and RM applications co-existed in the same WebSphere Application Server profile. The JVM was set to use an 8 GB heap with a 1 GB nursery. Server tuning details listed in
Appendix A
IBM Tivoli Directory Server was used for managing user authentication.
| Function |
Number of Machines |
Machine Type |
CPU / Machine |
Total # of CPU Cores/Machine |
Memory/Machine |
Disk |
Disk capacity |
Network interface |
OS and Version |
| ESXServer1 |
1 |
IBM X3550 M3 7944J2A |
1 x Intel Xeon E5-2640 2.5 GHz (six-core) |
12 vCPU |
36GB |
RAID0 SAS x3 300G 10k rpm |
900G |
Gigabit Ethernet |
ESXi4.1 |
| JTS/RM Server |
1 |
VM on IBM System x3550 M3 |
ESX Server 1 |
4 vCPU |
16GB |
|
120G |
Gigabit Ethernet |
Red Hat Enterprise Linux Server release 6.2 |
| Database Server |
1 |
VM on IBM System x3550 M3 |
ESX Server 1 |
4 vCPU |
16GB |
|
120G |
Gigabit Ethernet |
Red Hat Enterprise Linux Server release 6.2 |
| RRDI Development Tool |
1 |
VM on IBM System x3550 M3 |
ESX Server 1 |
2 vCPU |
4GB |
|
120G |
Gigabit Ethernet |
Windwos 2008 Enterprise R2 |
| ESX Server2 |
1 |
IBM X3550 M3 7944J2A |
1 x Intel Xeon E5-2640 2.5GHz (six-core) |
12 vCPU |
36GB |
RAID0 SAS x3 300G 10k rpm |
900G |
Gigabit Ethernet |
ESXi4.1 |
| CCM Server |
1 |
VM on IBM System x3550 M3 |
ESX Server 2 |
4 vCPU |
16GB |
|
120G |
Gigabit Ethernet |
Red Hat Enterprise Linux Server release 6.2 |
| QM Server |
1 |
VM on IBM System x3550 M3 |
ESX Server 2 |
4 vCPU |
16GB |
|
120G |
Gigabit Ethernet |
Red Hat Enterprise Linux Server release 6.2 |
| Data Warehouse Server |
1 |
VM on IBM System x3550 M3 |
ESX Server 1 |
4 vCPU |
16GB |
|
120G |
Gigabit Ethernet |
Red Hat Enterprise Linux Server release 6.2 |
Data volume and shape
The data volume listed in
Appendix B
Network connectivity
All server machines and test clients are located on the same subnet. The LAN has 1000 Mbps of maximum bandwidth and less than 0.3 ms latency in ping.
Methodology
The ETL loads the same test data set for the different releases test on the same test environment. The test data is migrated from older release by the CLM migration. That can help to make sure the performance data is comparable among releases. The test will do the initial load to data warehouse. And then do the delta ETL load against about 10% incremental data based on initial data set.
Results
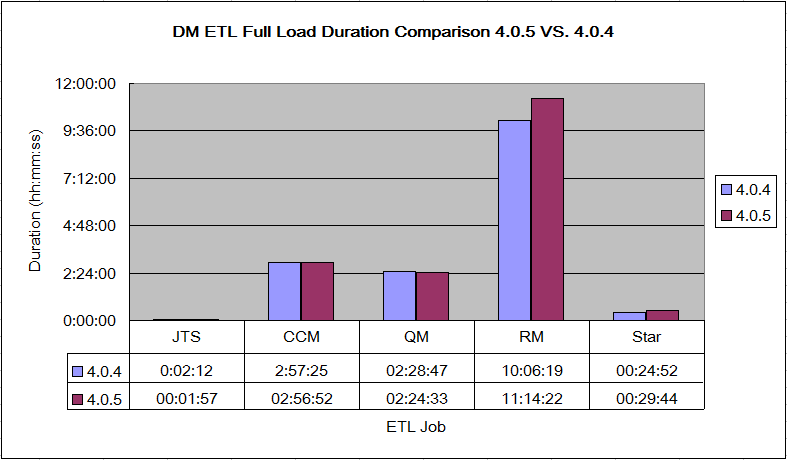
DM ETL Full Load
In the figure below, the performance of JTS, CCM and QM DM ETL has no degradation. But RM and Star DM ETL appear to have about 10% performance degradation because of a defect fix which causes RM to now properly load all the data. The RM defect is tracked as "Modules only loading 100 children in DW" (
79475). Please refer to
Appendix C for more details.
DM ETL Delta Load
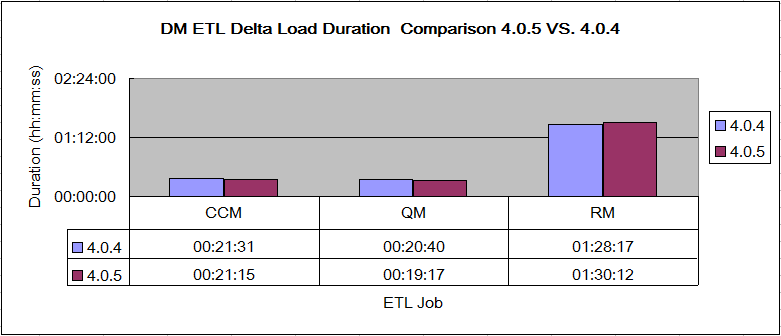
NOTE: Star job does the same calculation based on all the operational data in the data warehouse. The performance of delta Star job is very similar with full Star job. So, we only use the full ETL load to evaluate the performance of Star job.
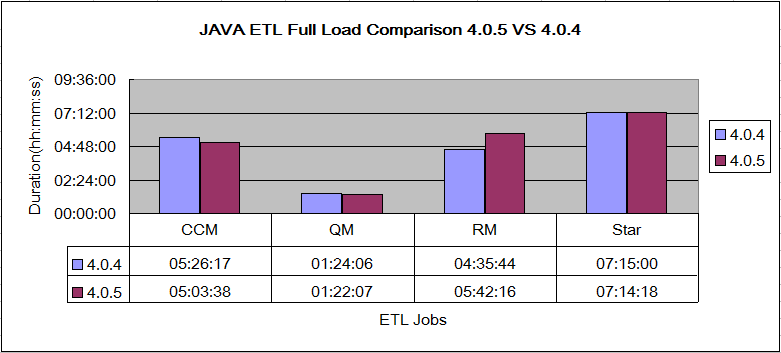
JAVA ETL Full Load
- Precondition: CCM ETL has one build named as Workitembaseline which records the latest info of each workitem by getting the latest workitem history record. When the workitembaseline ETL build is running, the ETL gets the latest info (status, state, priority, severity, etc.) by requesting the latest WI history with the query condition that the change time of the WI history is earlier than the ETL build start time. If there is no ETL schedule one day, the latest info of each workitem on that day are not loaded in the worktiembaseline table of DW. JAVA ETL will fill the WI latest info on the days that have no ETL running. JAVA ETL will get the latest WI history by querying the latest WI's history with the query condition that the change time of the WI history is earlier than the day that the ETL attempts to fill the baseline data. The performance team always uses the same data set to do the ETL performance so that the performance results are comparable. However, JAVA ETL will fill more workitem baseline data on the days from the test data generation day to the actual ETL running day. That means the baseline data of 4.0.5 is slightly more than that in 4.0.4, and that the data of 4.0.4 is slightly more than that in 4.0.3, etc. To improve the comparability of performance data release by release, we insert one pseudo record so that the ETL only inserts a single day's baseline. This way we get the same number of workitembaseline ELT builds inserted.
In the figure below, the performance of JTS, CCM, QM and Star JAVA ETL has no degradation. But RM JAVA ETL appears to have about 24% performance degradation because of a defect fix which causes RM to now properly load all the data. The RM defect is tracked as "Modules only loading 100 children in DW" (
79475). Please refer to
Appendix C for more details.
JAVA ETL Delta Load
- Precondition: CCM ETL has one build named as Workitembaseline which records the latest info of each workitem by getting the latest workitem history record. When the workitembaseline ETL build is running, the ETL gets the latest info (status, state, priority, severity, etc.) by requesting the latest WI history with the query condition that the change time of the WI history is earlier than the ETL build start time. If there is no ETL schedule one day, the latest info of each workitem on that day are not loaded in the worktiembaseline table of DW. JAVA ETL will fill the WI latest info on the days that have no ETL running. JAVA ETL will get the latest WI history by querying the latest WI's history with the query condition that the change time of the WI history is earlier than the day that the ETL attempts to fill the baseline data. The performance team always uses the same data set to do the ETL performance so that the performance results are comparable. However, JAVA ETL will fill more workitem baseline data on the days from the test data generation day to the actual ETL running day. That means the baseline data of 4.0.5 is slightly more than that in 4.0.4, and that the data of 4.0.4 is slightly more than that in 4.0.3, etc. To improve the comparability of performance data release by release, we insert one pseudo record so that the ETL only inserts a single day's baseline. This way we get the same number of workitembaseline ELT builds inserted.
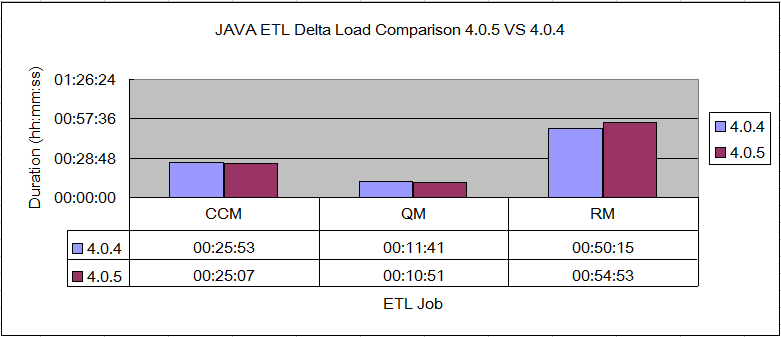
NOTE: Star job does the same calculation based on all the operational data in the data warehouse. The performance of delta Star job is very similar with full Star job. So, we only use the full ETL load to evaluate the performance of Star job.
Appendix A
Product
|
Version |
Highlights for configurations under test |
| IBM WebSphere Application Server |
8.5.0.1 |
JVM settings:
- GC policy and arguments, max and init heap sizes:
-verbose:gc -XX:+PrintGCDetails -Xverbosegclog:gc.log -Xgcpolicy:gencon
-Xmx8g -Xms8g -Xmn1g -Xcompressedrefs -Xgc:preferredHeapBase=0x100000000
-XX:MaxDirectMemorySize=1g
|
| DB2 |
DB2 9.7.5 |
Transaction log setting of data warehouse:
* Transaction log size changed to 40960
db2 update db cfg using LOGFILSIZ=40960
|
| LDAP server |
IBM Tivoli Directory Server 6.3 |
|
| License server |
|
Hosted locally by JTS server |
| Network |
|
Shared subnet within test lab |
Appendix B
|
Record type |
Initial load |
Delta load |
| CCM |
APT_ProjectCapacity |
1 |
1 |
| |
APT_TeamCapacity |
0 |
0 |
| |
Build |
0 |
0 |
| |
Build Result |
0 |
0 |
| |
Build Unit Test Result |
0 |
0 |
| |
Build Unit Test Events |
0 |
0 |
| |
Complex CustomAttribute |
0 |
0 |
| |
Custom Attribute |
0 |
0 |
| |
File Classification |
3 |
3 |
| |
First Stream Classification |
3 |
3 |
| |
History Custom Attribute |
0 |
0 |
| |
SCM Component |
2 |
0 |
| |
SCM WorkSpace |
2 |
1 |
| |
WorkItem |
100026 |
10000 |
| |
WorkItem Approval |
100000 |
10000 |
| |
WorkItem Dimension Approval Description |
100000 |
10000 |
| |
WorkItem Dimension |
3 |
0 |
| |
WorkItem Dimension Approval Type |
3 |
0 |
| |
WorkItem Dimension Category |
2 |
0 |
| |
WorkItem Dimension Deliverable |
0 |
0 |
| |
WorkItem Dimension Enumeration |
34 |
0 |
| |
WorkItem Dimension Resolution |
18 |
0 |
| |
Dimension |
68 |
0 |
| |
WorkItem Dimension Type |
8 |
0 |
| |
WorkItem Hierarchy |
0 |
0 |
|
WorkItem History |
242926 |
20100 |
| |
WorkItem History Complex Custom Attribute |
0 |
0 |
| |
WorkItem Link |
112000 |
10000 |
| |
WorkItem Type Mapping |
4 |
0 |
| RM |
CrossAppLink |
0 |
0 |
| |
Custom Attribute |
422710 |
51010 |
| |
Requirement |
422960 |
51150 |
| |
Collection Requirement Lookup |
1110 |
21000 |
| |
Module Requirement Lookup |
22000 |
2000 |
| |
Implemented BY |
100 |
0 |
| |
Request Affected |
5988 |
0 |
| |
Request Tracking |
0 |
0 |
| |
REQUICOL_TESTPLAN_LOOKUP |
0 |
0 |
| |
REQUIREMENT_TESTCASE_LOOKUP |
0 |
0 |
| |
REQUIREMENT_HIERARCHY |
12626 |
0 |
| |
REQUIREMENT_EXTERNAL_LINK |
0 |
0 |
| |
RequirementsHierarchyParent |
6184 |
0 |
| |
Attribute Define |
10 |
10 |
| |
Requirement Link Type |
176 |
176 |
| |
Requirement Type |
203 |
203 |
| QM |
Record type |
|
Initial load |
Delta load |
| TestScript | | 0 | 0 |
| BuildRecord | | 2000 | 200 |
| Category | | 55 | 12 |
| CategoryType | | 12 | 0 |
| Current log of Test Suite | | 600 | 60 |
| EWICustomAttribute | | 0 | 0 |
| EWIRelaLookup | | | |
| | CONFIG_EXECUTIONWORKITM_LOOKUP | 0 | 0 |
| | EXECWORKITEM_REQUEST_LOOKUP | 0 | 0 |
| | EXECWORKITEM_ITERATION_LOOKUP | 18000 | 1800 |
| | EXECWORKITEM_CATEGORY_LOOKUP | 0 | 0 |
| ExecResRelaLookup | | | |
| | EXECRES_EXECWKITEM_LOOKUP | 54000 | 5400 |
| | EXECRES_REQUEST_LOOKUP | 6001 | 0 |
| | EXECRESULT_CATEGORY_LOOKUP | 0 | 0 |
| | EXECUTION_STEP_RESULT | 0 | 0 |
| ExecStepResRequestLookup | | 0 | 0 |
| ExecutionResult | | 54000 | 5400 |
| ExecutionStepResult | | 0 | 0 |
| ExecutionWorkItem | | 18000 | 1800 |
| Job | | 0 | 0 |
| JobResult | | 0 | 0 |
| KeyWord | | 0 | 0 |
| KeyWordTestScriptLookup | | 0 | 0 |
| LabRequestChangeState | | 0 | 0 |
| LabRequest | | 252 | 25 |
| LabResource | | 2400 | 2640 |
| Objective | | 0 | 0 |
| Priority | | 4 | 0 |
| RemoteScript | | 0 | 0 |
| Requirement | | 0 | 0 |
| Reservation | | 3199 | 320 |
| ReservationRequestLookup | | 3 | 12 |
| ResourceGroup | | 0 | 0 |
| State | | 24 | 0 |
| StateGroup | | 6 | 0 |
| TestCase | | 6000 | 600 |
| TestCaseCustomAttribute | | 0 | 0 |
| TestCaseRelaLookup | | | |
| | TESTCASE_RemoteTESTSCRIPT_LOOKUP | 0 | 0 |
| | TESTCASE_TESTSCRIPT_LOOKUP | 6000 | 600 |
| | TESTCASE_CATEGORY_LOOKUP | 16106 | 1598 |
| | REQUIREMENT_TESTCASE_LOOKUP | 6000 | 0 |
| | REQUEST_TESTCASE_LOOKUP | 6000 | 0 |
| | TestCase RelatedRequest Lookup | 0 | 0 |
| TestEnvironment | | 400 | 0 |
| TestPhase | | 120 | 0 |
| TestPlan | | 11 | 1 |
| TestPlanObjectiveStatus | | 0 | 0 |
| TestPlanRelaLookup | | | |
| | REQUIREMENT_TESTPLAN_LOOKUP | 0 | 0 |
| | TESTSUITE_TESTPLAN_LOOKUP | 600 | 0 |
| | TESTPLAN_CATEGORY_LOOKUP | 0 | 2 |
| | TESTPLAN_TESTCASE_LOOKUP | 6000 | 600 |
| | TESTPLAN_OBJECTIVE_LOOKUP | 0 | 0 |
| | REQUIREMENT COLLECTION_TESTPLAN_LOOKUP | 32 | 0 |
| | TESTPLAN_TESTPLAN_HIERARCHY | 0 | 0 |
| | TESTPLAN_ITERATION_LOOKUP | 120 | 12 |
| | REQUEST_TESTPLAN_LOOKUP | 0 | 0 |
| TestScript | | 6000 | 1200 |
| TestScriptRelaLookup _ Manual | | | |
| | TESTSCRIPT_CATEGORY_LOOKUP | 0 | 0 |
| | REQUEST_TESTSCRIPT_LOOKUP | 0 | 0 |
| TestScriptRelaLookup _ Remote | | 0 | 0 |
| TestSuite | | 600 | 60 |
| TestSuite_CusAtt | | 0 | 0 |
| TestSuiteElement | | 9000 | 900 |
| TestSuiteExecutionRecord | | 600 | 60 |
| TestSuiteLog | | 3000 | 300 |
| TestSuiteRelaLookup | | | |
| | TESTSUITE_CATEGORY_LOOKUP | 1595 | 155 |
| | REQUEST_TESTSUITE_LOOKUP | 0 | 0 |
| TestSuLogRelaLookup | | | |
| | TESTSUITE_TESTSUITELOG_LOOKUP | 3000 | 300 |
| | TESTSUITELOG_EXECRESULT_LOOKUP | 21303 | 2106 |
| | TESTSUITELOG_CATEGORY_LOOKUP | 0 | 0 |
| TestSuiteExecutionRecord_CusAtt | | 600 | 60 |
| TSERRelaLookup | | 0 | 0 |
| | TSTSUITEXECREC_CATEGORY_LOOKUP | 0 | 0 |
| Total | | 251682 | 26300 |
N/A: Not applicable.
Appendix C
A design change in RM 4.0.5 results in properly loading all the data artifacts. RM 4.0.4 and prior releases inadvertently loaded only the first 100 artifacts within modules. This defect was fixed in RM 4.0.5 and tracked as "Modules only loading 100 children in DW" (
79475). In our tests we had more than 100 children in many requirements modules. Consequently, our 4.0.4 ETL run times appear faster because they were incomplete. 4.0.5 DM ETL of RM and Star appear approximately 10% slower compared to 4.0.4, but they are now complete and more accurate. Similarly, 4.0.5 JAVA ETL of RM appears approximately 24% slower compared to 4.0.4, but it is now complete and more accurate.
There is a defect fix which can be applied to releases before 4.0.5 to correct this problem. You can refer to 4.0.4 technote
https://jazz.net/library/article/1334 and
https://jazz.net/library/article/1160#00042.
For more information
About the authors
PengPengWang
Questions and comments:
- What other performance information would you like to see here?
- Do you have performance scenarios to share?
- Do you have scenarios that are not addressed in documentation?
- Where are you having problems in performance?
Warning: Can't find topic Deployment.PerformanceDatasheetReaderComments