Burndown report in RTC is not getting properly
We are using RTC for tracking the tasks of our project.
We had created an 2 week iteration.
After that iteration got over, we generated the burndown report for this iteration.
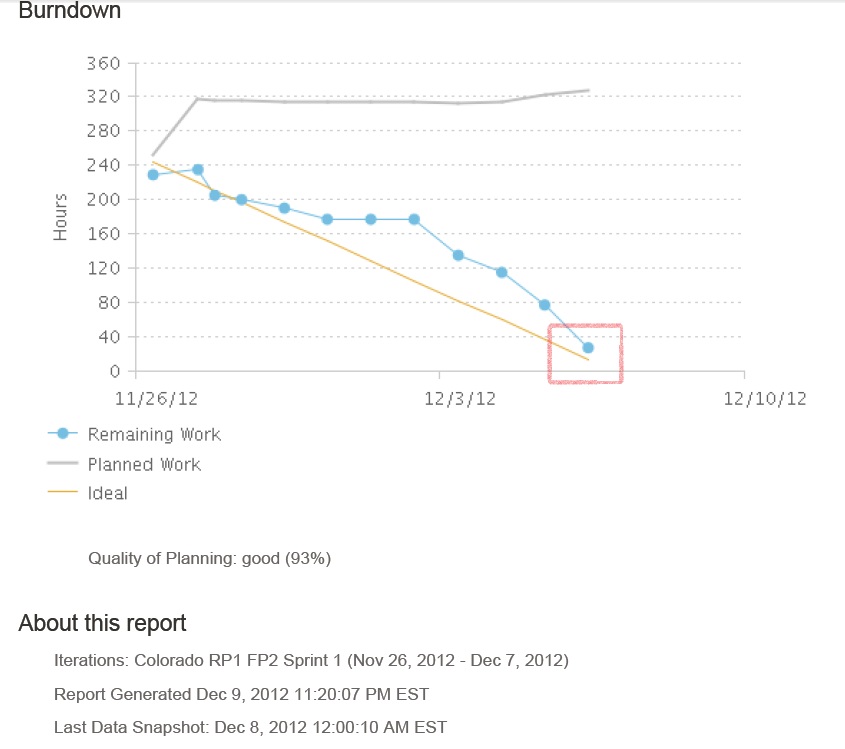
But the burndown report generated is not showing time remaining as 0 hrs though we have closed all the tasks & stories by the end of the sprint & we have also entered time remaining as 0 hrs for each task.

RTC version is 3.0.1.4.
Please help us to resolve this issue.
2 answers
Comments
Hi Rafik,
Thanks for your reply.
We are closing all the work items before the iteration ends but still the burndown report doesn't show the time remaining as 0 hrs. We are also adding time remaining as 0 hrs while closing the work item.
Just want to confirm one thing, our RTC server is hosted in Ottawa, Canada & we are creating & closing work items in RTC client located in India. So there is a time difference. Should this time difference will affect the burndown chart.
Please confirm.
Regards,
Vaibhav
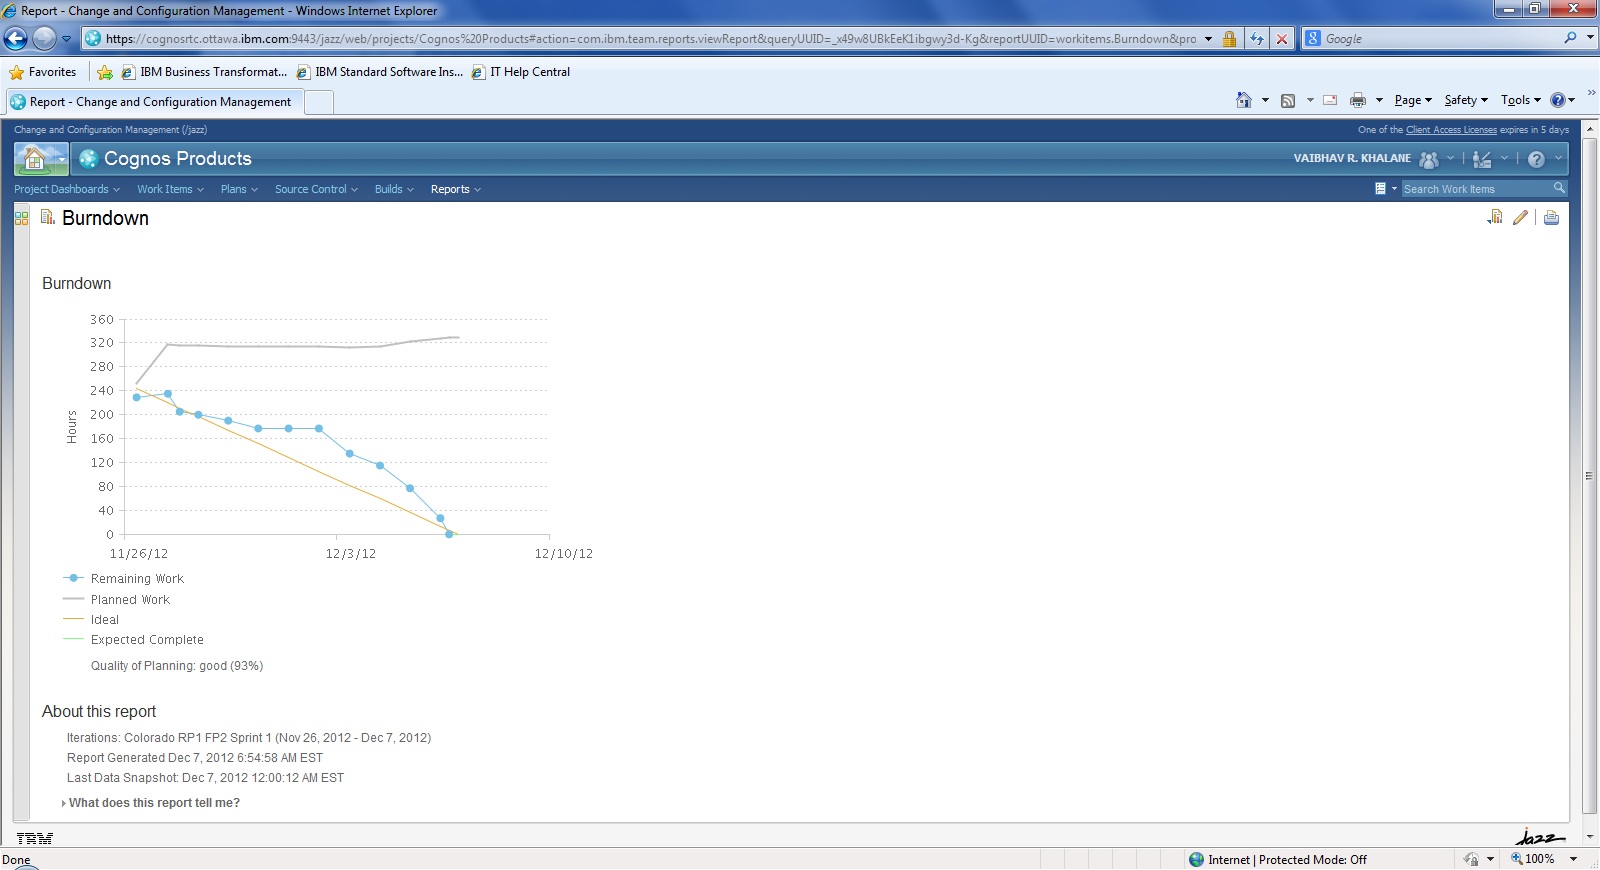
Hi Vaibhav, I can probably explain why the report worked on Dec 7 and not Dec 10. During Dec 7, the iteration was still in progress. So in that case the report tries to compute a live point (the last point) which shows the current live data from the repository and not the data warehouse. My theory is that the ETL had run after the iteration had ended and that is when the zero point was collected. Since that point was collected after the iteration had ended, it will not show up in the Burndown report.
RTC allows you to change the Work Item Type. If someone took a Task and Changed it to a Story but did not delete anything in the time fields (Original Estimate, Corrected Estimate, Effort Tracking), then that work item will throw off your data while hiding the time fields from view. Check the progress bar for the sprint. For example it might say "587/587 hrs". If the left and right don't match but everything is closed, then this might be your problem.
Comments
Alanna Zito
JAZZ DEVELOPER Dec 13 '12, 9:21 a.m.I notice in the "About this report" section that the last data snapshot was taken almost 48 hours before the report was run - can you check whether or not the data collection jobs have run successfully since you closed all the tasks & stories?
Vaibhav Khalane
Dec 18 '12, 4:13 a.m.Hi Alanna,
 -
-
Thanks for your reply.
Actually our sprint end date was 7th Dec & we have closed all the tasks on & before 7th Dec only. So we have run the above report on 10th Dec. It is showing as 9th Dec because our RTC server is hosted in Ottawa, Canada so there is a time difference.
We have also run the same report on 7th Dec after closing all the tasks & at that time it was showing properly, please see below
But when we run this report on 10th Dec then it was not correct.
Also you asked to check the data collection jobs run successfully or not. Please let us know how to check whether data collection jobs have run successfully or not.
Also in the error report, last snapshot was taken on 8th Dec which is later than 7th Dec (last date of sprint1) & we haven't done any changes in the sprint1 after 7th Dec.
So still data collection jobs will run for the sprint 1 though there are no updates? Please confirm.
Alanna Zito
JAZZ DEVELOPER Dec 18 '12, 2:21 p.m.To check the status of the data collection jobs, someone with JazzAdmin privileges needs to go to the admin page (ccm/admin), and look at the Reports -> Data Collection Jobs Status page. That's very strange that the report ran successfully on Dec. 7th, but then started behaving strangely a few days later. Just to confirm, is the report still running incorrectly now?
Vaibhav Khalane
Dec 19 '12, 1:42 a.m.Thanks Alanna for the information.
The report is still running incorrectly & we are not sure why this is happening.
We are trying to check whether Data collection jobs are running successfully or not.
Please let us know if you have any more information on this.