RQM: Mismatch in the fields between Dash board report and Last run results
Under RQM v4.0.6, We have found out an issue, where the dashboard widget and the query results are not matching. The test cases were added in the Test Plan and test case execution
records were generated for the same set of test cases in the test plan
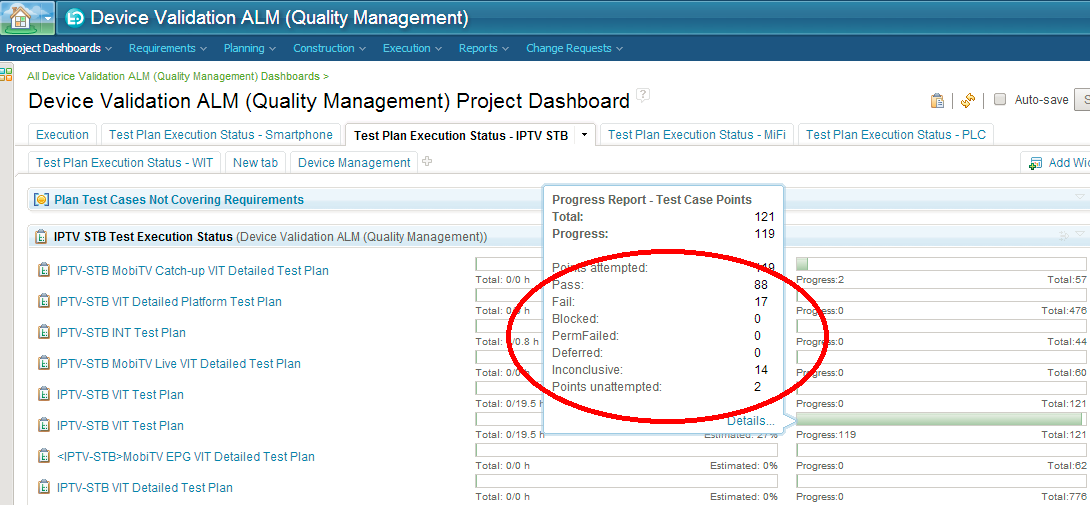
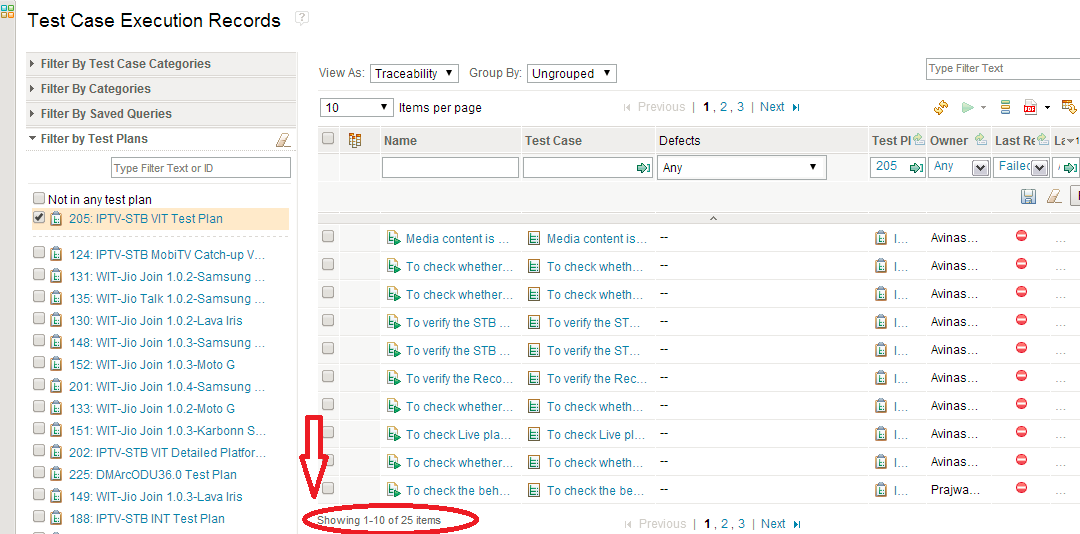
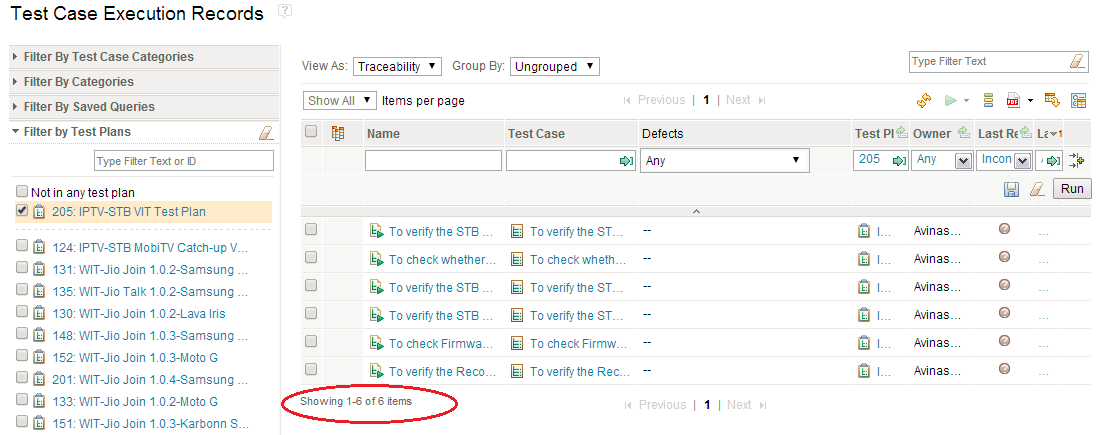
The hover values in the "Dashboard Execution Status.png" is not matching with the query values in "Query giving Detailed Information - Failed.PNG" and "Query giving Detailed Information - Inconclusive.PNG" resulted from clicking the details on the widget.
"Dashboard Execution Status.png"
"Query giving Detailed Information - Failed.PNG"
"Query giving Detailed Information - Inconclusive.PNG"
The actual Failed TCER count are 25, however, it is showing 17 in the hover.
The actual Inconclusive TCER count is 6, however, it is showing 14.
The erroneous count is also showing in the Pie Chart view for widget Test Plan Execution Status..!!
.
records were generated for the same set of test cases in the test plan
The hover values in the "Dashboard Execution Status.png" is not matching with the query values in "Query giving Detailed Information - Failed.PNG" and "Query giving Detailed Information - Inconclusive.PNG" resulted from clicking the details on the widget.
"Dashboard Execution Status.png"
"Query giving Detailed Information - Failed.PNG"
"Query giving Detailed Information - Inconclusive.PNG"
The actual Failed TCER count are 25, however, it is showing 17 in the hover.
The actual Inconclusive TCER count is 6, however, it is showing 14.
The erroneous count is also showing in the Pie Chart view for widget Test Plan Execution Status..!!
.
One answer
Some RQM built-in reports are based on live data, some are based on ETL data (data warehouse). In your above example, the total of TCER of failed and inconclusive states is 31, both in the report and the query. So I would guess your report is based on ETC data and there is a "delay". Can you check whether 8 of the inconclusive TCERs got converted to "failed" after the last ETL was run? Actually, if there are no changes to the TCERs for a day or two (which allows the ETL to collect the latest data), you will no longer see this problem.