How to geenrate S curve based on number of test cases present in a plan and number of test cases executed?
We are using RQM 4.0.4 and we want to generate S-curve based on number of test cases present in a plan and number of test cases executed..Had a investigation on Execution trend report but its based on Weight points..but we are presently not using weight points to determine the complexity of test case..
So we need to generate the S-curve based on total number of cases present and total number of cases executed..can somebody guide me
So we need to generate the S-curve based on total number of cases present and total number of cases executed..can somebody guide me
2 answers
Hello Gururaja,
like I wrote in my last answer in the entry: https://jazz.net/forum/questions/138073/how-to-draw-s-curve-for-expected-and-actual-for-a-test-plan?page=1&focusedAnswerId=138139#138139
There are two ways to do that:
1) Simple "out of the box" way:
I would be happy, if you would provide me any feedback, if does it help or not
Thanks and regards,
Thomas
like I wrote in my last answer in the entry: https://jazz.net/forum/questions/138073/how-to-draw-s-curve-for-expected-and-actual-for-a-test-plan?page=1&focusedAnswerId=138139#138139
There are two ways to do that:
1) Simple "out of the box" way:
Just to be sure we are on the same page, you wrote: "we are presently not using weight points to determine the complexity of test case", but weight points do represent, what you define they have to present. So it depends on you to define the meaning, weight points not necessary be used to define complexity of a test case.2) Using Rational Reporting for Development Intelligence (RRDI) for custom reporting
In other words; a sample for your scenario could be:
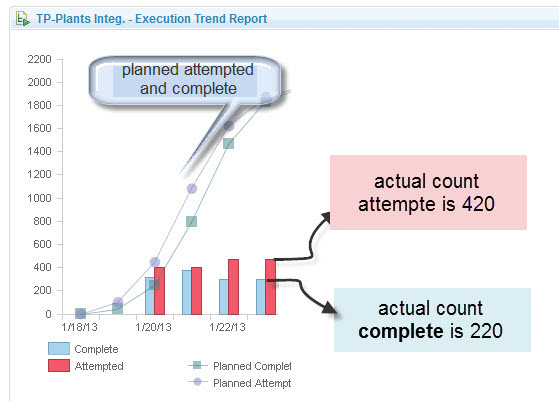
a) One Point represents one test case execution record
b) The attempt count will reflect the actual count of all the executed "test case execution record"
c) The complete count will reflect the actual count of the successfully executed "test case execution record" based on there current result.
d) You can define your own planed attempt and complete count for specific dates inside your iteration planning.
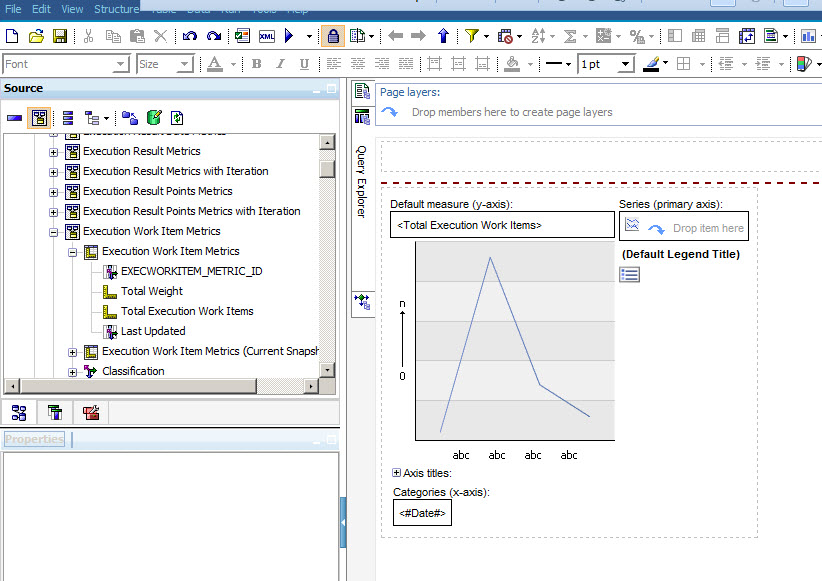
To implement custom reports and trend charts you must learn how to use IBM Rational Reporting for Development Intelligence (RRDI) here is the link to the tutorial inside the clm help: http://pic.dhe.ibm.com/infocenter/clmhelp/v4r0m5/nav/4_1
Here the download page https://jazz.net/downloads/rational-quality-manager/releases/4.0.5?p=optionalPrograms.
Hera are the installation instructions: http://pic.dhe.ibm.com/infocenter/clmhelp/v4r0m5/topic/com.ibm.rational.rrdi.admin.doc/topics/c_install_plan_overview.html
I would be happy, if you would provide me any feedback, if does it help or not
Thanks and regards,
Thomas
Comments
Thanks Thomas...i got your point..we have another issue...we have Master test plan such as "Atlas Iteration1" having more than 20 child test plans.. and all these child test plans are executed simultaneously by different resources..
My Query is ..Do i need to set the test schedule for each of these child test plans or just need to set the test schedule only for Master test plan to get Execution trend report?
Hello Gururaja,
ok, then you need RRDI, with this solution I expect you will be able to define a chart to reflect what you need.
Regards,
Thomas
ok, then you need RRDI, with this solution I expect you will be able to define a chart to reflect what you need.
Regards,
Thomas