widget queries entries does not show up by default in personal dashboard ?
I created a personal dashboard .
In my main project dashboard, there is a tab and I link it to my personal dashboard.
Main Project dashboard Tab
In my main project tab, I added a widget which query SVT defects.
The defect query results automatically show up in the widget
Personal dashboard Tab
Then in my personal dashboard, I also include the exact same query for SVT defects.
However, the defect query results will not show up automatically.
I have to manually click on header link , then a new window will launch and the query results will show up.
How can I get the query result to show up automatically just the same as that in main project dashboard?
Please see attached screen shot.
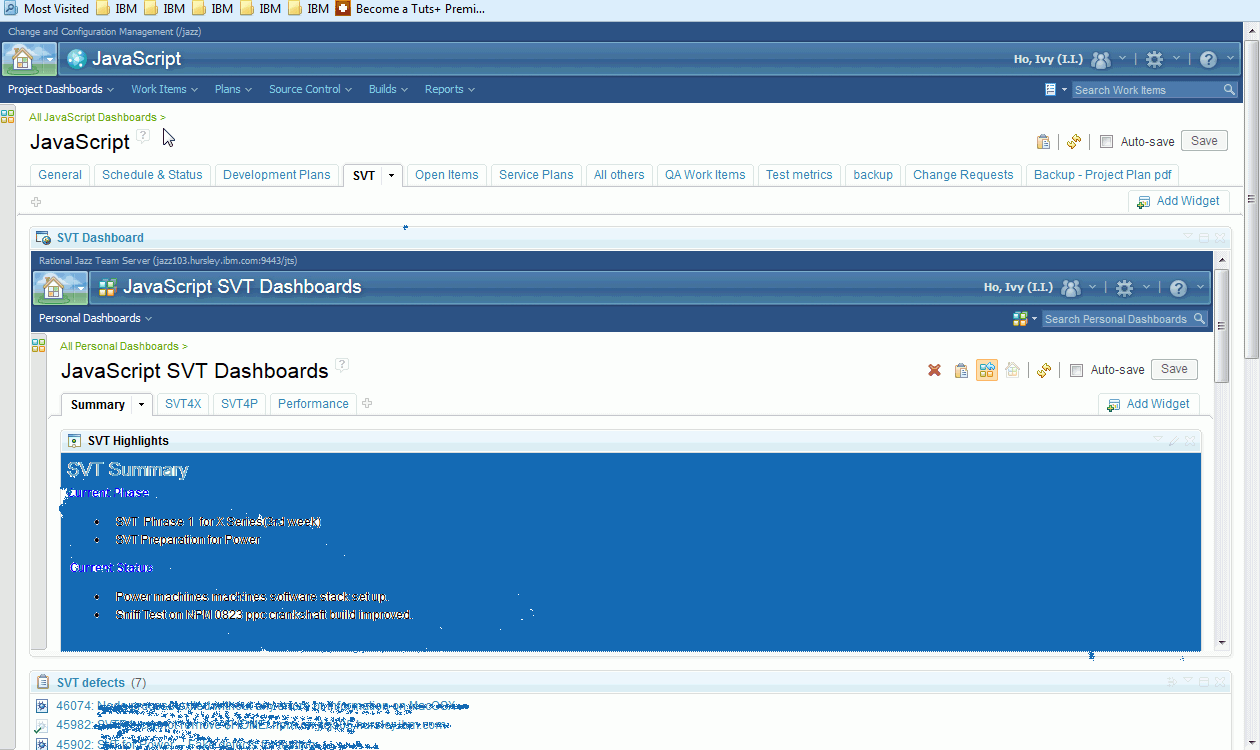
the maindashboard.gif show that under the SVT tab of the main project dashboard,
I have my personal dashboard and the SVT defect query.-Q1
The query results show up automatically.

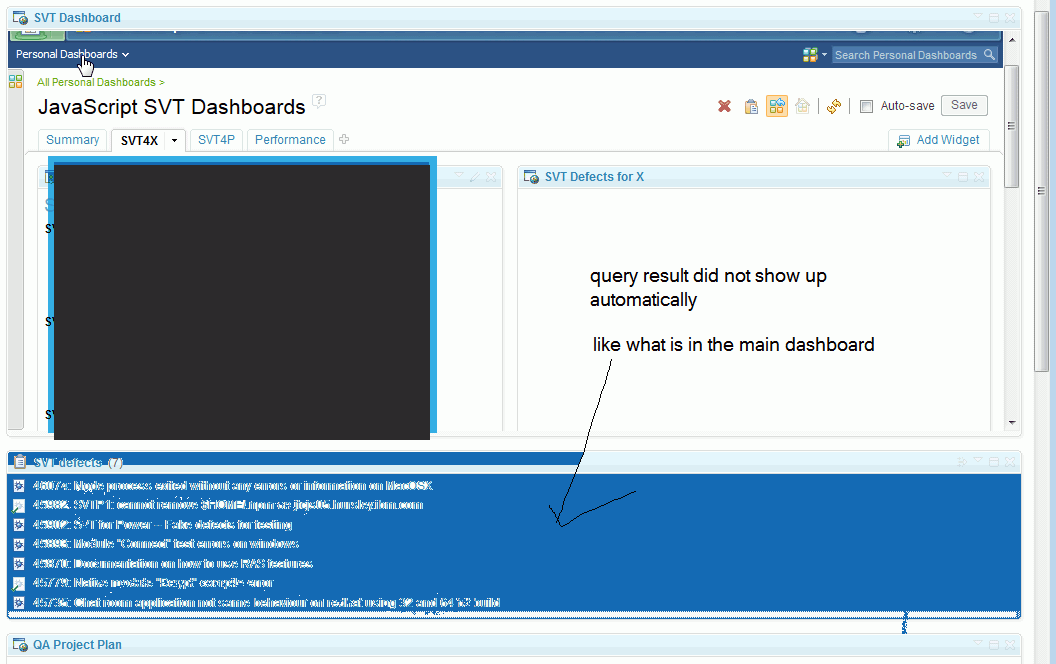
The dashboard question.gif -- shows my personal dashboard.
Inside there under tab SVT4X, I also have SVT query (same query I used in main dashboard Q1).
But the query result did not show up by default?

What I did to do is to click on the SVT defect for X and then a new window will be launched and the query results will be displayed.
But I would like the query results to be dsplayed automatically in the same view - just the same way as the main project dashboard widget SVT query.
Thanks in advance for your help.
In my main project dashboard, there is a tab and I link it to my personal dashboard.
Main Project dashboard Tab
In my main project tab, I added a widget which query SVT defects.
The defect query results automatically show up in the widget
Personal dashboard Tab
Then in my personal dashboard, I also include the exact same query for SVT defects.
However, the defect query results will not show up automatically.
I have to manually click on header link , then a new window will launch and the query results will show up.
How can I get the query result to show up automatically just the same as that in main project dashboard?
Please see attached screen shot.
the maindashboard.gif show that under the SVT tab of the main project dashboard,
I have my personal dashboard and the SVT defect query.-Q1
The query results show up automatically.

The dashboard question.gif -- shows my personal dashboard.
Inside there under tab SVT4X, I also have SVT query (same query I used in main dashboard Q1).
But the query result did not show up by default?

What I did to do is to click on the SVT defect for X and then a new window will be launched and the query results will be displayed.
But I would like the query results to be dsplayed automatically in the same view - just the same way as the main project dashboard widget SVT query.
Thanks in advance for your help.
2 answers
Hi Ivy,
I'm not sure if I'm missing something here in my understanding.. It looks to me like in both of your screenshots that the query results are displayed for the SVT Defects query. I used a simple Worik Items widget in both my personal dashboard and Project Area dashboard and both displayed the query results with no issue upon loading the dashboard.
Comments
Hi Marek: Thanks for helping out.
If I invoke my personal dashboard directly (e,g https://jazz103.hursley.ibm.com:9443/jts/dashboards/677/tab_2 from browser), the query will automatically be loaded as expected.
However, in this particular scenario, my personal dashboard is nested under one of the tab inside the main project dashboard, then the query will not be loaded automatically. So the URL in the browser will be UL of the main prioject
dashbaord. (e.g https://jazz103.hursley.ibm.com:9443/jazz/web/projects/JavaScript#action=com.ibm.team.dashboard.viewDashboard&tab=_16)
I wonder if something is being blocked. by the browser.