Status takes hours with JSon
Hi,
we are using RTC via command-line tool scm.exe. When developer returns to a project after a while and runs scm.exe status -d "c:\sandbox\project" -w -I -i "in:b" -j
then in case there are a lot of incoming baselines, it takes for example 3 hours or more. Note: without parameter -j there is no such delay, but we need JSon output. Is there any workaround?
3 answers
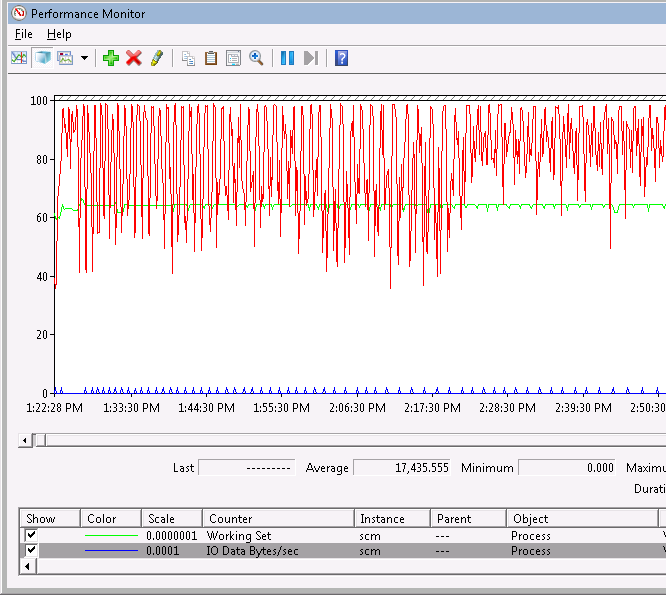
I've seen this CPU usage pattern in other Java applications (your scm.exe process is a Java/Eclipse application) when they are very low on Java heap memory and are spending all their time garbage collecting.
Trying increasing the JVM heap size for scm.exe: edit the startup file
<RTC-install-directory>/scmtools/eclipse/scm.ini
and increase the maximum JVM heap from the default 512 MB:
-Xmx512m
to 1 GB:
-Xmx1g
Other things to consider:
- Do you have at least 4 GB RAM on this machine?
- If it's a VM image, it is being allocated enough physical hardware resources?
Please let me know if this solves your problem.
-Matt Lennon
Comments
Hello Matt,
my machine is virtual with 4 GB RAM and Win7 x64. I have tried RTC server/client 4.0 and 4.0.2 with increased heap to 1.7GB, but with no effect.
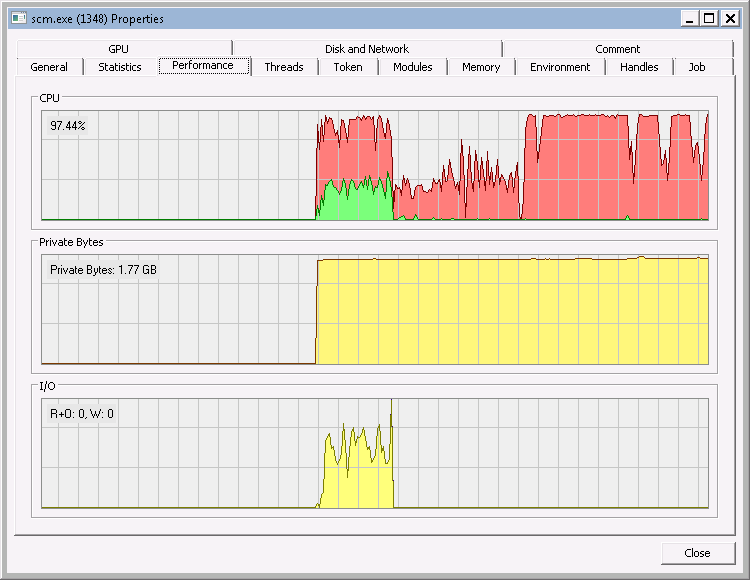
After scm.exe starts, there is huge communication between client and server (e.g. 10 MB/s), but after a few minutes it drops to 100 B/s. We fought that is a server problem, but our RTC admin doesn't found anything.
Hmmm. Try enabling the "metronome" debug feature to see what requests the client is making to the server and how long they are taking:
o Create a "debug.options" file with these options:
com.ibm.team.filesystem.cli.core/debug=true
com.ibm.team.filesystem.cli.core/debug/trips=true
o Re-run your scm command, but add this flag to the end:
scm.exe <the-regular-parameters> -debug debug.options
It will print a bug of debug output, including statistics like this:
Service Trip Statistics:
Interface/method Calls Time
IRepositoryRemoteService 8 1647ms
fetchOrRefreshItems 8 1647ms
IScmRestService......... 1 14732ms
getWorkspaces 1 14732ms
-- Total time in service calls: 16379ms
Ok, here are results. I increased java heap to 1512 MB, it takes 2,5 hours to get status in JSon format, the JSon output has 48 MB.
Service Trip Statistics:
Interface/method Calls Time
IFilesystemService................. 249 51854ms
compareWorkspaces 1 4429ms
getCompatabilityLevel............ 1 24ms
getComponentStateSummaries 1 48ms
interpretChanges2................ 246 47353ms
IRepositoryRemoteService 537 24415ms
fetchOrRefreshItems.............. 537 24415ms
IScmQueryService 51 1769ms
findComponentOwners.............. 25 846ms
findDetailedComponentVisibilities 25 853ms
findLocks........................ 1 70ms
IScmService 25191 970537ms
compareChangeHistories........... 8385 257143ms
getChangeSetLinkSummaries 16770 708587ms
getContributorState.............. 1 336ms
refreshWorkspaces 35 4471ms
-- Total time in service calls: 1 048 575ms
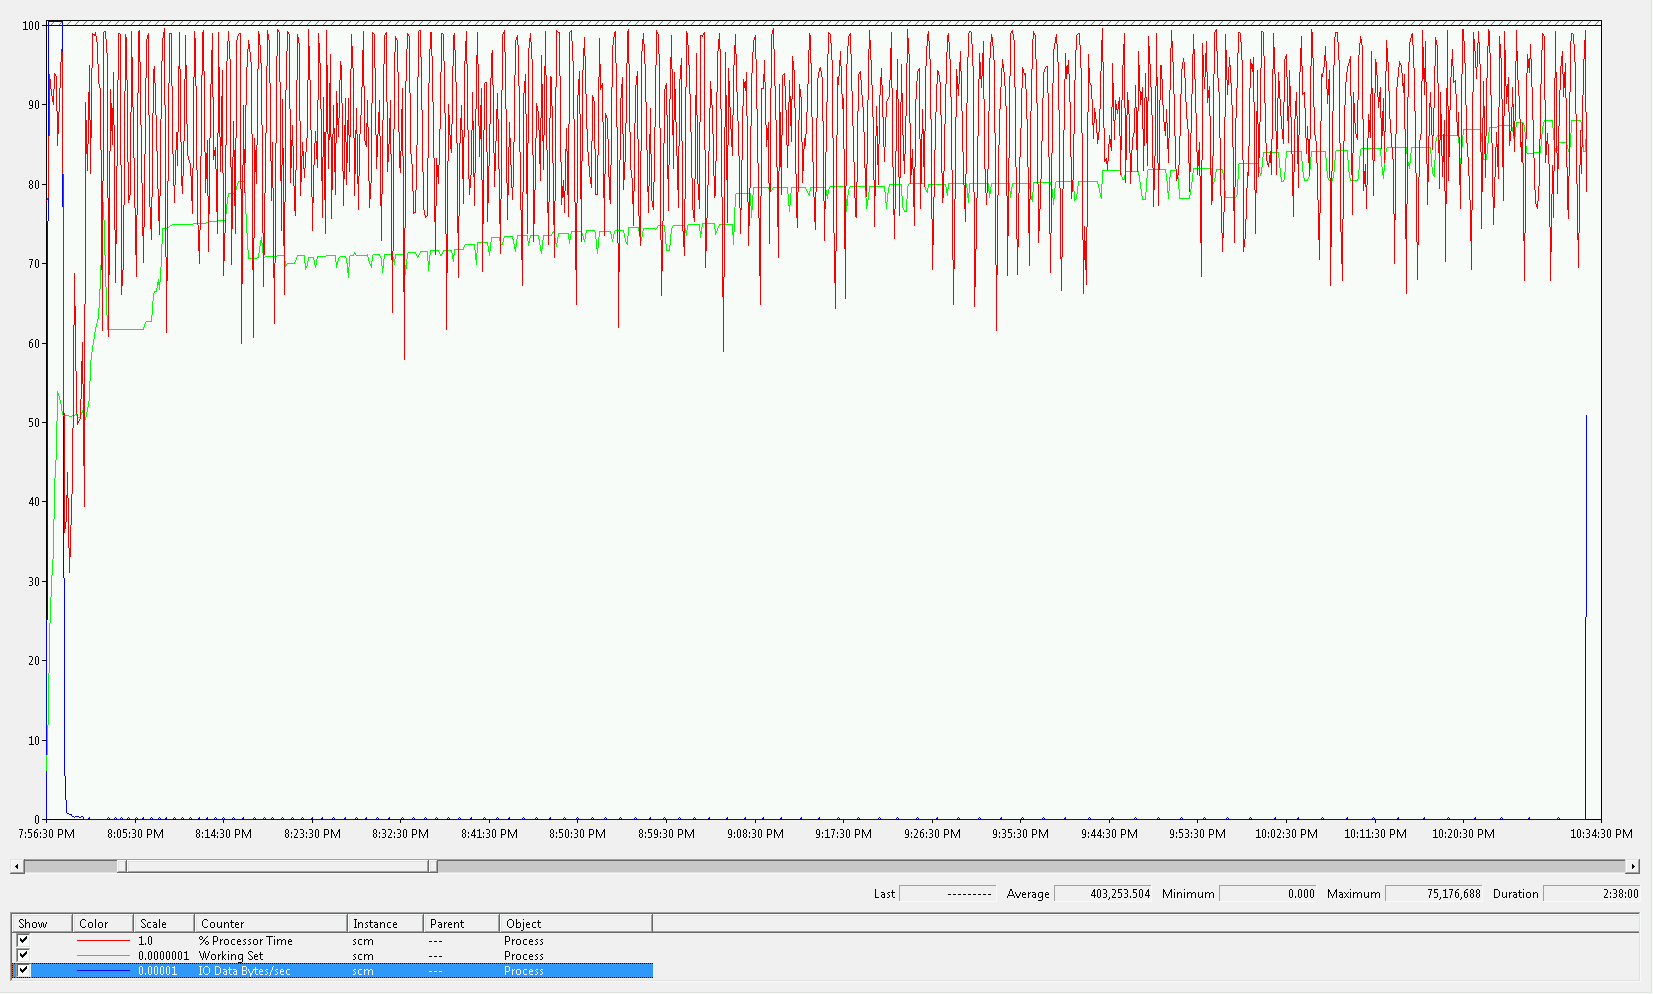
Total time is 1048 s ~ 17,5 minutes, that seems client - server communication takes only minor part of total status time. Graph from perfmon is below.
Is there anything else, we can do?
This was in the log, maybe it will help:
Start VM: -Xshareclasses
-Xquickstart
-Dosgi.requiredJavaVersion=1.6
-Xmx1512m
-Djava.class.path=C:\Program Files (x86)\IBM\Rational Team Concert Client for Microsoft Visual Studio IDE\3rd Party\scmtools\eclipse\plugins\org.eclipse.equinox.launcher_1.1.1.R36x_v20101122_1400.jar
-os win32
-ws win32
-arch x86
-showsplash
-launcher C:\Program Files (x86)\IBM\Rational Team Concert Client for Microsoft Visual Studio IDE\3rd Party\scmtools\eclipse\scm.exe
-name Scm
--launcher.library C:\Program Files (x86)\IBM\Rational Team Concert Client for Microsoft Visual Studio IDE\3rd Party\scmtools\eclipse\plugins\org.eclipse.equinox.launcher.win32.win32.x86_1.1.2.R36x_v20101222\eclipse_1312.dll
-startup C:\Program Files (x86)\IBM\Rational Team Concert Client for Microsoft Visual Studio IDE\3rd Party\scmtools\eclipse\plugins\org.eclipse.equinox.launcher_1.1.1.R36x_v20101122_1400.jar
-configuration @user.home/.jazz-scm/configuration/4.0.2.0-RC1-RTC-I20130206-1311
-data @noDefault
-a n status
-d D:\Sandbox\tstbx
-w
-I
-i in:b
-j
-debug debug.options
-vm C:\Program Files (x86)\IBM\Rational Team Concert Client for Microsoft Visual Studio IDE\3rd Party\scmtools\eclipse\\../../jre/bin\j9vm\jvm.dll
-vmargs
-Xshareclasses
-Xquickstart
-Dosgi.requiredJavaVersion=1.6
-Xmx1512m
-Djava.class.path=C:\Program Files (x86)\IBM\Rational Team Concert Client for Microsoft Visual Studio IDE\3rd Party\scmtools\eclipse\plugins\org.eclipse.equinox.launcher_1.1.1.R36x_v20101122_1400.jar
Hi Matt,
I had done a new measurement (please see my next answer in this topic) and I had noticed, that a scm.exe memory usage is increasing almost linear. That seems, there isn't problem with garbage collector. I think, creating JSon output is internally in scm.exe done in some inefficiently way (without creating JSon, scm.exe ends in 3 minutes instead of almost 3 hours with JSon), so there is probably nothing I can do :( am I right?
Hi David.
This sounds like a bug. Please submit a defect via jazz.net or PMR and include any relevant details such as:
o The exact command you're running
o The workspace you're running the command against: approx. number of components & files, etc.
o RTC client & server versions
o Anything other info you think might be useful to help us debug this
Thanks!
-Matt
Ok, thanks Matt.
I believe that using WAIT tool could be useful: https://wait.ibm.com/
Hi Krzysztof,
I was unable to find the javacore file, I will try again today.
Hi Krzysztof,
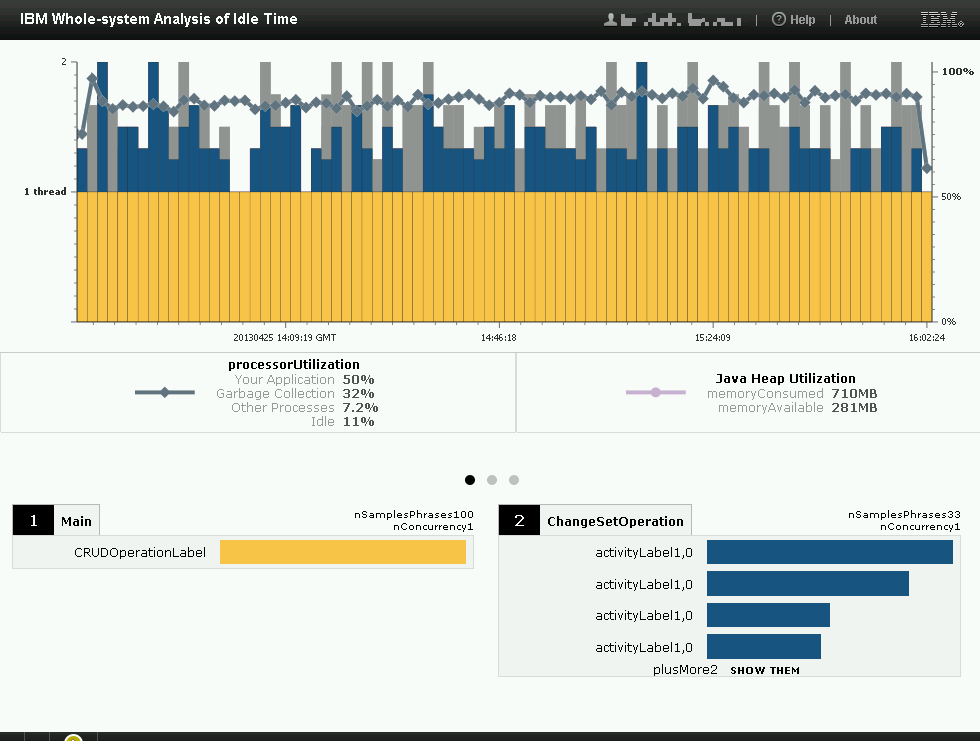
I had SCM as Visual Studio plug-in in 32b version on 64b machine, Wait script didn't work with that. So I uninstalled VS plug-in a installed Eclipse SCM plug-in in 64b version. Screen of results are attached below, I think there is no problem with garbage collector.
Comments
Hi David,
Well working Garbage collector for more than 30% of the time is not something expected. It is interesting which objects are using the most of the memory. Matt, do you have any idea what it can be?
David, I believe that we need heap dump from scm command running. Could you add following line to scm.ini file:
-Xdump:heap+java:events=systhrow+user,request=exclusive+prepwalk
Then you can start wait tool after 5 minutes of running. This will generate heap file. You can use MAT tool to analyze this file:
http://eclipse.org/mat/ (you will need to install additional plugin to analyze IBM Java heapdumps: http://www.ibm.com/developerworks/java/jdk/tools/dtfj.html)
Alternatively you can open new PMR and support will do all this stuff for you.
Hi all,
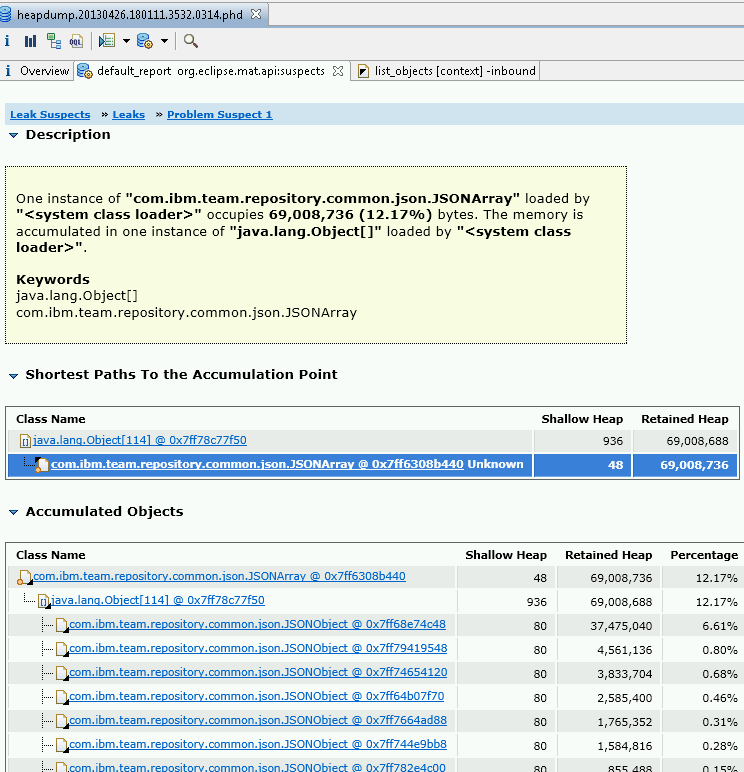
DTFJ install was a bit tricky, there shouldn't be checked "Group items by category" in Eclipse dialog. Anyway, there is some screen from Memory Analyzer app, complete dump/Wait log will be attachet to [PMR 86173,550,000] next week. Cheers!
Actually the WAIT data you gathered to generate that WAIT report is exactly what we need - it contains Java heap dumps plus other info about your system. Can you send us the waitData.zip file? If you open a PMR then you can upload it via the PMR mechanism.
The "CRUDOperationLabel" thing in the WAIT report has one of your CPUs pegged - seeing the thread dump/stack trace for that should help us identify the problem.
-Matt