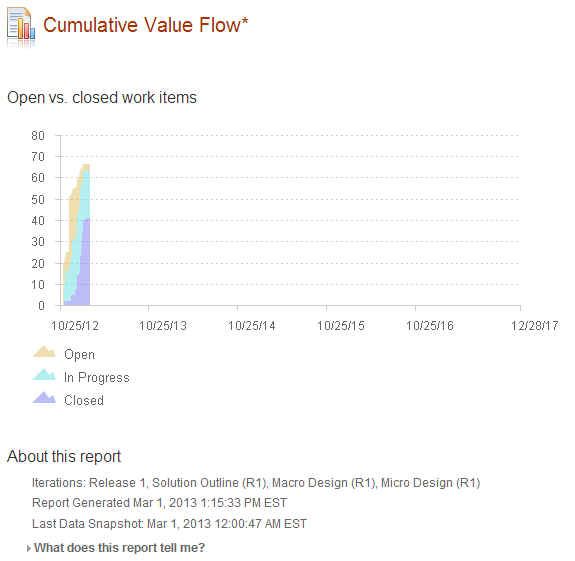
Why do report time lines not use up more of the horizontal real estate? They crunch the data to the left when clearly we won't have enough data to fill this graph for 4 years. Is there anyway to control this OOTB functionality?
Dashboards and work items are no longer publicly available, so some links may be invalid. We now provide similar information through other means.
Learn more here.
Comments
Kevin Ramer
Mar 01 '13, 1:39 p.m.What is the most future end time of the iterations you've selected ? Maybe that is chosen as a guide for the right end of the x-axis.