How can I make two queries and divide the results within Report Builder?
Hello,
I have a task to solve and I do not find the right way to do this in Report Builder. As this is my first post I hope that I do everything right. Please tell me if something is wrong so that I can improve.
clm is version 6.0.5
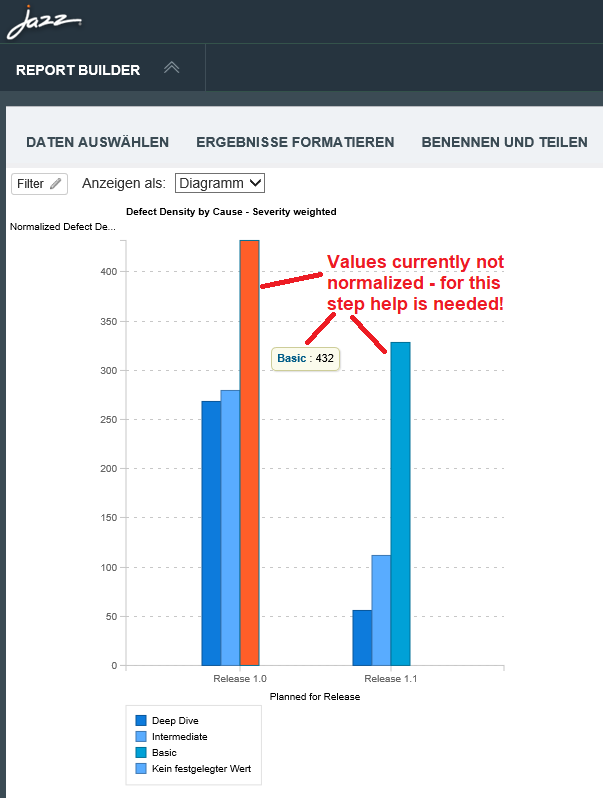
The result of my report should be a bar graph with normalized number of weighted defects over two different releases split into cause classes. I already managed to build a graph in Report Builder that displays the number of weighted defects grouped by release and split into different cause class. However what's missing is the normalization of the bars. I have a screenshot available of the current state but not able to upload because of missing reputation points.
in a standard MS SQL Server 2014 express installation the following SQL code calculates the normalized defect density for a single value over a dummy database 'dbo.workitem' correctly:
Declare @numerator int;
Declare @denominator int;
Declare @trend int;
Set @numerator = ( Select
(SUM (CASE WHEN severity = 'Low' THEN 1 ELSE 0 END) +
2 * SUM (CASE WHEN severity = 'High' THEN 1 ELSE 0 END))
release
From dbo.workitem
WHERE Type = 'defect' AND release = 'Release 1.1');
Set @denominator = ( Select Count(type)
From dbo.workitem
WHERE Type = 'CR' AND release = 'Release 1.1');
if @denominator > 0
set @trend = @numerator / @denominator;
select convert (varchar(10), @trend);
The @numerator part works fine in the Report Builder as documented in the screenshot. But I did not manage to get the @denominator into the report. I tried with variable declarations in advanced mode but only got error messages on it. The same happens when I try to do the division in the select itself.
I tried the calculation possibilities in the table formatting area without success as I was not able to select a second type for the filter on 'CR'
Could anybody please help me and send tipps and tricks for Report Builder to do this different filtering (select on type 'defect' for numerator and type 'CR' for denominator and calculation of the division of both in the tool?
any kind of link to similar examples would be also fine.
If there is a better way to do this analysis please let me know. I would be very happy to learn more about the Report Builder functionalities available to resolve such analysis tasks.
many thanks in advance for all your help!
best regards
Hubert
Comments
Ralph Schoon
FORUM ADMINISTRATOR / FORUM MODERATOR / JAZZ DEVELOPER Nov 29 '18, 8:01 a.m.Fariz Saracevic
FORUM MODERATOR / JAZZ DEVELOPER Nov 29 '18, 8:12 a.m.Here is link to multiple Y-axis in case it can help in this case https://jazz.net/pub/new-noteworthy/jrs/6.0.6/6.0.6/index.html#3.
Hubert Zenner
Nov 29 '18, 8:42 a.m.The result should be a single axis chart with the normalized weighted defect count. Normalized means that the number of defects (weighted) is divided by the overall number of changes in the same release.
Ralph Schoon
FORUM ADMINISTRATOR / FORUM MODERATOR / JAZZ DEVELOPER Nov 30 '18, 3:26 a.m.Here what he wants to achieve: