Report builder - display additional parameters in the X axis in graph report
Hello all,
I have created a graph report via report builder,
in this report in X axis the test-case-result ID's are displayed (unique value)
And in the Y axis the measurement value that I want to measure is displayed
Is it possible to add / display additional values in X axis?
I mean - beside of the test-case-result ID to display additional parameters -
like test-case-result creation date etc.?
Tanks in advance,
Rachel
One answer
Hi Rachel,
Since this is a 2D graph, at a time we can have only one Attribute for the X axis.
So I am not sure, if you mean by additional parameters along with Test Result ID is possible on X axis, I am afraid not.
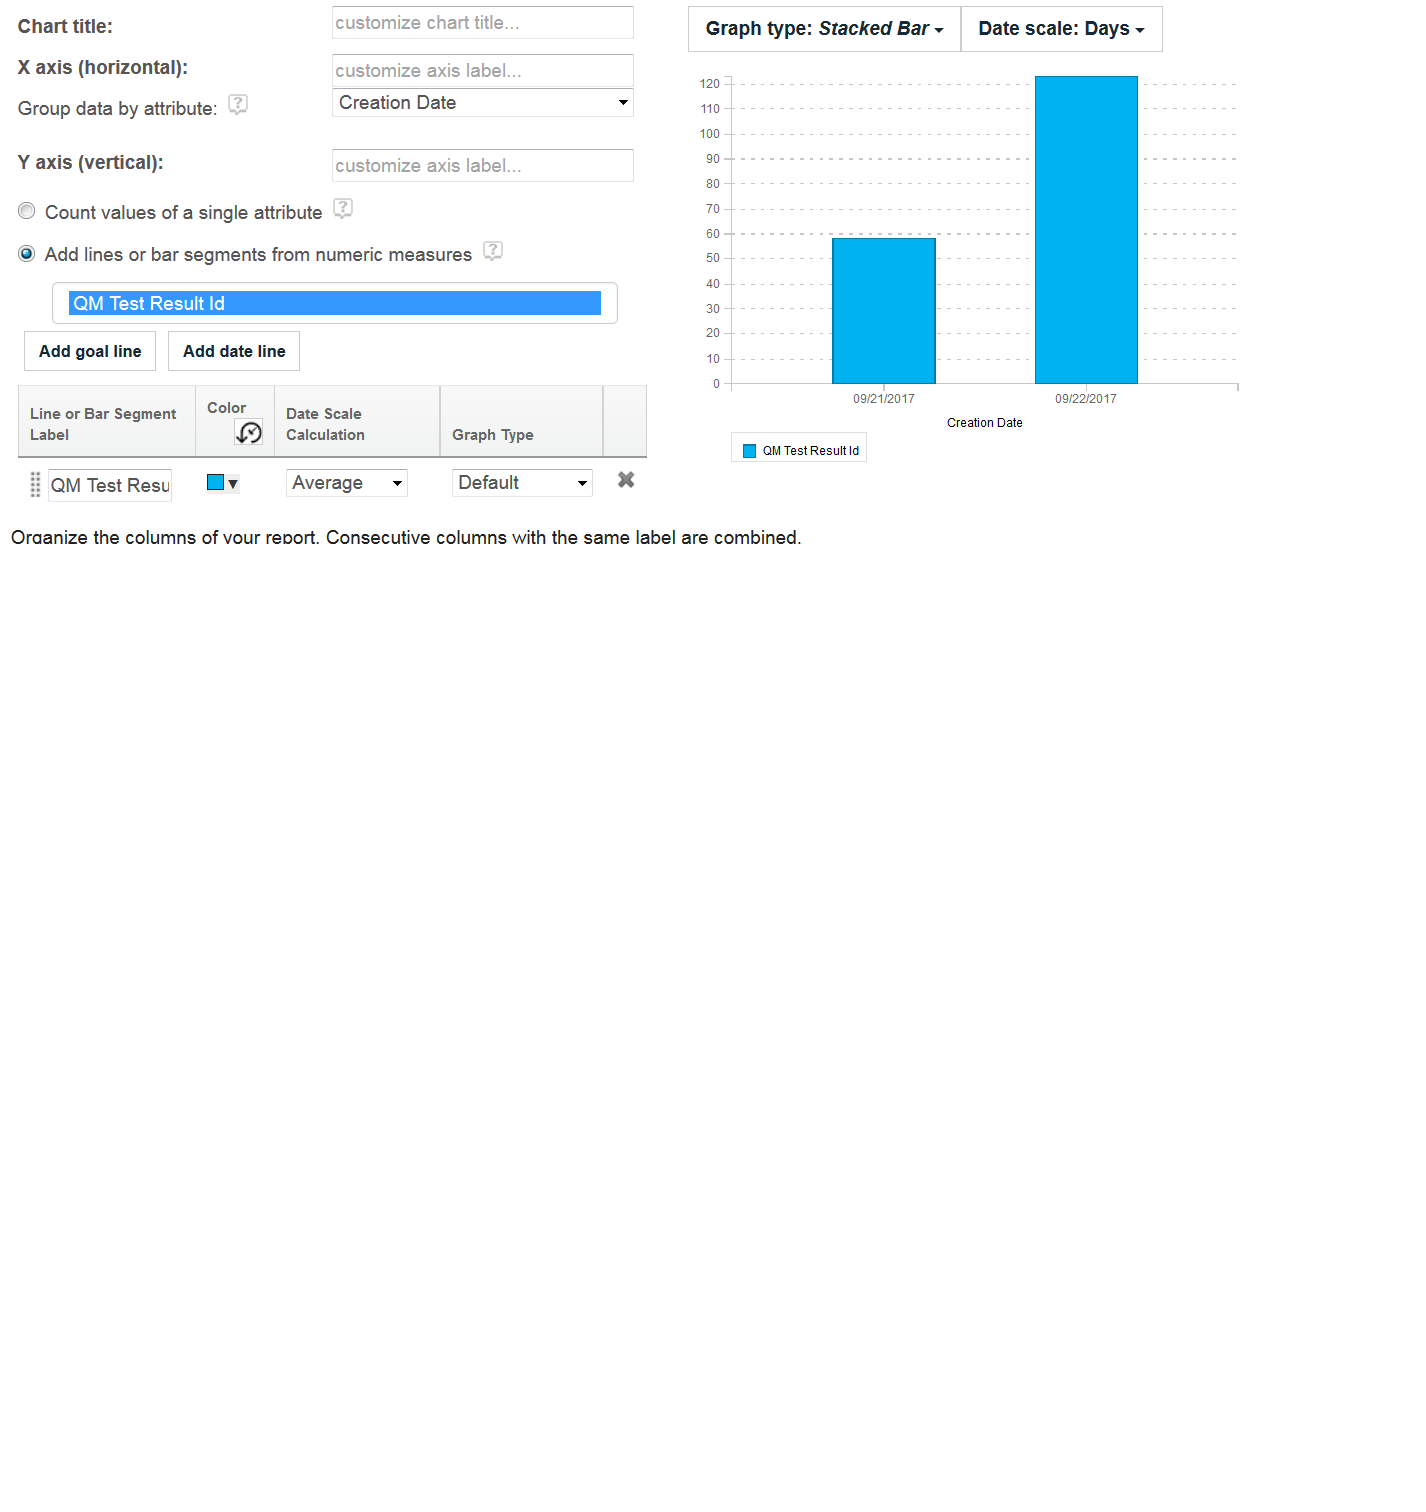
However, if you want for example a non default attribute displayed on the graph, just add that attribute as an additional column while building a report under the Format Results Tab and select the graph as shown in the picture below.
Hope this helps,
Krupa Gunhalkar