LQE heap explodes and leaves coredumps
Our LQE server on WAS had 24 GB assigned to JVM (now 30) and still it keeps crashing with heap out.of.mem exceptions:
0SECTION TITLE subcomponent dump routine
NULL =============================== 1TICHARSET 1252 1TISIGINFO Dump Event "systhrow" (00040000) Detail "java/lang/OutOfMemoryError" "Java heap space" received 1TIDATETIME Date: 2016/11/23 at 12:24:55 1TIFILENAME Javacore filename: D:\Program Files\IBM\Websphere\AppServer\profiles\AppSrv01\javacore.20161123.122316.8724.0007.txt 1TIREQFLAGS Request Flags: 0x81 (exclusive+preempt) 1TIPREPSTATE Prep State: 0x104 (exclusive_vm_access+trace_disabled) NULL ------------------------------------------------------------------------
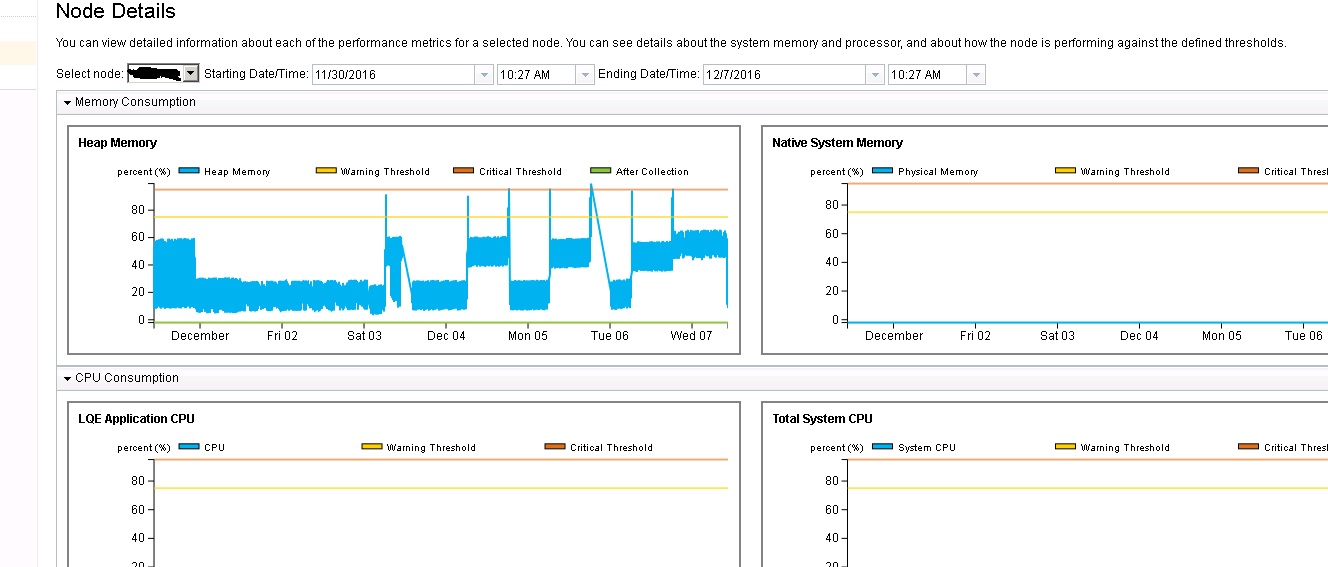
Looking at the health for the app its evident that while it looks stabile over some time the mem consumption all of the sudden explodes:
Any idea what is causing this or how to prevent it ? I realize that it could look like a memory leak and that there are tools to analyze the dump files - i just wanted to know if anyone has tried this before and knows about a solution or a configuration that would help.
|
2 answers
You may already have resolved this problem - but I'll post this anyway for others:
I ran into this problem after first trying to use the Jazz Reporting Service applications. The error would typically arise when trying to reindex the LQE data sources (or after running QM tests that generated data which impacted the LQE data sources). Resolving my problem required:
a. Running LQE on a server that had sufficient RAM resources (the amount of ram you need is dependent upon the amount of data being managed - but our minimum configuration (with a very small amount of project data) was increased to 32 GB Ram when we first ran into this problem.
This, by itself, did not solve the issue - we still ran into 'out of memory' errors. After making the next change we did not see the problem recur:
b. Modify the server.startup script file to specify No Compressed Refs: For example:
Change: "set JAVA_OPTS=%JAVA_OPTS% -Xcompressedrefs -Xgc:preferredHeapBase=0x100000000"
To: set JAVA_OPTS=%JAVA_OPTS% -Xnocompressedrefs -Xgc:preferredHeapBase=0x100000000
This change allowed java to use memory above the lower 4 GB (native) memory space. Be aware that this might not be the right solution for you and you should consider discussing your problem with Customer Support.
Comments 1
Donald Nong
commented Feb 05 '17, 11:35 p.m.
Just a clarification on what the JVM option -Xnocompressedrefs really does. It tells the JVM to use 64-bit references, which will be stored above the 4GB memory area. There can be still other things (such as NIO) still stored below the 4GB memory area. With a heap size this large, the heap size is allocated above the 4GB memory even without the -Xgc:preferredHeapBase option. Using this option is an acceptable solution if you have OOM in the "native heap". OOM in the "Java heap" can be quite different and requires further investigation.
Kim Soederhamn
commented Feb 06 '17, 3:12 a.m.
Thanks for the reply Daniel and Donald
Yes we have "circumvented" the problem with exactly the same steps - changed the jvm option to run with nocompressedrefs which allows us to to allocate more than 1 GB native mem. After that we started seeing regular java heap out of mem issues which lead us to increase JVM start and max to about 30 GB which keeps the server running for up to a week without crashing but as you mention reindexing datasources will cause problems. We have analyzed the heap dumps and combined with the leaps in mem consumption we are lead to believe we may have a memory leak. Support is working on it.
|
Benjamin Silverman (4.1k●6●10)
| answered Feb 03 '17, 4:05 p.m.
FORUM ADMINISTRATOR / FORUM MODERATOR / JAZZ DEVELOPER I would suggest contacting support for this. The solution mentioned above is intended to fix the case of a Native OutOfMemory where as your case is heap exhaustion. If possible, take some javacores over the period of time the memory spike is observed and support can take a look to see what might be causing the heap exhaustion. A heap dump (.phd file) would also be useful if one is generated, along with the LQE logs from when the problem was happening.
|
Your answer
Dashboards and work items are no longer publicly available, so some links may be invalid. We now provide similar information through other means. Learn more here.