Question on Execution Trend report in RQM
(a) we can select only 1 report at a time
So, if I have a master and 2 children, I can't select say, master and one child, right?
(b) selecting Master plan, will give me trend for child plans TERs also, right?
(c) For some reason, I see only TER numbers from only one child are seen in the execution trend if plotted for Master Test Plan.
e.g.
I have a sample Master test plan - having 4 tests - 4 TERs created - updated with results
child 1 Test Plan - 5 tests - 5 TERs - updated with results
child 2 Test Plan - 3 tests - 3 TERs - updated
I don't know where this 11 count is coming from
(d) Many times, I see discrepancy in the report execution trend.
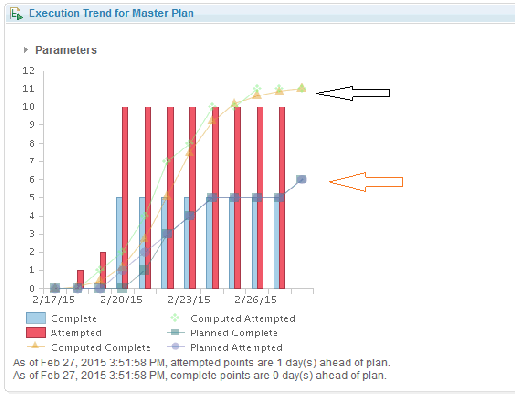
e.g. in the above screenshot of Execution Trend, computed curves show me count of 11
but, planned graphs show 6 !
Not sure why it is so
(e) what does the blue and red bar-charts mean?
In the above image, does that mean 10 TERs were attempted and 5 Completed on, say, 2/20/15 ?
then, why are these joined blue/red bar-chart repeated for subsequent dates?
(f) The timestamp - I see only for Master Plan report, is that right?
(g) When do these reports (Execution trend) get updated?
i.e. if I go and make some changes to TERs, I don't see them taking effect immediately if I run/refresh the report in the dashboard
So, if I have a master and 2 children, I can't select say, master and one child, right?
(b) selecting Master plan, will give me trend for child plans TERs also, right?
(c) For some reason, I see only TER numbers from only one child are seen in the execution trend if plotted for Master Test Plan.
e.g.
I have a sample Master test plan - having 4 tests - 4 TERs created - updated with results
child 1 Test Plan - 5 tests - 5 TERs - updated with results
child 2 Test Plan - 3 tests - 3 TERs - updated
I don't know where this 11 count is coming from
(d) Many times, I see discrepancy in the report execution trend.
e.g. in the above screenshot of Execution Trend, computed curves show me count of 11
but, planned graphs show 6 !
Not sure why it is so
(e) what does the blue and red bar-charts mean?
In the above image, does that mean 10 TERs were attempted and 5 Completed on, say, 2/20/15 ?
then, why are these joined blue/red bar-chart repeated for subsequent dates?
(f) The timestamp - I see only for Master Plan report, is that right?
(g) When do these reports (Execution trend) get updated?
i.e. if I go and make some changes to TERs, I don't see them taking effect immediately if I run/refresh the report in the dashboard
2 answers
Hi Rajesh,
I'm copying here the answer sent by e-mail.
In general, information regarding BIRT reports in RQM can be found here: https://www-01.ibm.com/support/knowledgecenter/SSYMRC_5.0.1/com.ibm.rational.test.qm.doc/topics/qm_c_birt_reports.html?lang=en
Detailed information regarding the Execution Trend Report can be found here: https://jazz.net/help-dev/clm/index.jsp?re=1&topic=/com.ibm.rational.test.qm.doc/topics/qm_c_using_exec_trend_report.html&scope=null
(a) we can select only 1 report at a time
So, if I have a master and 2 children, I can't select say, master and one child, right?
Only one test plan can be selected.
(b) selecting Master plan, will give me trend for child plans TERs also, right?
No, the information of only one test plan will be displayed
(c) For some reason, I see only TER numbers from only one child are seen in the execution trend if plotted for Master Test Plan.
e.g.
I have a sample Master test plan - having 4 tests - 4 TERs created - updated with results
child 1 Test Plan - 5 tests - 5 TERs - updated with results
child 2 Test Plan - 3 tests - 3 TERs - updated
I don't know where this 11 count is coming from
The output displayed on the report is the weight (story points)
(d) Many times, I see discrepancy in the report execution trend.
e.g. in the above screenshot of ExecutionTrend, computed curves show me count of 11
but, planned graphs show 6 !
Not sure why it is so
See link with explanation of the report
(e) what does the blue and red bar-charts mean?
In the above image, does that mean 10 TERs were attempted and 5 Completed on, say, 2/20/15 ?
then, why are these joined blue/red bar-chart repeated for subsequent dates?
See link with explanation of the report
(f) The timestamp - I see only for Master Plan report, is that right?
Only the test plan selected will be displayed there
(g) When do these reports (Execution trend) get updated?
i.e. if I go and make some changes to TERs, I don't see them taking effect immediately if I run/refresh the report in the dashboard
As explained on the link with explanation of the report, this is a data warehouse report, therefore the Data Collection jobs (ETL's) need to run for you to see the data refreshed.
Thanks,
Clara