How to I Interpret the Sprint Backlog Burndown Chart?
Hello,
I am using RTC 4.0.3 for an Agile project and I don't understand how to interpret the Burndown chart provided in a sprint backlog.
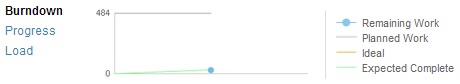
I have correctly created and estimated all tasks associated to the stories planned for my sprint and resources are currently working on them until completion. Whenever I look at the burndown chart, though, it always looks like
this:
It is not very useful. I was expecting a burndown chart rather than two lines that don't really tell me much. Am I doing something wrong? I expect the remaining work line to start at the top of the y-axis and start to descend towards 0 over time.
Please help!
Best regards,
Andrew
2 answers
Do you have the etl-jobs configured to collect the information for the data warehouse?
Comments
Hello and thank you for your reply!
I don't know if the etl jobs are configured correctly since I unfortunately do not have access to the admin pages.
What I can add is that there is also a Shared Report called "Burndown" that doesn't provide data in the filters, so I think the etls might be the problem. What do you think?
Regards,
Andrew