It's all about the answers!

Ask a question

Need clarification on how suspicion profiles work in RM


Dolores Vogel (1031337) | asked Oct 24 '13, 8:29 a.m.
 I'm looking at this Help article - https://jazz.net/help-dev/clm/topic/com.ibm.rational.rrm.help.doc/topics/t_view_suspect_trace.html.

It says:
The suspect icon is displayed in the following locations:
  • The Overview section of the sidebar of an open artifact next to the Is Suspect field.
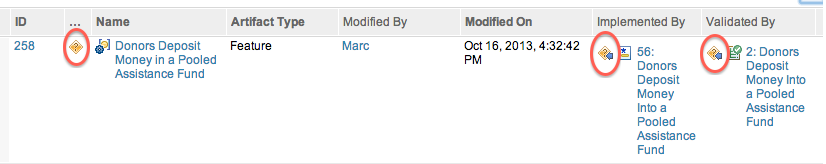
  • The Suspicion column of the Artifacts page. To display this column, click the Change Column Display Settings icon   in the toolbar. Select Suspicion from the Select attributes or link types list and click Add. If you have not selected at least one suspicion profile, you are prompted to select one now. You can save your column layout in a view for reuse.
  • The project dashboard. Add the Requirements View widget to the dashboard. In the widget settings, select a view that displays the Suspicion column. The following image is an example of this view in a dashboard.
  • The summary of the linked artifact that is displayed when you hover your cursor over a link, wherever links are displayed in the RM application.
  • traceability link in the Links section of the sidebar, as shown in the following image.
I've been testing in RRC v 4.0.4.

I set up a suspicion profile to watch implemented by and validated by links. I turned on tracking and checked that the indexing completed. I linked a requirement artifact in RM to a user story in CCM and to a test case in QM. I set up a traceability view on the Artifacts page in RM that includes the Suspicion column. Then, I made a change to the linked user story and linked test case. The ONLY place I see the suspect icon is in the Links section in the panel on the right when I open the artifact. I don't see it in my traceability view and I don't see it on the Requirements View widget on my dashboard which I configured to show my traceability view.

After reading the Help several times, I think that perhaps that the suspicion icon only shows on the Artifacts page and on the dashboard if something changes on a linked requirement artifact when two requirement artifacts are linked, but I need to confirm. If I'm supposed to see the icon for the test case and user story that changed, what part of the set up am I missing?

2 answers


permanent link
Marc Baumbach (1311) | answered Oct 24 '13, 11:45 a.m.
FORUM MODERATOR / JAZZ DEVELOPER
Do you have multiple suspicion profiles? If you do, there's a chance you have a different profile selected for the view. The other thing you keep in mind is that the traceability views only show "incoming" suspicion. From the sounds of your use case, it should be showing since you modified the user story and test case. Do you also see the icon in the Overview section of the sidebar in the opened artifact?

Just to note: Incoming suspicion has the suspect icon with a blue arrow. Outgoing suspicion has a black arrow and suspicion in both directions is a red double-ended arrow.

Comments
Dolores Vogel commented Oct 24 '13, 12:06 p.m.

I only have one profile set up. I only see the suspicion icon in the Links section of the panel on the right when I open the artifact. In the Overview section, it displays "No" in the "Is Suspect" field.I can only assume that means that the requirement artifact itself is not suspect since it hasn't changed and the two linked artifacts have the suspect icon showing in the Links section. That's why my guess was that the icon only shows on the Artifacts page and on the dashboard when a linked requirement artifact changes. I don't find that very useful. It's also not very useful to see that the story and test case are suspect only when you open the artifact. So, I really hope it's not working as designed. :) Thanks!


Dolores Vogel commented Oct 24 '13, 12:06 p.m.

Oh....and the one suspicion profile is selected in my traceability view. 


Marc Baumbach commented Oct 24 '13, 12:14 p.m.
FORUM MODERATOR / JAZZ DEVELOPER

The Overview section saying "No" means that the requirement itself is not suspect, meaning that no artifacts linked to it have changed in a way to make it suspect. I assume the icons in the Links sidebar are the suspect icons with the black arrow which means things are working correctly in all areas.


Now, it could be that you aren't detecting suspicion for changes made in CCM and QM and the most likely culprit is that you don't have Tracking on for those applications in the Suspicion Profile Administration. If that's the case, trying turning tracking on, wait for the indexing to be complete and try modifying one of the linked CCM or QM items again and you should see the icons showing up correctly.


Marc Baumbach commented Oct 24 '13, 12:15 p.m.
FORUM MODERATOR / JAZZ DEVELOPER

Just to clarify, the "Tracking" basically means that you want to watch for any changes that happen in that application. It doesn't mean that you need profiles for those applications. So in order to track suspicion across links in all three applications, you need to track all of the applications.


Dolores Vogel commented Oct 24 '13, 12:45 p.m.

I have some pictures to help explain, but I don't seem to have permissions (or a rating?) to upload. Is there a way to get the pictures to you?


Dolores Vogel commented Oct 24 '13, 1:25 p.m.


Marc Baumbach commented Oct 24 '13, 1:38 p.m.
FORUM MODERATOR / JAZZ DEVELOPER

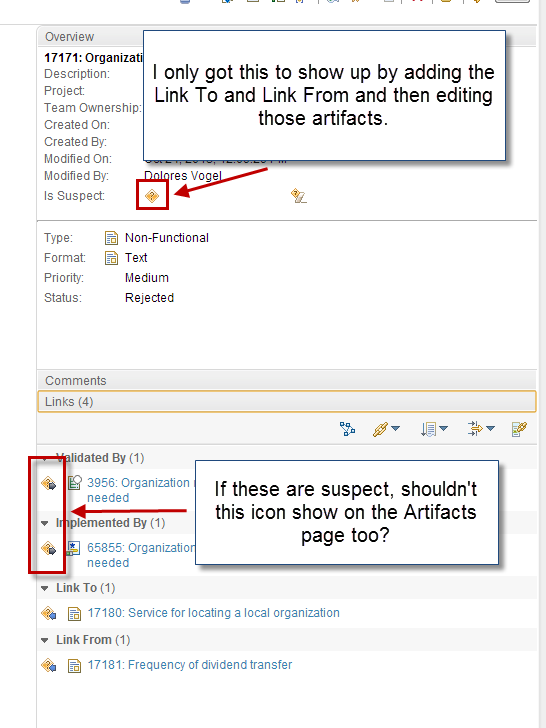
This is working as expected, so let me explain what's going on in this situation. In this case, your requirement 17171 is suspect (Overview section) because the requirements 17180 and 17181 changed and caused it to become suspect (The suspect icon with the blue arrow, or "incoming" suspicion).


The suspect icons with the black arrows on QM 3956 and CCM 65855 indicate that requirement 17171 was modified in a way that 3956 and 65855 are suspect artifacts ("Outgoing" suspicion).

In the traceability view, you will only see "incoming" suspicion in the link columns, which is why you don't see the icons next to the QM and CCM items. In addition to that, the Suspect column will only show if the artifact itself is suspect, not if it caused suspicion to other artifacts. In this case, because 17171 is suspect due to changes in 17180 and 17181, it's showing as suspect in the traceability view.

Hopefully this helps clarify what's going on, but let me know if I can explain anything else relating to this situation.


Dolores Vogel commented Oct 24 '13, 2:47 p.m.

Thanks for clarifying. I suspected that was what was happening. I just don't think it's that useful to "watch" changes to user stories and test cases if you have to open the requirement artifact to see that something changed. Is there any way to have that enhanced? I have a handout of lab exercises from a proof of concept IBM did for an earlier version of 4 that has a picture of the Artifacts page, and the suspect icon shows up for a user story and a test case, so it must have worked that way at some point. I find that much more helpful since I have a visual cue that something changed without having to open the requirement artifact.  


Marc Baumbach commented Oct 24 '13, 3:12 p.m.
FORUM MODERATOR / JAZZ DEVELOPER

The functionality for suspicion hasn't changed since it was released in 4.0, and you can visualize those changes if you have "Tracking" turned on for QM and CCM in the Suspicion Profile Administration page. (See screenshot)


Tracking All Applications

Once you have all of the applications tracked, whenever you modify a CCM or QM artifact linked to a requirement, you'll see that suspect icons show up in the traceability view. (See below)

Suspect Flags


Dolores Vogel commented Oct 24 '13, 3:57 p.m.

Okay, that's the way I would expect it to work. So, I have Tracking turned on for all three tools, and the icon does NOT show on the Artifacts page as it does in your graphic. (You can see that in the two graphics I sent earlier.) What other suggestions do you have? I know my profile is working, because I can see the suspect icon in the Links area when I open the requirement artifact. It just doesn't show on my Artifacts page.


Dolores Vogel commented Oct 24 '13, 4:06 p.m.

 Also, I have one suspect profile set up and it is set to track only link types in RRC. Do I need to select the link types under CCM and RQM too to get it to work right?


Marc Baumbach commented Oct 24 '13, 4:37 p.m.
FORUM MODERATOR / JAZZ DEVELOPER

Do you have an artifact type restriction on those link types in your suspect profile for the "Requirement" artifact type? That's the only other thing I can think of that might make it not work for CCM and QM.


You don't need to select the link types under CCM and QM to get it work. My example was a suspect profile that was simply watching Implemented By and Validated By link types.


Dolores Vogel commented Oct 28 '13, 8:34 a.m.

No restriction. 

showing 5 of 13 show 8 more comments

permanent link
Robin Bater (3.4k47) | answered Oct 24 '13, 4:33 p.m.
JAZZ DEVELOPER
Just curious did you add the suspicion column to the view and save it before or after you selected the profile? 

I ask because in early versions there was a problem where by if you selected the profile after you created the view it was not remembering the selected profile.

Comments
Dolores Vogel commented Oct 28 '13, 8:36 a.m. | edited Oct 28 '13, 8:48 a.m.

I added the suspicion column after I saved the view and then updated the view. That column updates when a linked requirement changes, and it sounds like that is the way it's supposed to work.

I also selected the profile before I saved the view. When I access the view, I check and the profile is still selected and the suspicion column still displays.
I recreated the view and I still cannot get it to flag the story or test case as suspect in the view. It only shows it to me in the Links area when I open the artifact. 
Also, I've used a personal view and a shared view, and I get the same results with either one. 

Your answer


Register or to post your answer.


Dashboards and work items are no longer publicly available, so some links may be invalid. We now provide similar information through other means. Learn more here.