Multi-value attribute aggregation using Jazz Reporting Service’s LQE Report Builder
Across the Engineering Lifecycle Management (ELM) applications, you might define the attributes that allow the selection of multiple values on a requirement artifact, a work item, or a test artifact. By default, this data is displayed in the Jazz Reporting Service (JRS) Report Builder as separate lines, one for each of the attribute values. The same is the case for the Lifecycle Query Engine (LQE) and the Database Warehouse (DW) data sources. The display of one attribute value per row is tied to the relational database design concept of database normalization. This type of output display is wanted in some use cases.
If your reporting scenario requires these attribute values to be aggregated into a single row, it is easily accommodated by using a relational database system function within a JRS Custom Expression. The specific database query language function that does this aggregation differs between the data sources. LQE Relational Store (RS) uses SQL, LQE (Jena) uses the SPARQL language, and DW uses the SQL. The process of aggregation using the SPARQL GROUP_CONCAT command with the LQE (Jena) data source is explained in this article. The aggregation for DW can be done using the SQL LISTAGG command which is described in the Jazz.net blog post JRS Report Builder: Streamlining multi-value enumerations in reports.
Setting the stage
The following example shows a before and after JRS report to illustrate the difference between the unaggregated and aggregated results: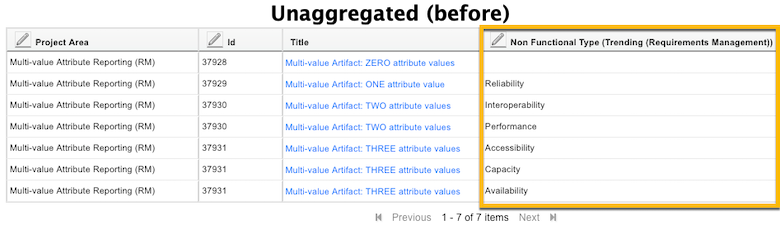

JRS Custom Expressions were added in CLM 6.0.4, so that version or greater is required.
The examples used here are based on the sample requirements data from the JKE Banking – Money that Matters Sample so that you can easily recreate what is presented here. While the focus here is on the requirements data set, the reporting aggregation behaves the same for the work items and the test artifacts.
NOTE If your ELM environment is connected to LDAP for user authentication, you cannot create project areas based on the JKE Banking – Money that Matters Sample data. The reason is that the sample data setup includes the automatic creation of demo user profiles. However, you can easily create similar attributes on any artifact type. |
At the expense of brevity, this example includes two enumerated attribute data types and one user attribute data type. The reason that multiple data types are used is to demonstrate how the aggregation of multiple attributes in the same report would work.
In the project properties, the Number of Values attribute property for the Non Functional Type, Origin, and Members attributes is set as “Multiple values allowed“. The artifact type that is used from the sample data set is Non Functional.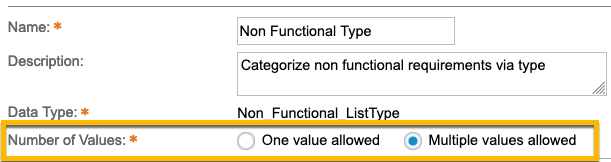
The following example shows the attributes that are displayed in the artifact’s Overview window.
For this example four artifacts were created, each with a different number of attribute values selected. The following screen capture of the example artifacts is from a DOORS Next view, which automatically aggregates the attribute values.
Creating the report
Open your JRS Report Builder (https://<elmPublicUrl>/rs/reports) and click Build report.
In the Choose a report type section, select Current Data for the Lifecycle Query Engine data source. Then, click Continue.
In the Limit the scope section, select one or more project areas to report on. For this example, the requirements management project area is selected. Now, click Continue.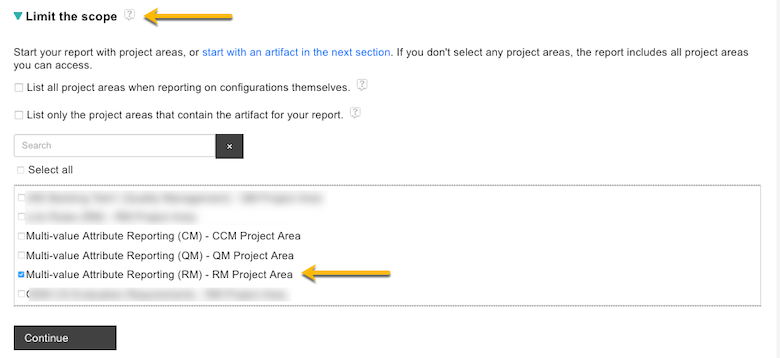
In the Choose an artifact section, select the artifact type to report on. For this example, Non Functional is selected. Now, click Continue.
In the Trace relationships and add artifacts section, no action is needed for this example. Click Continue.
In the Set conditions section, add two conditions as All Match (AND). For this example, the uniquely titled artifacts starting with Multi-value Artifact: were created so that it is convenient to filter them for the report.
WORKAROUND: For user-based multi-value attributes, you must set a condition to filter out the Current User to display artifacts with an unassigned value for that attribute type. |
For this scenario, the attribute is Members and the condition is set to is not Current User.
Click Continue.
Adding custom expression columns
The following section is the heart of this example!
In the Format results section, the default attribute columns are Project Area, Id, Title, and URL.
Tip #1 Adding a custom expression removes the Id, Title, and URL attributes from the report. This default behavior supports the visual aggregation of the results into a graph or chart for drill-through analysis of the aggregated data. No other added attribute columns are removed. If your report is intended to show all the returned data, then add the Id, Title, and URL back into your report after you enter all the custom expressions for attribute aggregations. |
Tip #2 In case you added the attribute to be aggregated, such as Non Functional Type, before you add the custom expression, you will want to remove it because it is the unaggregated version of the attribute. |
Click Custom Expression to enter the first custom expression.
In the Custom Expression dialog, select the Contains an aggregate expression checkbox.
From the Choose attributes list, select the attribute to aggregate, Non Functional Type.
To add the attribute to the custom expression editor, click the action arrow (>).
NOTE: The attribute name begins and ends with a dollar sign ($). |

The following syntax is for the SPARQL custom expression for aggregation:
GROUP_CONCAT(DISTINCT $<attributeName>$; SEPARATOR=‘<separator>‘)
For this example, the custom expression is:
GROUP_CONCAT(DISTINCT $Non Functional:Non Functional Type (Multi-value Attribute Reporting (RM))$; SEPARATOR =', ')
After you configure the custom expression, click Validate and then click Add.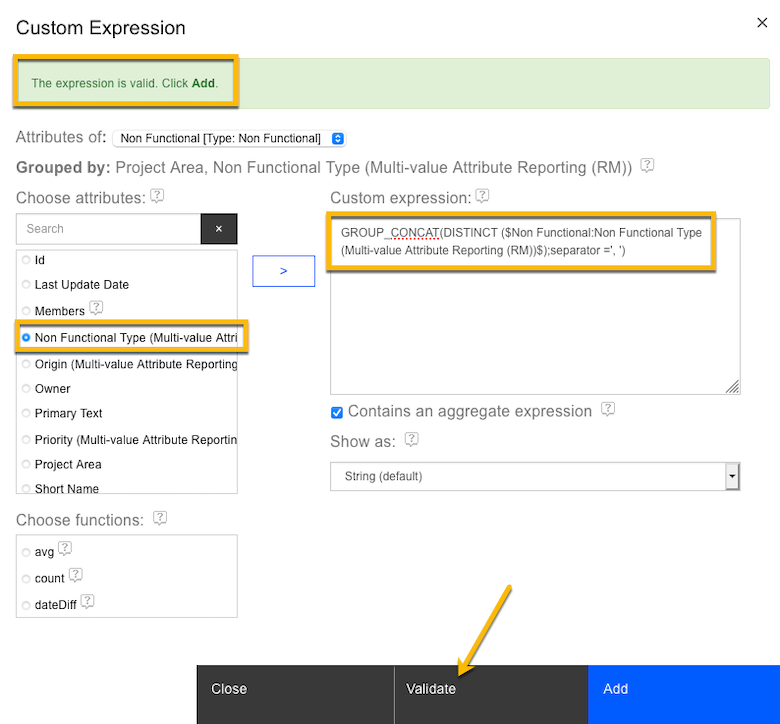
Tip #3 Validating custom expressions It is common to copy and paste your entire custom expression or a part of it from another application into the custom expression editor. However, it can introduce some bad characters that might look okay but have incompatible encodings. The following common characters can be miscoded and cause errors:
|


Now, take a moment to consider separators. The separator that you choose to use is driven either by how you want to see the data or work with an export of it. The straightforward choices for separators are comma, space, colon, semi-colon. Visually, you might want to see each aggregated value on a separate line, so now you need to know which control characters to use. These control characters differ based on whether you use SQL (Data Warehouse) or SPARQL (LQE).
Tip #4 LQE Line-Break or New-Line Separator Examples Line Break separator = ‘<br>’ This separator is the HTML Line Break element. It is only good for visualization in JRS. The line break does not convert into Microsoft® Excel so the attributes will display as an unseparated string of text. New Line separator = ‘\n’ This separator is the newline character for Unix® or Linux® based systems. It is only good for visualization in Microsoft® Excel. In JRS, the attributes are separated by a space. Break + New Line separator = ‘<br>\n’ This combination works for both JRS and Microsoft® Excel, but visually you will see a blank line after each attribute in JRS. No extra blank lines are exported to Microsoft® Excel. |
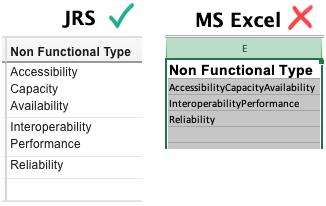


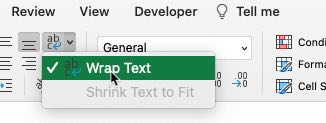
Tip #5 Use Wrap Text in Excel for visualization of line breaks To export a report to Excel that uses line break separators, you need to set the Excel column of the aggregated attribute to Wrap Text for visualization. Otherwise, it displays the values on the same line without a separator. This behavior is expected for Excel with line breaks within a cell. |
When a custom expression is added to an aggregated multi-value attribute display, the Report Builder removes the default attributes Id, Title, and URL. These can easily be added back later if needed for your report.
The report layout now has only two columns: Project Area, and the custom expression for Non Functional Type.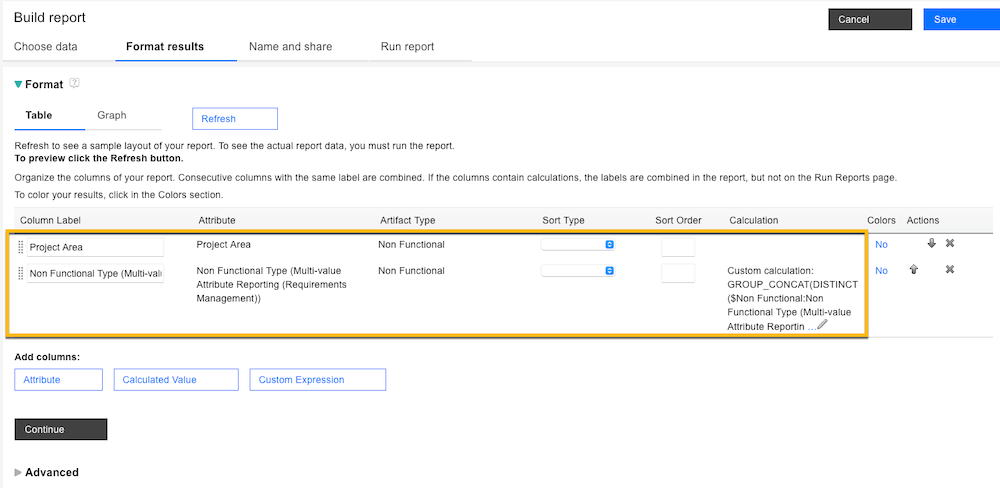
If you add the attribute column, which is Non Functional Type, before you configure the custom expression for it, you need to remove it because it is now redundant.
The core aggregation functions are now covered. In the following section, the remaining example includes two more custom expressions.
Click Custom Expression to enter the second custom expression for the enumerated attribute, Origin. This second attribute value aggregation expands on the overall example to show how the presentation looks with multiple aggregated attributes. Follow the same steps as the first custom expression.
For this attribute, the following custom expression is used:
GROUP_CONCAT(DISTINCT $Non Functional:Origin (Multi-value Attribute Reporting (RM))$; SEPARATOR =', ')
Now, click Refresh to see an example of the report layout with data. You do not have to run the report to get a quick view of how the results look. The results display includes up to six result rows, which provides some validation that your filter conditions are working.
Click Custom Expression to enter the third custom expression for the user-based nonenumerated attribute, Members. Nonenumerated user-based attributes are aggregated the same way as enumerated attributes. Again, follow the same steps as the first custom expression. The second condition, Members is not Current User, was set previously as a work-around for user-based attributes.
For this attribute, the custom expression is:
GROUP_CONCAT(DISTINCT $Non Functional:Members$; SEPARATOR =', ')
Click Refresh to preview your layout, which now includes all three aggregated attributes. Looking good!
Updating the report’s attribute columns
Now, add back in the default attributes that were deleted during the first custom expression configuration. In the Format section, under Add Columns, click Attribute. Select the Id, Title, and URL attributes to add them back into the report. Adding the URL attribute column followed by the Title attribute column makes the Title a hyperlink to the artifact.
You have the option of rearranging the attribute columns by using the Actions arrows or drag-and-drop by using the handle (![]() ) to the left of the attribute name.
) to the left of the attribute name.
Run the report
Select the Run report tab of the Report Builder. There you have it! Four rows of data each with three aggregated attribute columns.
Wrapping up
Be sure to save your report. Select the Name and share tab to input, at a minimum, the report name and then click Save.
You now have a solid foundation for adding aggregated attributes to your LQE-based reports!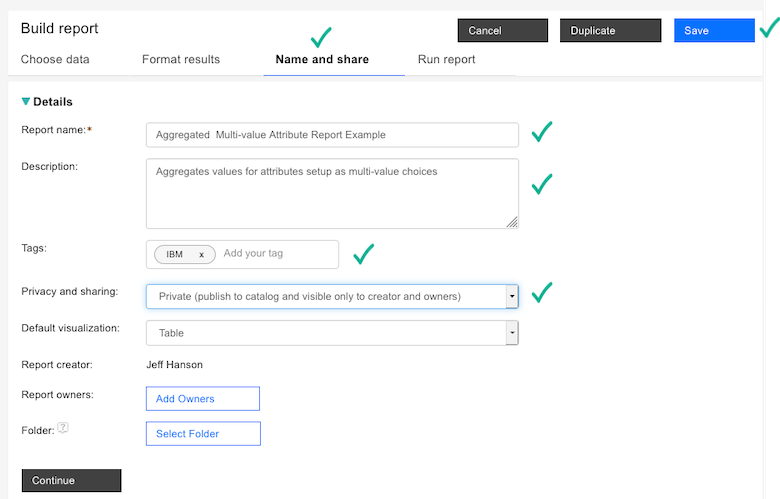
** Bonus Material **
Separators for SQL-based Data Warehouse reports
The separator syntax for SQL is a little different than for SPARQL, but they end up behaving the same way. Here’s a summary of what they are and where they work.
The following command is the SQL aggregation command:
LISTAGG($<attributeName>$,<separator>)
Separator | Description | JRS | Excel |
‘<br>’ | The <br> HTML element produces a Line Break-in text (carriage-return) | ||
chr(10) | The ASCII character code 10 is sometimes written as \n and is sometimes called a New Line or NL. ASCII character 10 is also called a Line Feed or LF. | ||
chr(13) | The ASCII character code 13 is called a Carriage Return or CR. |
The best <separator> option for both JRS and Excel is:
<separator> = ‘<br>’||chr(10)
*The || operator concatenates one or more strings into a single string
Aggregating multiple attributes into a single column
You might need to combine multiple attribute types into a single displayable or exportable ‘attribute’. It is easily accomplished! You can use the same Column Label for the successively ordered set of attributes. The result is a single attribute column with the values each separated by a comma + space. This default behavior is the same for reports based on the Data Warehouse or the Lifecycle Query Engine.
Adding a report to the dashboard
If you have not tried adding a JRS report on a dashboard, it is straightforward and convenient.
On the Name and share tab of your report, you must select either of the two Privacy and sharing options that allow publishing the report to the Reports catalog.
On any dashboard tab, click Add Widget to display the widget catalog. In the Select Catalog pull-down, select Report Builder. Search for your report and then click the Add Widget link that is associated with it. Close the catalog when you are done.
About the author
Jeff Hanson is a Sr. Solutions Engineer, working as a technical sales team member in IBM Engineering for over 20 years. He specializes in the Engineering Lifecycle Management solution suite. He can be contacted at jeffhans@us.ibm.com.
© Copyright IBM Corporation 2022