| Description | |
|---|---|
| Data Collection Component |
Data Collection Component: Trend metrics for users no longer collected Starting in version 6.0.4, DCC no longer collects trend metrics broken down by users (owners or creators). This change was necessary to avoid metric data growth which contributes to performance degradation over time. This new behavior can be disabled by following the steps outlined in the readme file at [DCC_server_installdir]/server/conf/dcc/mapping/legacy. |
| Report Builder |
Current data reports on work item history and state history In version 6.0.2, with data warehouse you could create current data reports on work item history and state history. In 6.0.3, these two work item history types were converted into custom trend types for work items. Now, if you use a data warehouse data source, you can write current data reports that show work items with specific transitions from one state to another. Use the Work Item History or State History type in the Choose an artifact section in Report Builder. |
|
Easy assembly of nested condition groups Until now, when you built a report, you could only group conditions using AND or OR. Combining groups of conditions was not supported. You can now create nested groups of report conditions by using the buttons, or by dragging and dropping conditions. It’s now easier to construct complex conditions by using All must match or Any can match instead of the AND or OR operators. This approach is similar to how you set conditions when you construct queries in Rational Team Concert. The new group outlines help you track your logic in complex condition combinations. You can also drag and drop conditions or groups, to reorder them. For a report that shows all defects that are low priority and tagged with ignore, or older than a year, create nested groups like the following image. Image of grouped conditions. Notice the drag controls, the outlines, and the operators:  |
|
|
Enhanced report customization by using custom expressions Previously, you had to write SQL or SPARQL queries in the Advanced section of Report Builder to do special formatting or complex calculations in a report. However, after editing the query syntax and saving, you can no longer benefit from the easy-to-use Report Builder interface. You can use custom expressions to do tasks like these: - Show in hours a value that is expressed in seconds in the data source. - Show calculated values by using a database function that is not available in the Calculated Value section. - Change how a date is shown. To show the data in the form that you need, you can add columns that use custom expressions written in the query language of your data source. Let’s walk through a few examples: Example 1: Show in hours a value that is expressed in seconds in the data warehouse. Create a report that shows the actual work on a defect. The results are shown in minutes. On the Format results page, click Custom Expression. Image of the Custom Expression button on the Format results page: 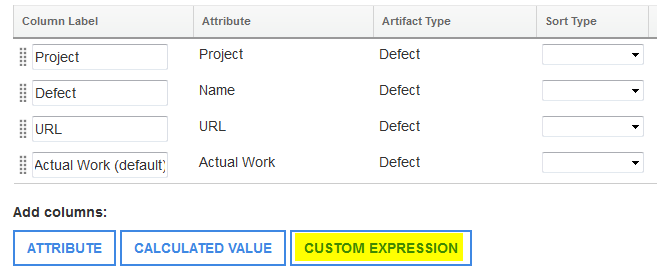 First, select the artifact type, and then choose the Actual Work attribute. When you click the Add arrow, the attribute syntax is shown in the Custom expression window. In this example, for the Actual Work attribute of a defect, you see $Defect:Actual Work$. Customize the expression for your needs. In this case, you want to see the actual work in hours, not in seconds. Enter this expression: $Defect:Actual Work$ / 3600 The exact syntax depends on the database vendor your company is using. Image of the custom expression syntax in the Add custom expression column window:  Validate your expression. You can also specify how to display the values: - Show the result according to your locale. - Sort the results. - Count numeric values in a graph. Add the column to the report, and see the actual work in hours. Image of the column showing the actual work in hours: 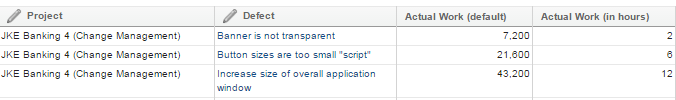 Example 2: Show the average actual work calculation in hours. Calculate the average actual work on a set of defects, and show the calculated value in hours instead of minutes. First, create a report to show a set of defects. Then, on the Format Results page, click Custom Expression. Select Actual Work in the attribute list, and click the Add arrow. Edit the expression to calculate the average: AVG($Work Item: Actual Work$) To make it calculate in hours, add / 3600 Select the Contains aggregate expression check box. Aggregate expressions, such as SUM, COUNT, AVG, MIN, MAX, calculate a single value based on a set of values. Check your database vendor documentation to see if the expression that you’re using is an aggregate expression. Image of the actual work calculation in hours: 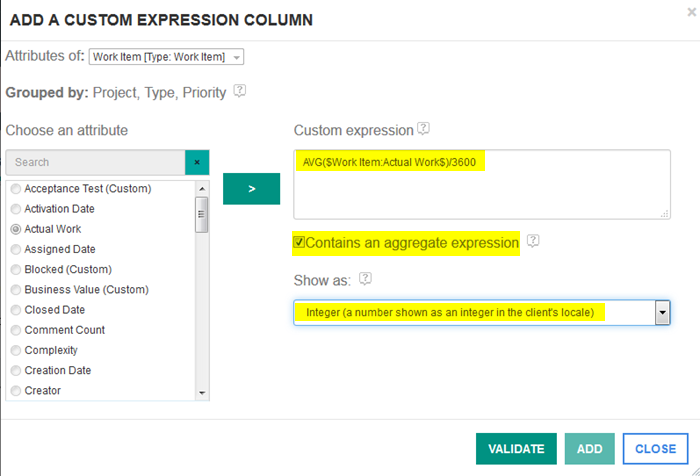 Example 3: Change how the date is shown in your report. On the Format results page in Report Builder, you can easily change the date format if you click Custom Expression. For example, you can show the creation date of a work item in three ways by changing the display type. Image of the customized date display:  Image of the table after adding the custom date column: 
|
|
|
Export your report to the right format In previous releases, after you ran a report, you could export it to a spreadsheet for further analysis. Now you can export your report results to various types of documents. Choose the right format: Microsoft Word, PDF, or HTML. If you want to do further editing of the report, you can export it directly to Rational Publishing Engine if you have a license. Image of the new Export the report to Microsoft Word, HTML, or PDF option:  Image of the document generation page:  You can also choose the layout for your document: view your report as a table, or select List to generate a serial list of artifacts and their properties. Image of a report in table layout:  Image of a report in list layout: 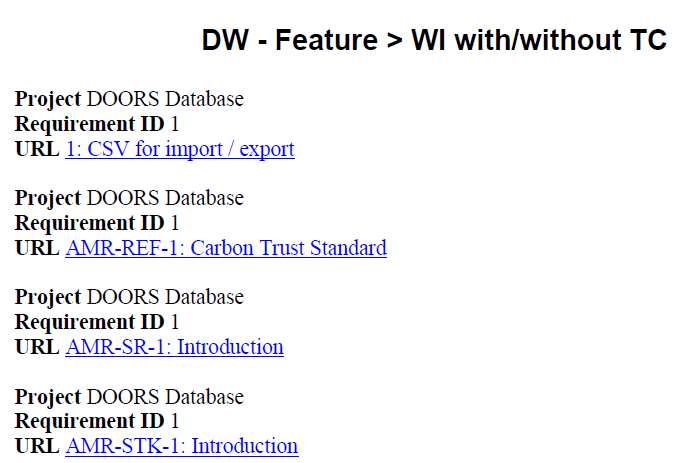 When document generation is completed, an archive file (.ZIP) with the file formats that you selected is downloaded to your system. Image of the downloaded files: 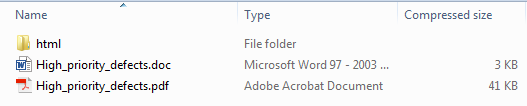 Export the report directly into Rational Publishing Engine for further formatting Until now, you had to export your file and import it into Rational Publishing Engine for further editing. Now, the template and specification are generated with the report in either table or list layout. If you have a license, you can open your template in Rational Publishing Engine directly from the Report Builder. Image of the page for exporting reports to Rational Publishing Engine: 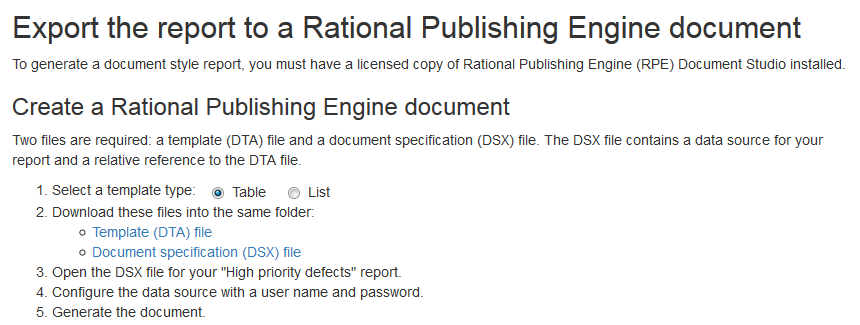
|
|
|
Faster loading of metadata for reports Logic was added to Report Builder to save the metadata from all data sources to the disk. The result is that Report Builder now starts up faster because it keeps the metadata for each data source in memory so you can edit or run reports right away. Previously, when Report Builder started, it had to load all the metadata from all the data sources before a report could be edited or run. You would get a "loading" message for a long time. For Data Warehouse data sources, it takes less than a minute to load the metadata because most of the schema information is hard-coded in Report Builder and queries only need to find custom types and properties. However, for an LQE data source, over 95% of the metadata must be obtained by running queries. Because each project in the CCM, QM, and RM applications publishes its own metadata, the amount of metadata to query increases, and each query takes longer to run. On systems with large amounts of data, loading a single LQE data source can take over an hour, and reports could not be edited or run during that time. Now, when a data source is successfully loaded or refreshed, the metadata is written to a file on disk in the server/conf/rs/MetaModelCache folder. A background job runs twice a day to refresh all data sources, keeping the cache files up-to-date. When Report Builder starts, it verifies that it can connect to the data source and looks for any cached metadata. This cached metadata is used instead of sending queries to the actual data source. If the data source can't be accessed, the cached metadata isn't read and you can't run reports. For LQE-based data sources, Report Builder now starts within a minute because it reads the metadata from the disk. If a startup error misreads the cached metadata for a data source or if that metadata is out-of-date after an upgrade, Report Builder ignores the cached metadata for that data source and loads it from the data source using queries. The new metadata is cached. If a user finds an issue with metadata that was read from the disk, the administrator can simply refresh that data source, replacing the cached data. An individual metadata file for a data source can be compressed and added to a service request for troubleshooting. |
|
|
Filter report content by interacting with the column headers You can now interact with report filters related to columns directly from the column headers. The controls that manipulate within columns used to be in the Filters dialog box. Now you'll find them in the header of their respective columns so that it is visually intuitive how each filter will be applied to the report. (Limitation: This feature is not available for ready-to-use reports.) Highlights After this list of highlights you can see some images showing how they look in Jazz Reporting Service. -Visually intuitive UI -Columns with user selected values are indicated by an icon -Hover tooltips for selected values -Decluttered Filters dialog box that shows only report conditions -Simplified Limit Scope filter and project column filters Image of the more intuitive UI with edit icons for each column: 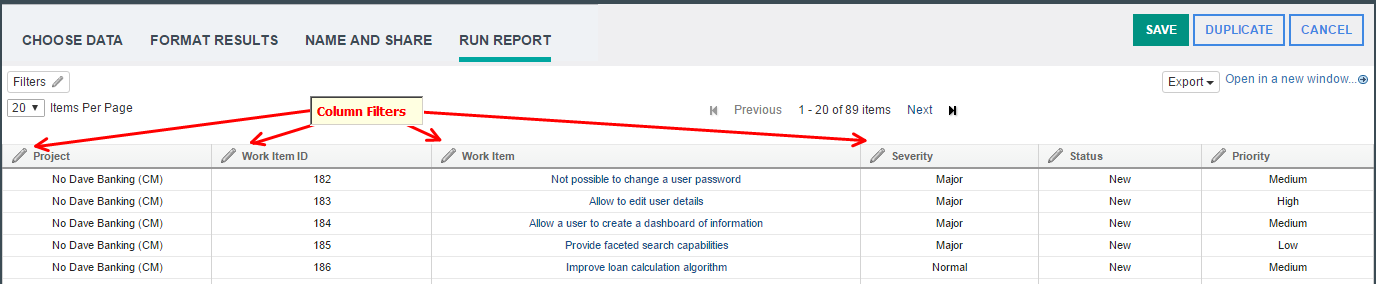 Image showing the icons for the editable columns: 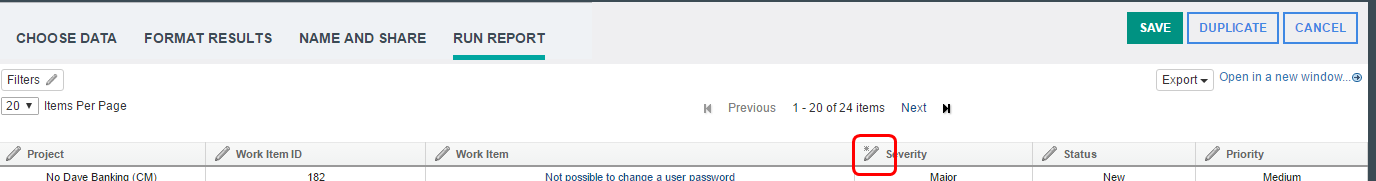 Image with hover tooltips showing possible values:  Merged columns When a report is built, you can combine columns with the same title. The column filter shows the corresponding filters of combined columns together delineated by their respective types. Image of the merged column filter: 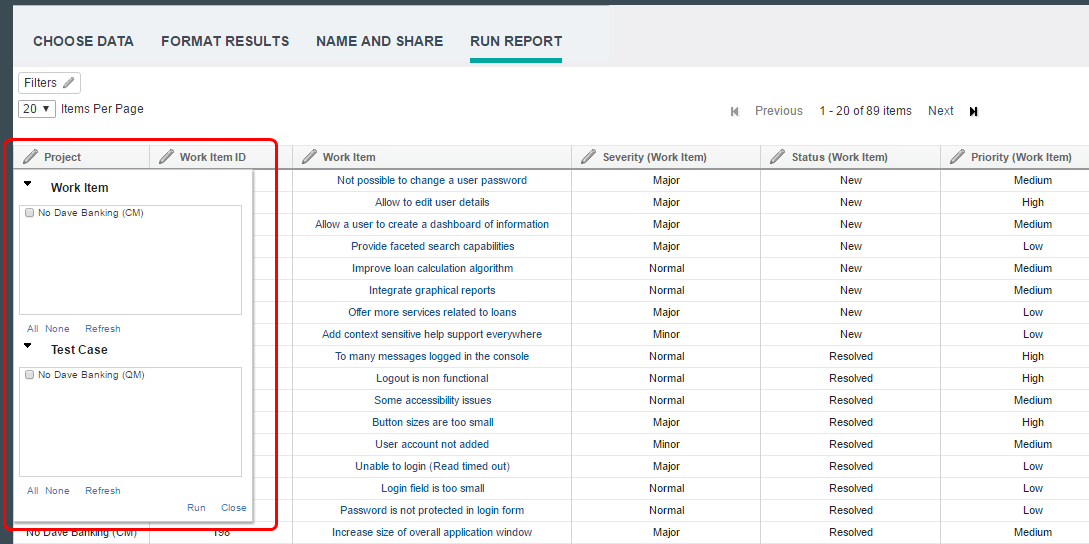 Project scoping and project columns Previously, the availability and interplay of the Limit Scope project filter and project-related column filters followed a complex logic. With the introduction of column filtering, project scoping and project columns are greatly simplified. All ready-to-copy reports contain a Limit Scope filter in the Filters dialog box that controls the availability of project selections for the entire report. Project column filters are now based on the selection in this filter and the available artifact types. As before, other enumerated columns are based on the selected values of their respective project filters. Reporting on artifacts in configurations As before, configuration and component selections are available, but in the Filters dialog box, which is less cluttered. Image of the simplified Filters dialog box with only the report conditions: 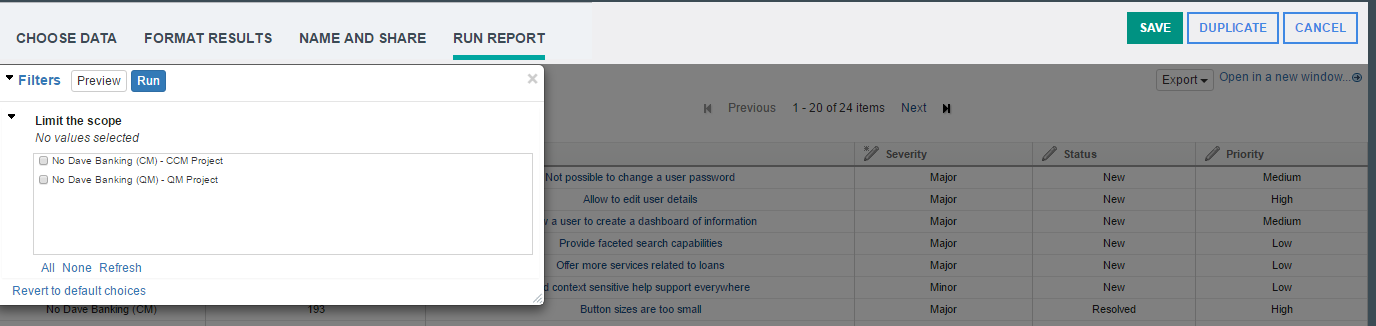
|
|
|
Shared column enhancements Previously, you could write a report where two columns defined on the Format Results page could share the same column in the table view in the report results. This is accomplished by giving adjacent columns the same column label. Shared columns are especially useful when a report contains two attributes that are considered the same. For example, one project might use one attribute for status and another project might use another attribute for status, but in the report you want to see the status in the same column regardless of which project the artifact is coming from. Shared columns are also useful when you work with multiple traceability paths as in the following example. Tables: Ability to sort by shared columns In the Format Results page, you can now define a sort order for a shared column Consider a report that shows both features that are validated by test cases and features that are not validated by test cases. The traceability section looks like the following image. Image of traceability section:  On the Format Results page, you can define a shared column for the project and collection of the feature by moving these columns adjacent to each other and giving them a common label. Now, you can define a sort order for these shared columns together. Image of sort order of shared columns: 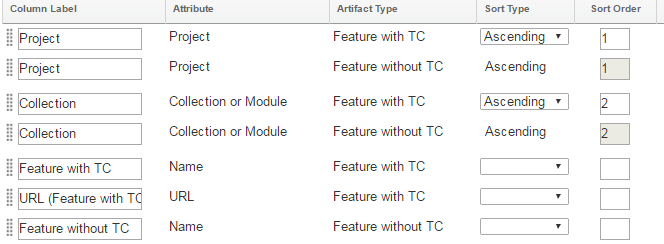 The results will look like the following image. Image of the sorted table results: 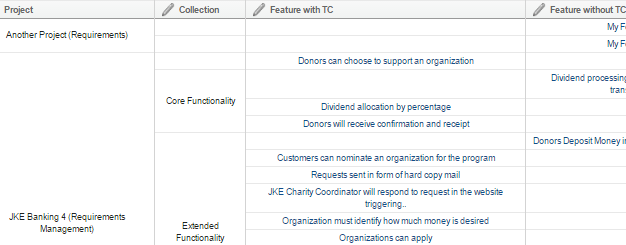 Charts: Ability to group by shared columns Similarly, it is now possible to group by shared columns in a chart. For the same report example, you must first define calculated columns to count the number of features with test cases and the number of features without test cases. Image of the calculated columns:  Now you can create a bar chart of the features with and without test cases and group them by collection (or by project). Image of bar chart configuration: 
|
|
|
Traceability improvements Support for multiple top-level artifact types You can now report on multiple top-level artifact types. You can include top-level types across products in one report without defining traceability relationships between them. This is particularly useful in LQE-based reports where there might be custom types in the LQE data source from various tools. For example, you can now write a single report to show all open high-severity items across all tool types. First, select the first type in the "Choose an artifact" section. In the "Trace relationships and add artifact" section, select the Enable multiple paths or add other source artifacts check box:  Now click the Add an Artifact button and select another artifact type.  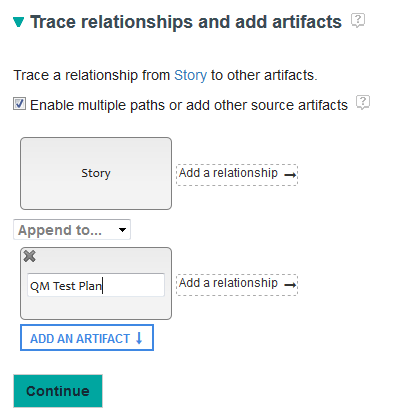 You can now show all artifacts of these two types without defining traceability relationships between them. 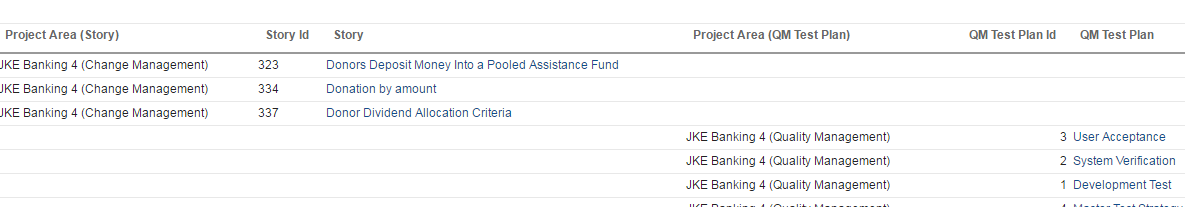 Traceability relationships with different source artifacts Previously, you could trace relationships between one source artifact and multiple target artifacts. Now, you can also trace relationships between multiple source artifacts and one target artifact. For example, you can show all stories that do not have test cases and all features (requirements) that do not have test cases. In the "Choose an artifact" section, select the Story type. In the "Trace artifact relationships" section, select the Enable multiple traceability paths check box. Click the Add an Artifact button and select Feature. Then create the traceability relationships from Story and Feature to look like the following image:  On the "Format Results" page, if you put the project fields of the story and the feature next to each other and give them the same label, they will be grouped together into one column in the result table. 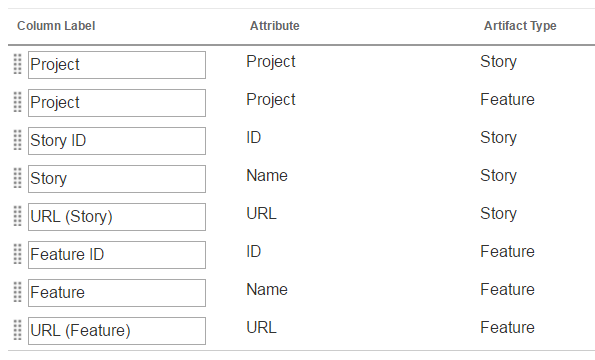  Improved ability to create branched traceability paths It is now easier to create branched traceability paths where the branching occurs after one of the artifacts in the middle of the traceability path. The Add a Relationship button appears on each relationship in the path when the Enable multiple paths or add other source artifacts check box is selected. If you create a relationship from an artifact other than the source artifact in a path, the artifacts leading up to this artifact will be duplicated in the new path. For example, click the highlighted Add a Relationship button to trace a different relationship from the Work Item artifact: 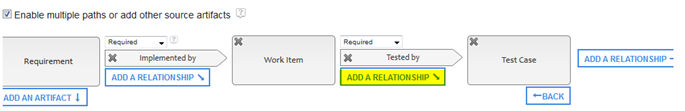 The following artifacts are created automatically and the new relationship can be added from the Work Item artifact: 
|
|
|
Use colors to highlight data in tables On the Format results page, click inside the Colors column to set conditions for highlighting specific parts of your table report. For example, you can change the background and text color of a table cell. You can also set the transparency for each color. If more than one color condition is set for a table cell, you can set the priority of these conditions. Image of the Colors column on the Format results page:  Image of color condition settings: 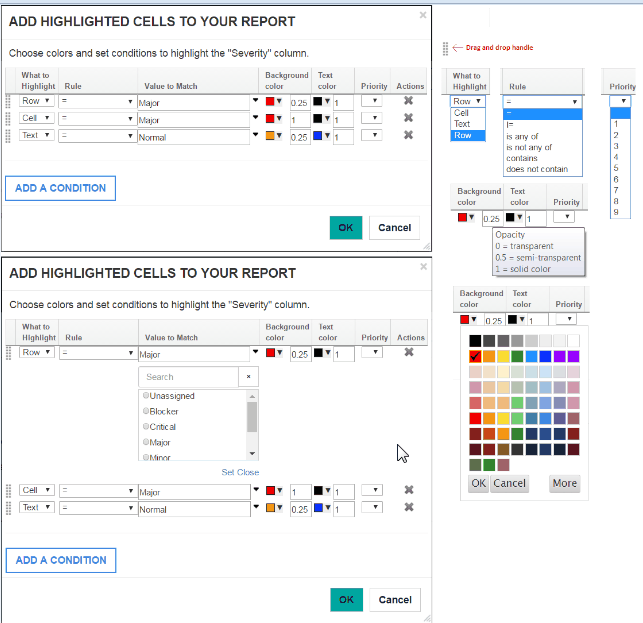 Image of a table report with colored cells that highlight specific values: 
|
|
| Dashboards and work items are no longer publicly available, so some links may be invalid. We now provide similar information through other means. Learn more here. |