Discover cross-project reporting with the IBM Jazz Reporting Service
The Rational solution for Collaborative Lifecycle Management (CLM) [1] is a set of seamlessly integrated applications that work together as one platform for managing the complete lifecycle of your development projects. The application and lifecycle data that your teams create collaboratively for their projects is provided to you for reporting by CLM in a data warehouse. This article introduces an all new set of capabilities and reports that allow you to set-up dashboards that show you the status of your entire project portfolio, aggregating data cross-applications, cross-projects, and even cross-timelines.
The Jazz Reporting Service (Jazz Reporting Service) are a new generation of capabilities, services, and APIs in Release 5.0 of the IBM Rational Reporting for Development Intelligence (RRDI) product suite [2], which is part Release 5.0 of Rational’s Collaborative Lifecycle Management (CLM) [1]. Initial parts of Jazz Reporting Service had already been release as part of the IBM Rational Focal Point™ Dashboards for Planning and Execution Add On [3] with Focal Point 6.6.1 as well as the IBM Rational Engineering Lifecycle Manager (RELM) [4]. Jazz Reporting Service defines a set of open specifications for multi-source query [5] and report resources [6], as well as REST APIs for reading and creating report resources – giving custom applications the ability to dynamically generate reports. Jazz Reporting Service also provides a Web application with report rendering capabilities that follow the OpenSocial [7] specification, allowing Jazz Reporting Service report gadgets to be available in any OpenSocial container.
Jazz Reporting Service provides in its initial release a new set of out of the box reports as OpenSocial gadgets for dashboards with a focus on cross-project collaboration application lifecycle management using data of interrelated artifacts of the CCM, QM, and DNG applications [1]. The Jazz Reporting Service application that renders these reports is easy to deploy in its own or an existing CLM application server and provides an integration with the CLM dashboards through the common widget catalog. Once set-up CLM users find in this widget catalog 21 new reports. This article walks you through several of these new reports and discusses usage scenarios for them.
Up and running
Once you have installed and configured the Jazz Reporting Service and integrated it with your CLM servers [8] all your users can immediately access the new set of reports for their dashboards. To do so open the dashboard gallery by clicking the Add Widget button and select the new Jazz Reporting Service catalog. Here you can start browsing through the gallery of reports. As you see by the thumbnails shown next to each report we provide a mix of table and different kinds of chart reports. Once you found a report of interest click on the report name to get to a more detailed description.
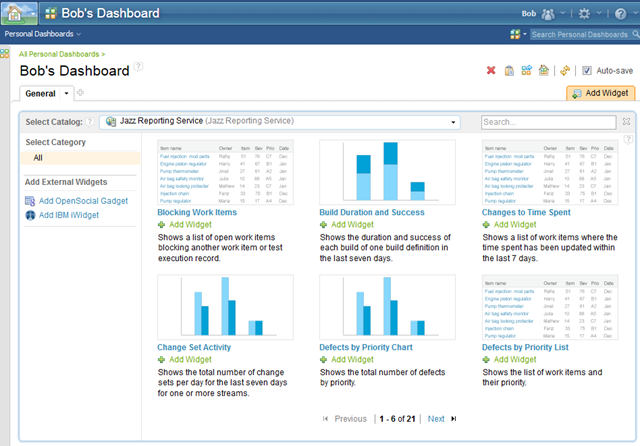
Figure 1: The Jazz Reporting Service reports gallery in a CLM dashboard.
Once added to the dashboard the report will prompt you for filtering parameters that allow you to set the scope of the report to the projects and development iterations that you are interested in and for which you have access. Such selected filters are then saved with the dashboard and can be changed at any time by using the Filter and Edit buttons.
The following sections show you a few sample reports available to you for various usage scenarios. The data shown in the examples below has been taken from a fictional, simplified demonstration set-up and is not representative of a full real-life usage. However, you can look at the Jazz Reporting Service reports in the context of our own development work hosted on jazz.net [9].
A quick glance at progress with cross-project status reports
If you have worked with CLM reports in the past then you know that all reports provided by CLM are using a single-project area scope. Even reports that provide traceability across the CLM lifecycle projects start by selecting one QM, CCM, or DNG project area and follow the traces to linked project areas from there. As you will see in this and the following sections, Jazz Reporting Service reports are mostly cross-project, allowing you to compare data from multiple projects, teams, or timelines with one another.
If you are running a program of multiple projects or releases that comprise of multiple applications or components, which are being developed by multiple teams in parallel, then you would be interested in high-level overview reports of the status of these releases. You might also want to run reports with more detailed information allowing comparison of specific aspects of these parallel releases. For example, you want to compare how each team is progressing with burning down story points in the current iteration, or how they are doing fixing defects.
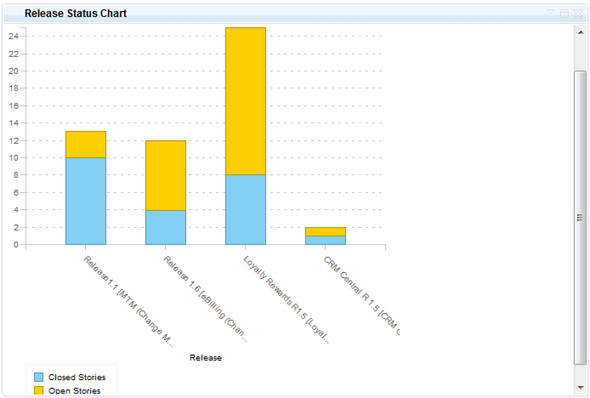
Figure 2: Release Status Chart report comparing story burndown of different application components.
The Release Status report shown in Figure 2 provides such a quick overview of the progress. In this example its data has been rolled-up from the current development iterations to the release level of four application that are being developed in one program and released together as one suite of applications. This report focuses on the completion of the total number of stories in the current development iterations. By hovering over the chart with your mouse in the dashboard you can read the exact numbers represented by each bar segment.
Figure 3 shows you a second report using the exact same data query, but presenting more details of that query as a table. This report also counts open versus closed stories, but breaks these numbers down by team area. It also adds counts of defects that have been fixed by each team as well as how many defects are still open, giving you a quick glance at the amount of defect work impacting regular story burndown. To drill down more in to which stories a particular team is working on click on the number of stories link for that team. This will open a sub-report, listing all the stories on which the selected team is working in the current iteration. In a similar fashion you can also look at the list of stories open or closed for any team.
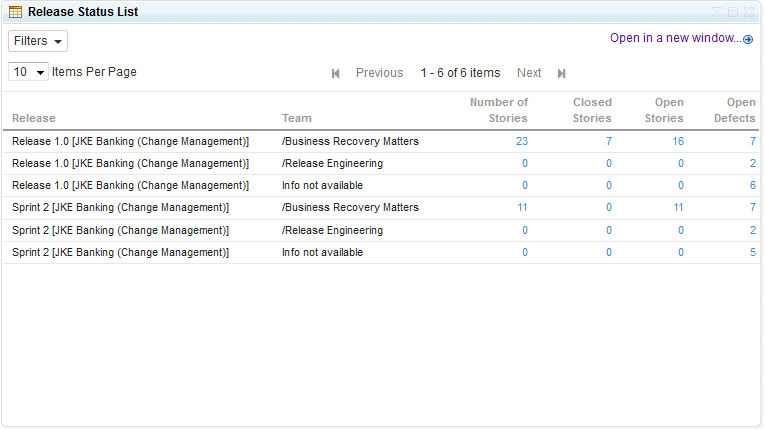
Figure 3: Release Status List adding defect counts and breaking down progress by team.
To drill even further into the ongoing development progress of these application releases we provide another report that shows an even more detailed breakdown. In addition to counting the burndown of work, the Iteration Health report of Figure 4 shows the dates for each iteration as well as explicitly how many days of development are still left. It is dependent on the current iteration for the associated timelines. You can also see the list of work items completed or remaining in an iteration. This will give you details to decide which work items, out of the remaining ones are of high priority depending on the number of days left in the iteration.
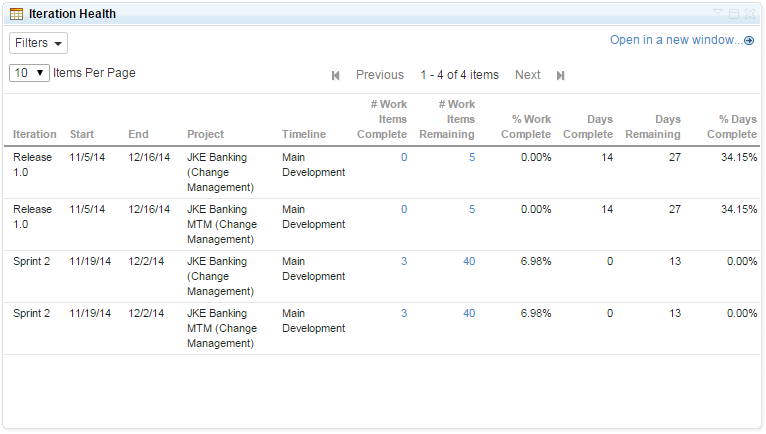
Figure 4: Iteration Health report breaking down iteration progress.
Finally, we show you the Team Velocity report in Figure 5 as another drill-down that focuses now on one development team of one of the application releases only. It provides the trend data for a team burning down story points in each iteration. In the example of Figure 5 you see how the team working on the "JKE Banking" application already completed the story work of 45 points in "Sprint 1". The "Sprint 2" bar shows how many points have already been planned for the next iteration Sprint 2, which are 49. It even shows the size of the "Product Backlog" which is no backlog.
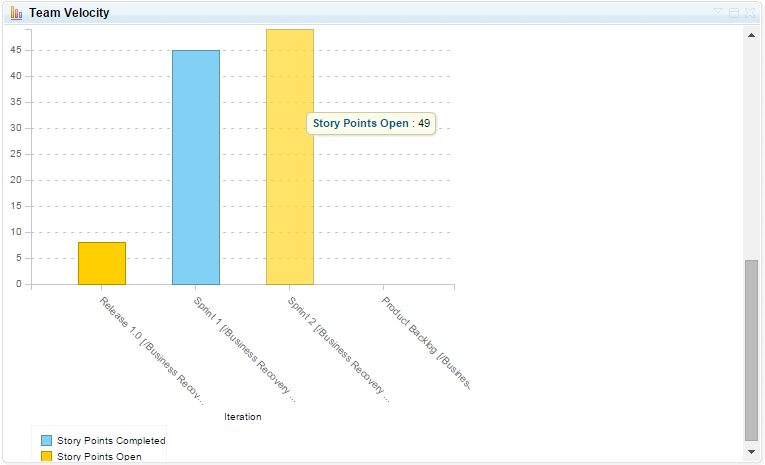
Figure 5: Team Velocity report showing the story points burned down by a team from iteration to iteration.
Keeping tack of the iteration scope and feature creep
In addition to tracking progress of planned work across development teams Jazz Reporting Service also provides you with reports for keeping track of your iteration scope. Speaking in Scrum [10] terms, if you as a development team value the stability of your committed sprint backlog then you want to keep track of items that do get added or removed during an iteration. Jazz Reporting Service provides two reports to do exactly that.
Figure 6 shows you the Scope Added report, which lists the items that got added to the current iteration of a selected Project Area Timeline [11] after that iteration had started. As you may not want to show items of all types in such as list (e.g. you may want to exclude newly uncovered Impediments or even Defects), you can use the Work Item Type filter to specify the types that you are interested in tracking. The example reports shows three story items that got added to the current iteration "Sprint 2 (1.6)". It shows for each item the size, the creation date, and if applicable which iteration it had been added from, i.e. if it is a newly created story or moved from another iteration or backlog. More information can be viewed by hovering over the work item link.
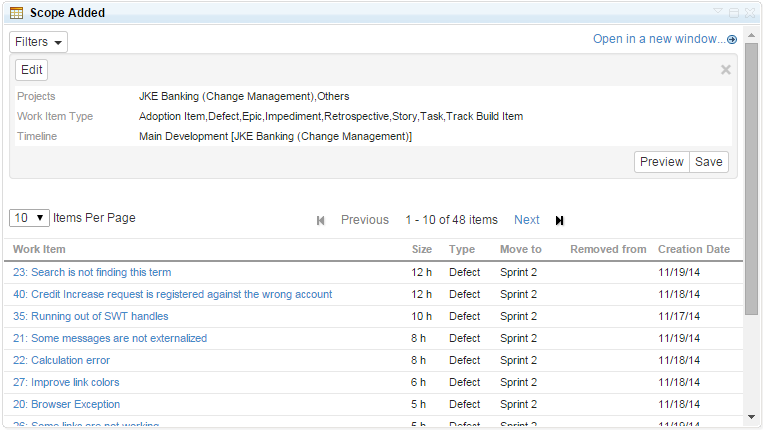
Figure 6: Keeping track of items added mid-iteration with the Scope Added report.
In addition to the Scope Added we provide the Scope Removed report that shows the opposite information using the same filters. It shows which items of specific types have been removed of the current iteration of a selected project area timeline. In this case it shows to which iterations the items have been moved to, such as the next iteration, the product backlog, etc. A compact rendering of the link artifact is displayed if you hover over a work item link as a tool tip. over the work item link.
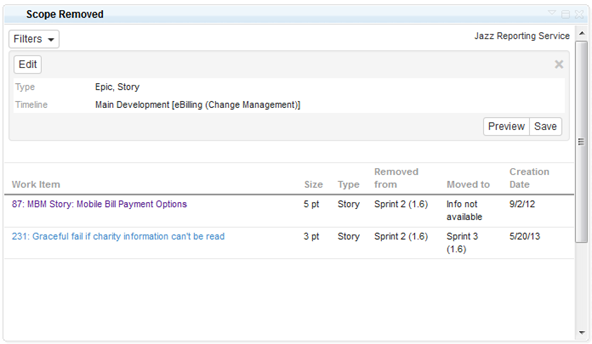
Figure 7: Keeping track of items removed from the current iteration with the Scope Removed report.
Finding team dependencies and blockers
If you are working as a team of teams developing complex applications that comprise of interdependent components or integrated applications then it is important for team members and development leads to immediately see if issues owned by one team block other teams. In CLM’s CCM application you can create Blocks relationships amongst work items such as defects. The Jazz Reporting Service report Team Dependencies depicted in Figure 8 can then be used by each team to show how they are blocked by other teams at the moment.
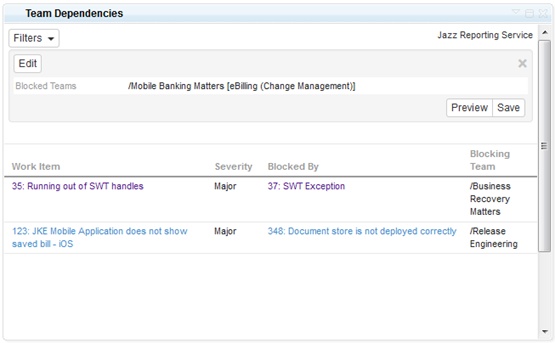
Figure 8: The Team Dependencies report showing defects that block another team’s progress.
The Team Dependencies report shows only work items that are related via Blocked relationships and where the two related items are owned by two different teams. It is filtered by a team area selection, which is the team area that owns the blocked items listed in the report by their severity. It then shows for each of these the blocking items and which other team owns them.
In addition to work items such as defects blocking one another, CLM also has the ability for QM Test Execution Records to indicate that defects uncovered while testing now block the execution of that test. While the Team Dependencies report was showing how a development team is being blocked by other people’s defects, the Blocking Work Items report of Figure 9 now lists for a selected development team all the items that they own, which block other teams’ progress including testers.
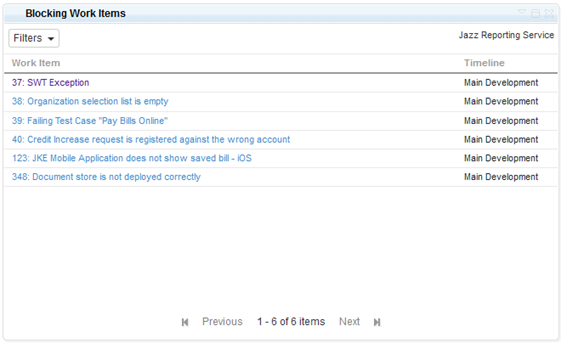
Figure 9: Blocking Work Items report showing items owned by the current team that are marked as blocking either by their severity or blocking test execution in QM.
Understanding the impact of defects
In the last section we saw Jazz Reporting Service reports that list blocking defects that directly impact a team’s ability to make progress, but you also might be interested in finding out what the defect situation in your team is in general and how these defects impact the delivery of the requirements that you team has committed to for the iteration; or even how defects impact the completion of your regression tests in this iteration. Jazz Reporting Service provides three reports for answering these questions. Each of these reports can be presented in your dashboard as a list or a bar chart.
- Defects by priority for a team(s) and the current iteration (chart and list)
- Defects per scoped requirement (chart and list)
- Defects per test case by test plan (chart and list)
Figure 10 shows you an example for the Defect per Requirement pair. It only shows the requirements for which defects were actually found. Defects are counted for a requirement in DNG if it was traced to a user story in CCM that was scoped for the current release, which was tested in QM and which test results were linked to that defect. The report also shows you how many of those defects found testing specific requirements are still open and which ones were closed already, giving you a rough feel for the risk you have for delivering on that specific requirement.
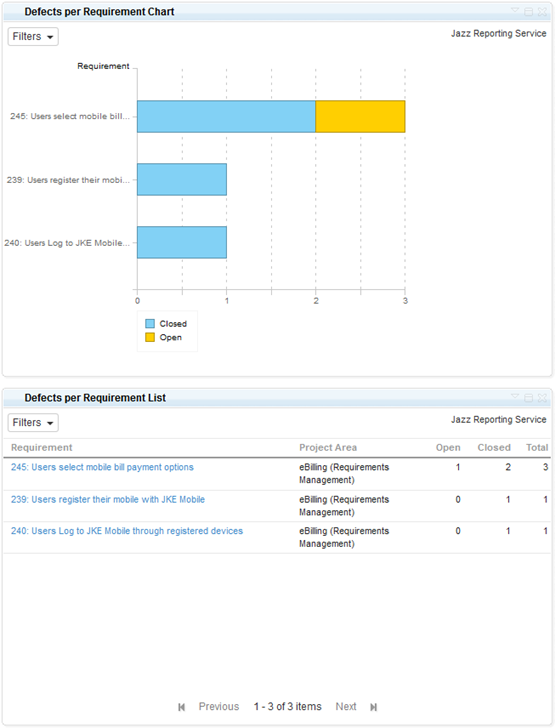
Figure 10: Defect per Requirement chart and list report.
The other reports listed above provide you with similar information. The Defects Per Test Case report allows selecting one or more test plans and then presents the same defect statistics as the requirements report, but related to the test cases of that plan. Finally, the Defects by Priority reports renders a chart and list of defects currently open for a selected team area planned for their current iteration and grouped by their priority. This report can be scoped to one or more projects which gives you an insight of the number of defects per team based on priority as shown in Figure 11.
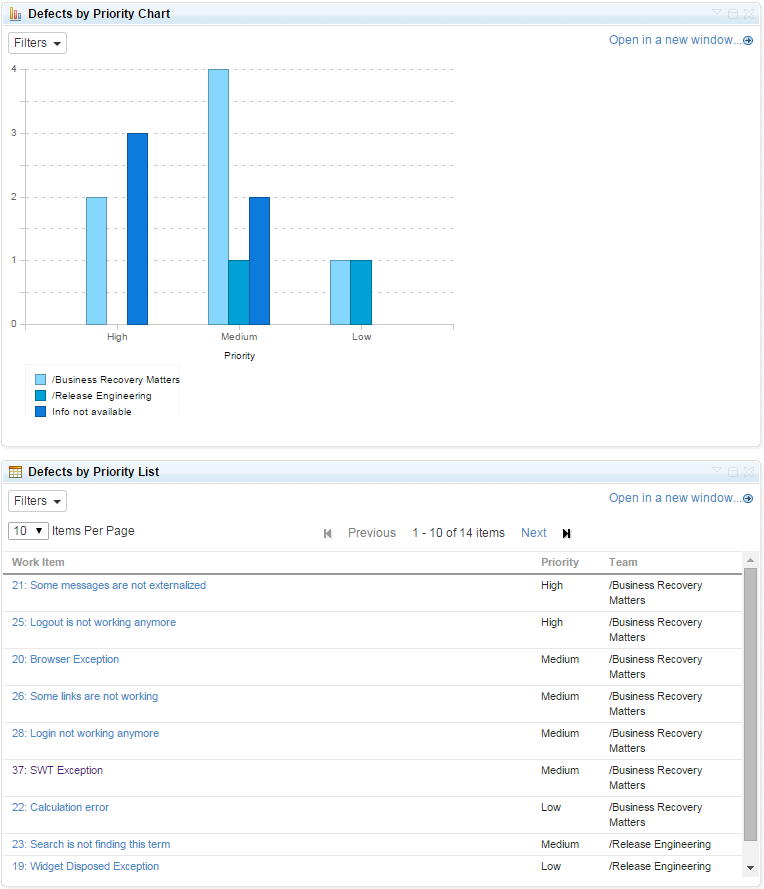
Figure 11: Defects by Priority chart and list report.
Tracing your requirements
In addition to tracing the impact of defects the final group of reports presented in this article focuses on requirements traceability in general.
Let’s start with the Story Traceability report of Figure 12, which provides development teams with a complete CLM traceability coverage overview. It shows for the CCM user stories planned for a specific iteration the traceability links to story elaboration requirements in DNG, links to the stories’ test cases in QM as well as a count of the currently open defects found while testing these test cases. It can be used to uncover gaps in the traceability, such as missing test cases, as well as a navigation aid opening and reviewing related items directly by clicking the active hyperlinks in that report.
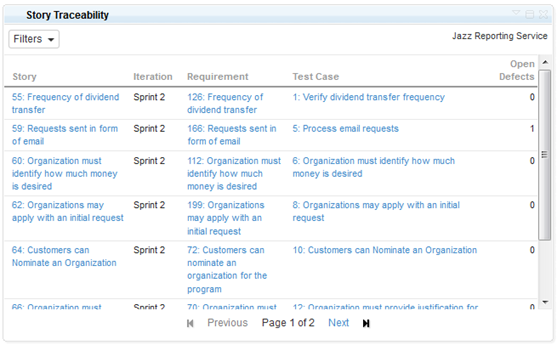
Figure 12: Story Traceability report showing traces from stories to requirements, tests, and defects.
The Story Traceability report in Figure 12 shows a defect count related to the testing of CCM user stories in QM. A more detailed view on the success and failures in testing is provided by the Test Execution per Requirement report depicted in Figure 13.
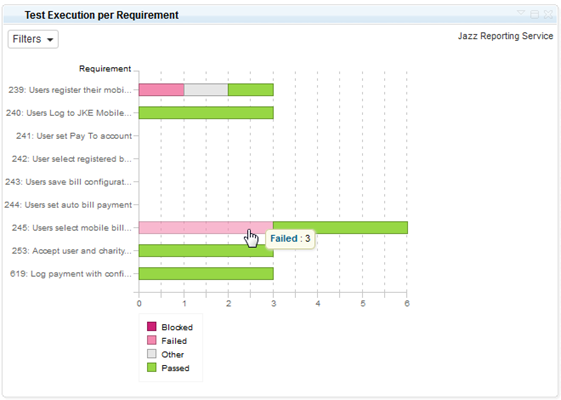
Figure 13: Test Execution per Requirement report showing test success and failure by requirement for a test plan and the current iteration.
For this report you select a requirements project, a test plan as well as the test iteration that you want to focus on. It will then show for each requirement that is linked to a user story with test cases the number of test performed and their success status. This report gives you a very quick overview to the maturity of specific implemented requirements. It can be used to judge what requirements have still a lot of problems and require fixing and which are ready for product owners and external stakeholders to try out in currently available integration builds.
Sometimes you might just need an overview of how many test cases are covering a requirement. For information on the test count for each requirement you can select the project of your choice in the Test Case per Requirement report shown in Figure 14.
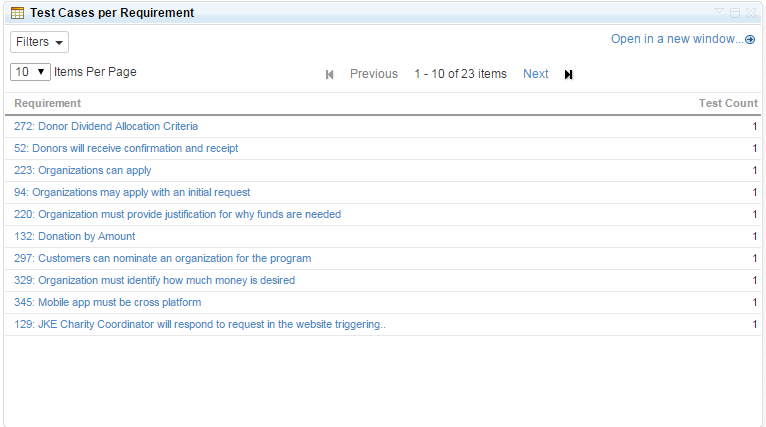
Figure 14: Test Cases per Requirement report showing test cases count covering each requirement
Self-service Reporting
Jazz Reporting Service self-service reporting capabilities gives you the flexibility and liberty to create meaningful reports in a few simple steps. For instance, you can create a report which tracks all the test cases covering a requirement with traceability to defects in the current iteration as shown in Figure 15. You can also scope this report to more than one project. To see this complex report in a simple graphical representation you can, change the report view to graph in the same widget as shown in Figure 16.
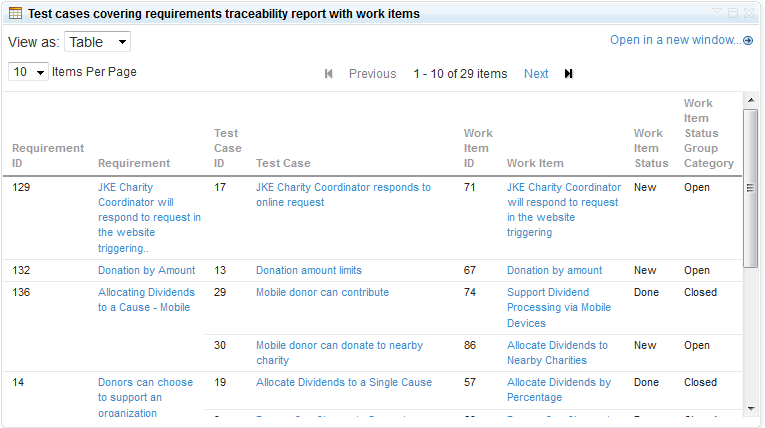
Figure 15: Requirements Traceability report showing traces from requirements to testcases, and defects in a list view.
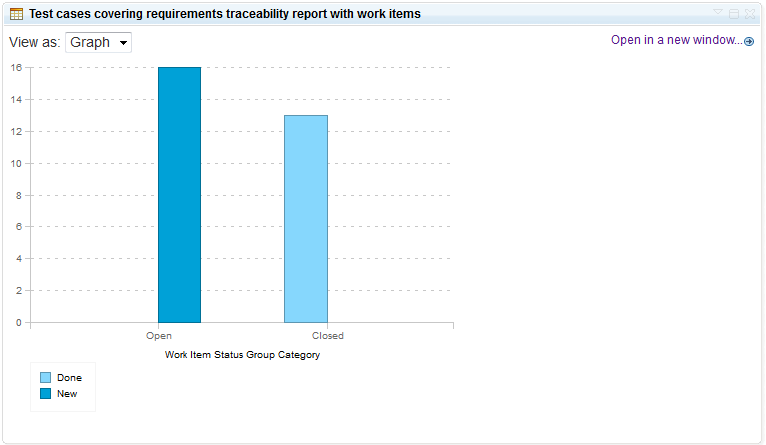
Figure 16: Requirements Traceability report showing traces from requirements to testcases, and defects in a chart view.
Conclusions
In this article we walked you through a subset of the out of the box reports available with the Jazz Reporting Service in CLM 5.0. We covered typical usage scenarios of these reports ranging from cross-project status reporting and scope management, cross-team dependency analysis, as well as defect impact and traceability reporting. There is also a video demonstration and walkthrough available of the reports that have seen here on YouTube [12].
There are more reports available in Jazz Reporting Service that provide additional views on status (such open stories for a team in the current iteration) as well as cover other CLM domains (such as Change Set Activity or Build success). You can view these reports in Jazz Reporting Service UI itself and can also create custom reports according to your own needs. You can create some similar reports to those mentioned in this article customized for your Enterprise. One such report can be Defects by Priority and severity. In this report you can view the defects which are open on the basis of their priority and severity. This will help you make important decisions regarding certain defects. Thus, increasing the productivity and performance of your team.
In Jazz Reporting Service 5.0.2 it is now possible to create your own reports without any advanced knowledge of reporting technologies that can cross project boundaries and life-cycle product domains [13], [14], [15]. The set of Out of the Box reports we provide merely complement this functionality and provide a set of common reports that you could use without any additional effort. To read more about Jazz Reporting Service as a standalone application please read Jazz Reporting Service
References and more information
- [1] Collaborative Lifecycle Management @ jazz.net
- [2] IBM Rational Reporting for Development Intelligence @ jazz.net
- [3] IBM Rational Focal Point™ Dashboards for Planning and Execution Add On homepage @ IBM developerWorks
- [4] IBM Rational Engineering Lifecycle Manager @ ibm.com
- [5] SPARQL Gateway Specification @ jazz.net
- [6] Report Definition Resources @ IBM developerWorks
- [7] The OpenSocial.org Foundation
- [8] Installation roadmap: IBM Jazz Reporting Service @ jazz.net
- [9] The Jazz Collaborative ALM Self-hosting dashboard @ jazz.net
- [10] Schwaber, Ken; Beedle, Mike (2002). Agile software development with Scrum. Prentice Hall.
- [11] Timeline overview in the CLM online help @ jazz.net
- [12] Bater, Robin (2014). Rational Reporting Made Simple: Using Out of the Box Reports @ YouTube.
- [13] Radatus, Catherine (2014). Reporting across CLM projects using the Jazz Reporting Service, Part 1 @ YouTube.
- [14] Radatus, Catherine (2014). Reporting across CLM projects using the Jazz Reporting Service, Part 2 @ YouTube.
- [15] Radatus, Catherine (2014). Reporting across CLM projects using the Jazz Reporting Service, Part 3 @ YouTube.
About the author
Dr. Peter Haumer is a developer in the Jazz Reporting Service team and previously the Portfolio Strategy and Management (PSM) solutions team in Rational. He designed Rational’s Report Definition Resource specification that is the foundation of the Jazz Reporting Service. Before working on report definitions Peter was the component lead for Reporting of the IBM Rational Quality Manager solution. Find a more detailed resume here.
Copyright © 2014 IBM Rational Software