Percent Complete Report Builder Report for All Child Tasks for Each Milestone Work Item
I am trying to build a "percent complete" report that reports that metric for all of the children Tasks for each Milestone within a given Plan. Here are my trace relationships for the Report Builder report:

I would like to evaluate the status of each Task (per Milestone) and publish a bar chart of what percent complete all the tasks are.
I've been successful in using a Custom Expression to create a column that has this percentage value in it, but it will only display in Table mode, not Graph mode.
My Custom Expression is as follows:
(SUM(if($Task:Status$="Completed", 1, 0)) / (SUM(if($Task:Status$="Completed", 1, 0) + (SUM(if($Task:Status$!="Completed", 1, 0)))) * 100
This expression's numerator counts each Task which is complete as 1 and then adds them up.
The expression's denominator counts each Task which is not complete as 1 and adds them up before counting each Task which is complete as 1 and adds them to the previous sum, forming the full universe of Tasks for this Milestone.
In Graph mode, every bar is stuck at 1.

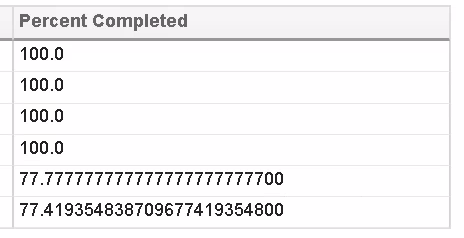
However in Table mode, the correct values are displayed.
Any guidance is appreciated!
Note: Using Report Builder version 6.0.6.1