How to get a meaningful progress bar in plan items in the FORMAL template?
Hello,
This question belongs only to the “Formal Project Management Process” template and we are using 5.0.2.
We would like to understand
- What sense makes the progress bar in the Business Need or any other plan item?
- How will be the process calculated in the FORMAL template (understood in the agile)
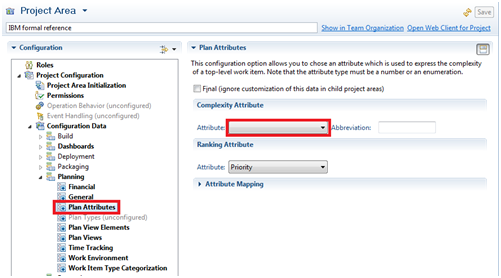
- How to configure the complexity attribute the progress bar calculation in the Business Need makes sense?
- Is it possible to configure hours as complexity?

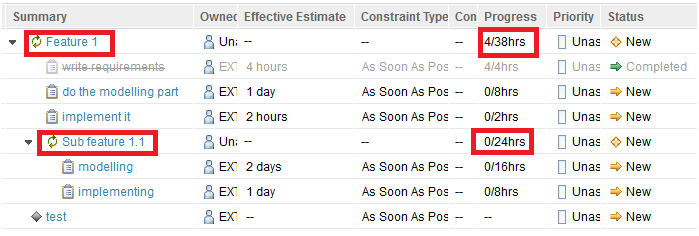
One task with 4 hours is completed all other once are in the new state.
The progress bar of feature 1 looks like this:

Does anyone know
- Why is the progess bar is completed green?
- How is 83 % calculated and what is the difference in calculation between 67 % (see hover over window) and 83 %
- What is meant by “Done 0 of 0 (100%)” ?
I understand the hour calculation and items completed, because the system will calculate only all work items.
The default delivered complexity attribute is empty.

My understanding of what would make sense:
If the complexity attribute will contain the rough and first effort estimation (let say in hours) of the business need the bar should display which effort is already planned with detailed execution items (underneath of the BN) and how is the progress in relation to the planned and rough estimation.
Thanks in advance for any help.
Best regards
Juergen