How to create a burnup report for closed work items in BIRT?
A customer is trying to create a burnup report for opened and closed work items in BIRT. RTC version is 4.0.3.


Data Set retrieves like the below. 'CLOSE_COUNT' is a computed column ( Aggregation:RUNNINGSUM, Expression:row["WI_COUNT"].
DueDate WI_COUNT CLOSE_COUNT
2014/06/01 1 1
2014/07/11 1 2
2014/07/01 1 3
2014/06/21 1 4
2014/07/13 1 5
Q1) How can I sort by "DueDate" in the Data Set?
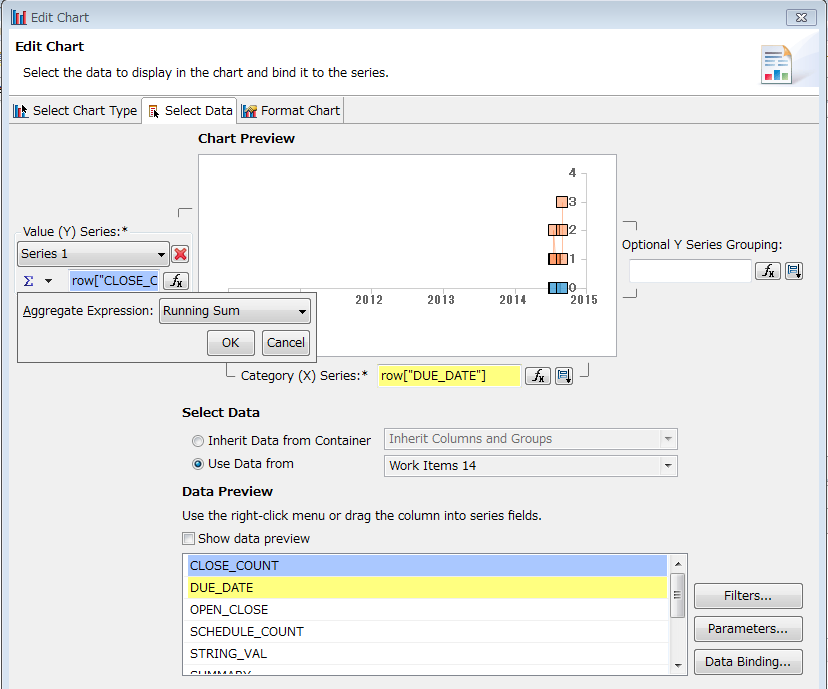
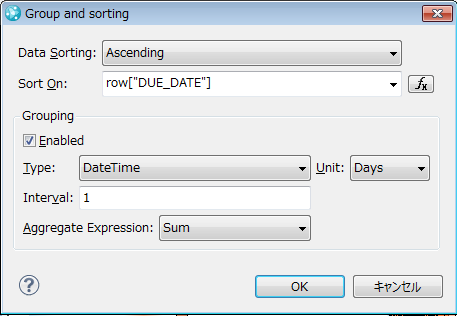
When he created a bar chart ( Category (X) series : row["DUE_DATE"], Date Sorting: Ascending, Grouping Type:DateTime, Unit:Days, Interval:1, Aggregate Expression:Sum),
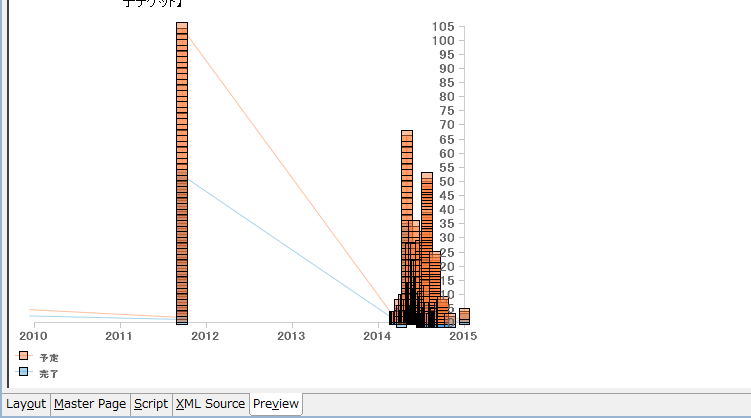
The bar chart is not sorted by row["DUE_DATE", it looks like order by data source.


Q2) How can I sort by "DueDate" to show aggregate sum in Bar chart?
One answer
I will need a copy of your report design file.
Comments
I am waiting for the customer uploading the report design file.
After sending the report design file to Raflik, the comment from him as the below:
--------------------
The attached report is not the same as the one shown in the forum.
The X-Axis value is set to:
var dates = new Date();
if(row["DUE_DATE"] !=null){
dates = row["DUE_DATE"];
}else{
dates = new Date("1970/01/01 0:00:00");
}
Which is wrong as it does not seem to return any value.
User should create a computed column in the data set and use it for both sorting and display in the x-axis.
Rafik Jaouani
--------------------
Comments
Taki Nakajo
Jul 16 '14, 1:18 a.m.Does anyone know how-to?