Jazz Forum Welcome to the Jazz Community Forum Connect and collaborate with IBM Engineering experts and users

How to display a portion of a graph - RRDI 2.0.1

Hi Guys,

I am using RRDI 2.0.1.

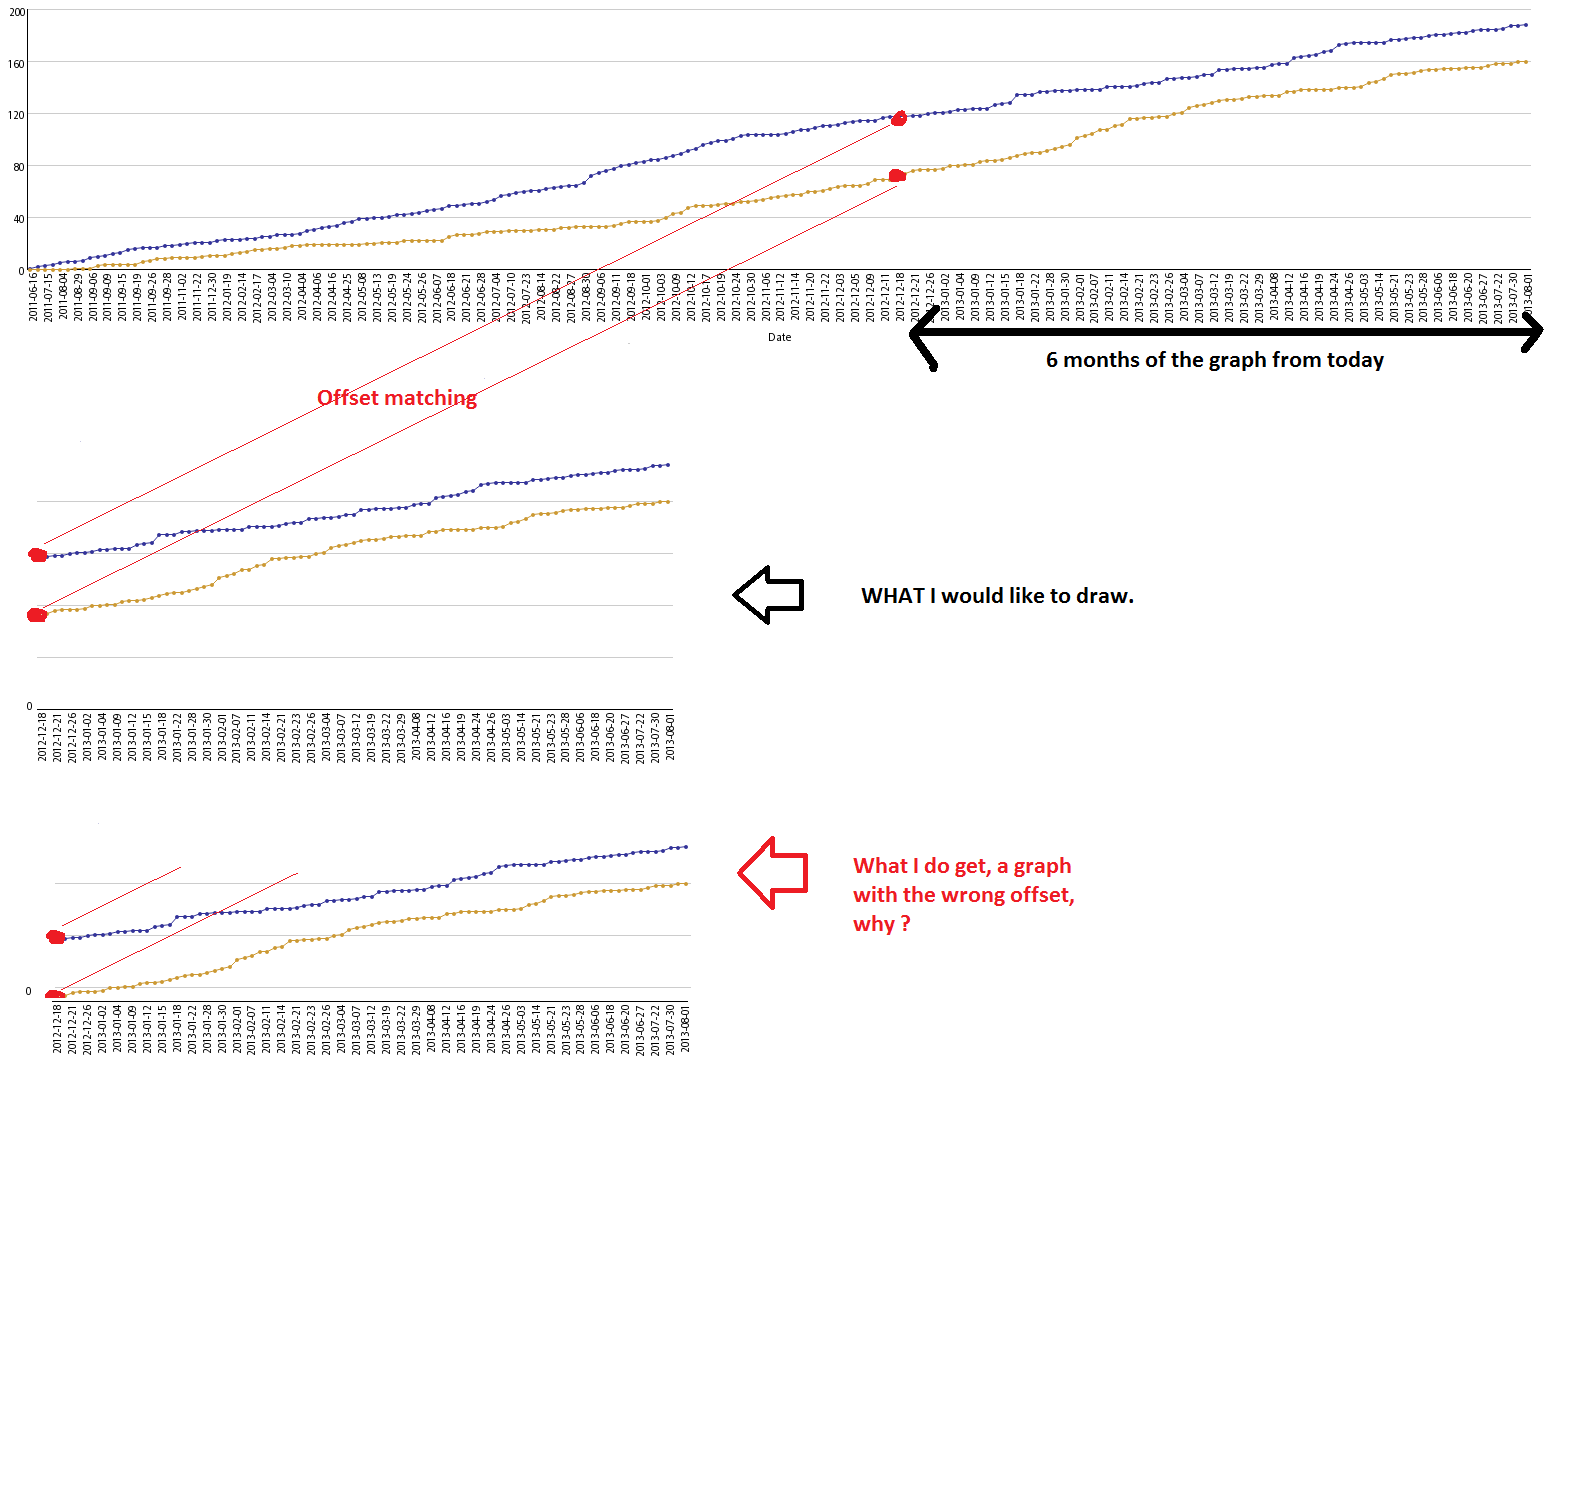
Here is what I would like to do, very simple but I did not sort it out :

I do have a graph (x,y) where x represents a date and y represents a data. This graphs start in 2011 and ends in 2013 so it is too large when displayed and cannot be exploid. The value of y is rising during the 3 years.

So I would like to display only the last six month from today with the right offset of the y value. The problem that I do have is that when I do display the graph on the last six months the value of y is set to zéro and does not take into account the value of y six months ago from the full graph (3 years).

How do I extract and display a portion of an existing graph without starting the y value to 0 ??

I did join a picture to explain graphically my difficulty. Wrong offset graph Many thanks for your help.

Best regards.

Karl

0 votes


One answer

Permanent link
To share a solution, it's possible to create a linked query with a filter like
[Date]>to_char(add_months ([today],-6),'YYYY-MM-DD')

to get only the last 6 months of data in the graph.

Best Regards,

Francesco Chiossi

1 vote

Your answer

Register or log in to post your answer.

Dashboards and work items are no longer publicly available, so some links may be invalid. We now provide similar information through other means. Learn more here.

Search context
Follow this question

By Email: 

Once you sign in you will be able to subscribe for any updates here.

By RSS:

Answers
Answers and Comments
Question details
× 12,127
× 403

Question asked: Aug 08 '13, 5:48 a.m.

Question was seen: 5,817 times

Last updated: Jan 22 '14, 11:52 a.m.

Related questions
Confirmation Cancel Confirm