
IBM Rational Team Concert
Task tracking � Source control � Agile planning
Rational Team Concert 6.0.2 New & Noteworthy Details
For a summary of new and noteworthy items in this release, see the New & Noteworthy Summary.
For a complete list of items in this release, see the following details.
Tracking and planning
My Stuff
Create work items from My Stuff views
You can now quickly create work items from the following views on the My Stuff page:
- My Work
- My Subscribed
- All Work

By default, the work item is created in the first project of the selected projects. You can change the project by using the project area button as shown in the following image.

You can use other buttons below the quick create box to provide values for the following attributes of the work item:
- Type (*)
- Description
- Filed Against (^)
- Owned By (@:)
- Priority ($)
- Severity (!)
- Tags (#)
- Found In (>)
- Due Date
- Subscribed By (@)
- Parent (->)
You can provide a summary of the work item by typing into the text box. You can also provide these attribute values directly in the text box. For help with possible entries, press Ctrl+Space.

Enhancements in filtering
You can now add subscribers as a filter criteria. You can provide a short-form filter by using the identifier "@" or you can give a full-length filter.

The following short-form identifiers were added for filtering:
- Filed Against (^)
- Found In (>)
Editing custom view properties on the My Stuff page
A new properties dialog box is available for custom views. To open the dialog box, click the drop-down symbol on a custom view entry in the side menu.

The menu also provides a quick sharing option:
- <Selected Projects>: Share the current view with the projects that are selected in the Project Selection drop-down list at the top of the page.
- <My Projects>: Share the current view with my projects (the projects of which I am a member).
- <All Projects>: Share the current view with all available projects.
- Unshare: Completely unshare the current view.
You can also open the properties dialog box when you create a new custom view by clicking the Save button.

You can use the dialog box for these actions:
- Change the view's name.
- Set whether the view should filter for a given iteration.
- Change the view's sharing properties.
- Add and remove tags on the view.

To add tags or sharing properties, use the plus sign (+) icon on the right of the appropriate dialog box section.
My Recent view
This release adds a new view called My Recent to the My Stuff page. The My Recent view shows all work items that you recently viewed (from the work item editor) and modified (either on the My Stuff page or Quick Planner page).
Quick filter variables
Filtering on the My Stuff page supports the following variables:
- Current User variable: A variable that matches the current user.
- Current Iteration variable: A variable that matches the current iteration.
- Unassigned variable: A variable that matches no iteration.
Quick Planner
My Recent view
The My Recent view in Quick Planner was enhanced to also show recently viewed work items from the Work Item editor.Quick filter variables
Filtering in Quick Planner supports the following variables:
- Current User variable: A variable that matches the current user.
- Current Iteration variable: A variable that matches the current iteration.
- Unassigned variable: A variable that matches no iteration.
Enhancements for creating work items
Values for more attributes are now supported. You can provide values for other attributes by typing into the text box. To see content-assist suggestions, press Ctrl+Space.
Enhancements in filtering
You can now filter work items by subscribers. In addition, there is added support for more short-form identifiers for filtering.
- Filed Against (^)
- Found In (>)
- Subscribed By (@)

Editing custom view properties in Quick Planner
For custom views, a new properties dialog box is available. To open the dialog box, click the drop-down menu for a custom view entry in the side bar.

Note that the previous menu entries for quick sharing were preserved in the menu.
The properties dialog box is also shown when you create a new custom view by clicking the Save button.

You can use the dialog box for these actions:
- Change the view's name.
- Set whether a given iteration is included as a filter.
- Change the view's sharing properties.
- Add and remove tags to the view.

To add tags or sharing properties, use the plus sign (+) icon on the right of the appropriate dialog box section.
Work items
Work item editor Filed Against category filters Planned For iterations
The values for iterations shown in the Planned For drop-down list (both in the web and Eclipse clients) now depend on the currently selected timeline (Filed Against category > Team Area > Timeline):


Additionally, the work item editor in the web client provides a new dialog box for selecting iterations, which displays all project area timelines and contained iterations in a tree view. Project timeline, current iterations, and backlog iterations are marked with special icons as shown in the following image:

A warning icon and warning tooltip message is shown in both the web and Eclipse work item editor when the selected iteration does not belong to the selected timeline:


You can change or disable the text of the new warning message for the Planned For attribute by using the web or Eclipse project area editor:


String variables in work item templates
Work item templates now support string variables. The string variables must be defined in the format in the Summary or Description fields. Note: The ID can contain only alphanumeric characters and underscores.

When the template is instantiated, each variable is replaced with a user-specified value.

The values that you provide appear in the generated work items.

Note: This feature is supported in all clients (Eclipse, web, and Visual Studio).
Improve email templates
Email templates were extended with two new variables:
Category Path: ${WorkItem.categoryPath}
Outputs the qualified path of the category. By default, the path separator is the forward slash (/). Example: "Development / Server /Services".
Supports the following functions:
- setSeparator(): Change path segment separator. Example:
- get(i): Get specific path segment. Example:
Subscribers: ${WorkItem.subscribers}
Returns a list of subscribers of a work item (each represented by the existing variable). The new functionality is similar to that of the variable.
Supports the following functions:
- get(i): Get ith contributor from the list. Example:
- takeFirst(i): Returns the first i subscribers. Example:
- dropFirst(i): Returns the list without the first i subscribers. Example:
Jazz source control
Baseline history graph
In this release, a graphical view was added that shows how streams and repository workspaces evolved over time and their interactions with one another based on baseline flow operations. This new view enables you to see how changes flow across release streams, easily see where baselines are used in different streams, and compare the contents of two streams or repository workspaces at the time of the baseline operation.
You can open this view from either the Eclipse or Visual Studio client by selecting a component of a stream or repository workspace in the Team Artifacts view.

Show more streams
When you open this view for the first time, it shows only the stream or repository workspace on which it was invoked. The view is a graphical representation of the baseline history view. You can add more streams or repository workspaces to this diagram by clicking the Add Streams icon in the upper right.

Customize the information shown
By default, this diagram shows how baselines flow between streams and repository workspaces. It also hides certain baseline operation nodes that are less important to many users, such as backup baselines that are created as a side-effect when you replace the baseline in your repository workspace. You can change the default settings to filter out certain information, depending on your needs.
Here are the available filters:
- Show only releases: Show only the baselines that are included in a released build snapshot. A released build is one that has been associated with a release on the Releases page of the Project Area editor.
- Hide backup baselines: Backup baselines are created automatically to preserve changes when replacing or removing a component in a workspace or stream. This filter hides those backup baselines in the diagram.
- Hide baselines that do not bring in changes: Not all operations performed on a workspace or stream introduce new changes. This filter hides baseline operations in the diagram that do not contain any additional content when compared to the previous operation on that stream or workspace.
- Hide accepted baselines: Hide operations that represent accept or deliver of baselines to a workspace or stream.
- Show baselines by a specific filter: Show only those baselines that match specific criteria, such as certain tags or name prefixes.
Show all information to debug a build issue
As a release engineer, I want to see recent builds, what was included in them, and how they were delivered (or accepted) into other streams.
To track the issue, you can add all repository workspaces and streams that are involved in the build process and turn off all the filters, which results in a view similar to the following one.

In this example, the team has an "SCM Integration Stream" where developers deliver their changes for the SCM component, and a corresponding "SCM Integration Build Workspace" where the build runs. When a build passes testing, it is delivered to the "GZ SCM Integration Stream" (which is a "green zone" used for final testing), before delivering changes to the higher level "RTC Integration Stream."
Show how streams are branched and merged
As a release manager, I want to see when a side stream is branched for a different release or development work, and when it is merged back into the main stream.
In this case, you do not want to show the intermediate streams and repository workspaces that are involved in the build process. Instead, you can show only the two main streams. Showing the individual baselines will show when the streams are branched and merged.

The previous example shows the main development stream, which in this case represents the 6.0.2 release, and a side stream used to work on "Feature X." The history graph shows that the "Feature X Side Stream" forked from the 6.0.1 final build initially. It also shows that it accepted some fixes from the main stream and eventually created a "Side Stream Baseline 1" at presumably a stable point in the feature development. You can see that this baseline was then merged back into the main stream shortly after.
Show baselines for final releases only
As a product manager, I don't want to see all the details for daily builds, branches, and merges; I want to see only the baselines that represent final releases.
In this case, you do not want to show the intermediate streams and repository workspaces that are involved in the build process. Instead, you can show only the two main release streams. Showing the individual baselines will show when the releases are branched and merged.
In this case, you filter out all baselines except for those that were released, as shown below.

This view shows an example of a component that is reused in multiple products. The Map team develops and releases new versions of the Map Component. The GPS team reuses certain releases from the Map team in their GPS product. The Phone team reuses certain releases from the GPS team in their Phone product. Therefore, the Map Component is included in releases in all three streams. This view shows all the releases.
Operations supported in this diagram
You can perform the following operations from this view:
Compare baselines
You can select any two baselines in the diagram and see their differences. This feature is useful when you need to determine what is included in a new build or what has changed between two releases.

Show baseline repository files
You can select any baseline in the view and see its contents. This feature is useful for developers to dive into the details of a baseline to debug problems.

Other features
Remember the last viewing preferences for a component
For convenience, Rational Team Concert remembers which streams were displayed and which filters were set the last time you viewed a component, and opens the view the same way the next time you open that component. This setting is saved for each user for each component.
Show the view in an external browser
You can choose to open the view in an external browser. The operations that open native client views (compare baselines, show baseline repository files) are not available from an external browser.
The following image shows the option for setting the Eclipse client to show the Baseline History Graph in an external browser.

Show baseline history graph in Shell client
You can also open the baseline history graph from the Shell client but it is displayed
in an external browser. You can still interact with the graph but you can't perform
operations, such as compare baselines, that require full, rich client support.
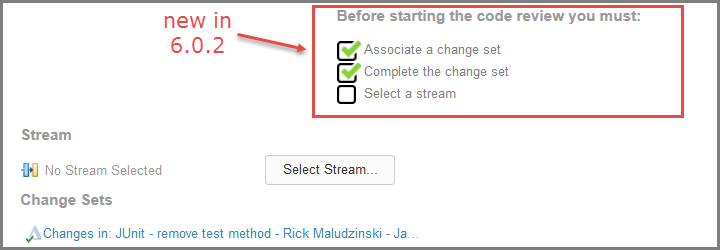
Code review usability improvements
Several enhancements were made to the code review feature that was first introduced in 6.0.1:- A checklist is available to guide you through the requirements needed to start a review.
- You can now select intermediate before and after states in the compare editor.
- You can create work items from issues.
- You can now select before and after states in the compare editor.
- You can export code review data in JSON or XML format for reporting.
- Administrators can delete code review issues.
Code review checklist
The code review section was modified to provide a checklist that guides you through the requirements that must be satisfied to start the review. The requirements are as follows:
- Change sets must be associated with the work item.
- The change sets must be completed.
- A target stream where the changes will be delivered must be set.
Ability to select before and after states in the compare editor
You can now select the before and after file states of the associated change sets by using a drop-down list in the compare editor. With this feature, you can now perform code reviews even if the change sets contain gaps.

Create work items from issues
You can now create work items from issues raised during a code review. This feature is useful if a valid issue is raised that requires additional development work, but is not necessarily part of the current review cycle. In the following image, you can see that work items 51 and 52 were extracted from the issue editor.

Click ![]() to open the dialog bos to create a new work item with the Summary field populated and a link as shown in the following image.
to open the dialog bos to create a new work item with the Summary field populated and a link as shown in the following image.

New command to export code review data
A Command Line Interface (CLI) command was added to generate a code review report based on a work item query. Two output formats are supported: JSON and XML. Example:
scm export code-review <queryID> <outputFile> <format> [<includeCsDeliveryInfo>] -r <login details>where:
- queryID is the UUID of a work item query that returns a set of work items that have had a code review
- outputFile is the location of the code review data to be saved
- format is the required output format ( JSON or XML)
- includeCSDeliveryInfo is used to determine whether to extract the delivery information for the attached change sets. Include this information if you want to extract the information; otherwise, leave it blank.
Ability to delete data from code review
You might need to delete data for several reasons. A comment might disclose classified information, or a reference to material might later become classified. Now, project administrators have the ability to delete issues. Administrators (with JazzAdmins repository permission) can now use a Delete button in the issue editor as shown in the following image. Clicking Delete opens a dialog box that prompts whether to proceed. After an issue is deleted, it cannot be restored.

Locking streams and components
You can now lock streams and components in streams to prevent deliveries to the files in those streams or components. Stream and component locks work in a similar manner to file locks but apply to the entire stream or the entire component in a stream. When a stream or component is locked, any attempted deliveries by users who do not own the lock will fail with an appropriate error message. The user that holds the lock can still perform deliveries to the stream. A lock does not only prevent deliveries, it also prevents any operation that affects the files in the locked component or stream. For example, a component replace is also prevented.
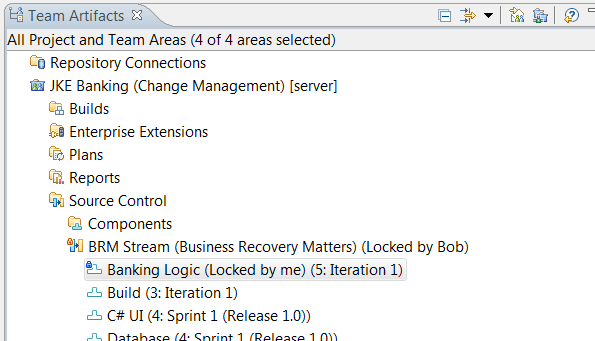
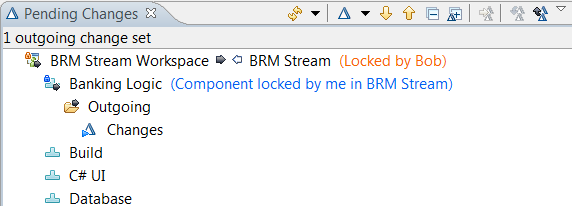
The previous image shows a stream that is locked by Bob and a component in that stream that is locked by the current user. Streams and components in a stream can be locked and unlocked from the context menu in the Team Artifacts view and are decorated in that view, as shown in the image. For components, actions to lock and unlock a component hierarchy are also provided. Decorations also appear on Workspaces in the Pending Changes view when a lock exists in the stream or component that is the currently active outgoing flow target for the workspace, as shown in the following figure. The current user cannot deliver a change because, even though he owns the component lock, Bob owns the stream lock.
The ability to lock a stream or component is controlled by a role-based permission, as shown in the following image. Anyone with a role that has the permission assigned can lock or unlock a stream or component. In addition, users with the required permission can transfer a lock from another user by requesting the lock themselves.

Locks in the Repository files view
A decoration is now shown on files, components, and streams in the Repository files view. When the view shows files for a stream, the locks in the stream are shown. When the view shows files for a workspace, the locks in the stream that is the outgoing flow target are shown.

Component hierarchies in the Pending Changes view
Component hierarchies appear in the Pending Changes view as shown in the following image. The hierarchy shown is the hierarchy in the workspace. Decorators for incoming, outgoing, and unresolved changes, as well as conflicts, are propagated to parent components.
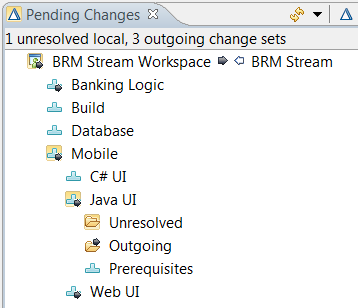
You can enable and disable the display of components in a hierarchy on the Team/Jazz Source Control/Changes preference page.

Local change preservation on accept
Several actions update files in a repository workspace, including accept, resume, discard, or replace. If the repository workspace is loaded into a sandbox when these actions are performed, any conflicts between local changes that are not checked in and changes that are accepted result in losing the local changes. For this reason, users are always prompted about changes that are not checked in when they perform one of these actions.
In this release,these actions were enhanced to preserve the local changes in most cases. If a file has conflicting changes, the contents are automatically merged if possible. If it is not possible to merge the changes, a local conflict occurs so you know about the conflicting changes, as shown in the following image.

In some extreme cases, local changes cannot be preserved in-place. For this reason, the prompt still occurs when accepting or performing one of the other mentioned actions. Also, a Jazz Source Control console was added where you can see which files were backed up either to the Eclipse local history or to the SCM shed, as shown in the following image.

Load workspace into sandbox subfolders
In the Eclipse wizard for loading workspaces into the sandbox, you can now specificy a subfolder within the sandbox in which to place the workspace component files. This feature makes it possible to load multiple workspaces within the same sandbox even if the workspaces contain the same component with different content.
In the Load wizard, in the Advanced Option section, you can load component files into a subfolder of the sandbox. You can specify the subfolder or you can use the default folder with the same name as the repository workspace. With this option set, you can load multiple versions of the same component to the same sandbox, which enables the development of multiple versions of similar software without switching sandboxes. Note that if you use Eclipse projects, loading Eclipse projects with the same name causes problems for Eclipse, even if you load the projects in different subfolders.

This option is off by default, so the behavior doesn't change from earlier releases. After the option is set and a folder is selected, the setting is used for all future loads for that repository workspace. To change this setting (either to turn it on or off, or to change a subfolder), unload the repository workspace and use the Load wizard to change the setting when you load the repository workspace again.
You can change the default setting on a project area basis, which means that all repository workspaces that have a flow target that is a member of the project area can have the usage of subfolders during load turned on by default. The individual setting of the repository workspace still overrides the default setting for the project area. You can change the default setting for a project area from both Eclipse and the web client.

In the web client, you can change the default setting for a project area under the Source Control > Sandbox Subfolder of the project area.

In the Eclipse client, you can change the default setting for a project area on the Process Configuration tab of the project area, under Project Configuration > Configuration Data > Source Control > Workspace Sandbox Subfolder.
Move files across components in the CLI
Before this release, you could only move folders from one component to another while preserving the file history. Now, you can move files to another component by using the SCM CLI. The general syntax of the command is as follows:
scm move repository-path -w <workspace>
-S <source-component> -D <target-component>
source-file-path destination-parent-path
For details, see the CLI help (scm help move repository-path). Example:
scm move repository-path -w "My Workspace"
-S "Team Component" -D "Other Component"
/JavaMan/src/a/b/E.java /Project/src/a/b/
Display the sandbox structure in CLI
You can load a workspace in many ways. You can load projects in the component root folder or into a deeply nested directory in the sandbox. Running the status subcommand only shows which components are loaded, but it is not immediately apparent where these components are loaded in the sandbox. A new CLI command displays the sandbox structure. The general syntax of the command is as follows:
scm show sandbox-structure -w <workspaceName> -C <componentName> <-json>
For details, see the CLI help (scm help show sandbox-structure). Example:
scm show sandbox-structure -w myWorkspace -C teamComponent
This command enables you to know the exact location of the loaded projects in the sandbox. The output of the command shows the sandbox location, local path, and remote path of a project in the file system. A sample output for a sandbox loaded with two projects, proj1 (loaded from workspace ws1, component comp1 in root directory sb) and proj2 (loaded from workspace ws2, component comp2 in nested directory child), will look as follows:
>lscm show sandbox-structure
Sandbox: C:\cli\sb
  Local: C:\cli\sb\proj1
    Remote: ws1/comp1/proj1/
  Local: C:\cli\sb\root\parent\child\proj2
    Remote: ws2/comp2/proj2/
Jazz build
Dynamic load rules support in Rational Team Concert plug-in for Jenkins
The Rational Team Concert plug-in for Jenkins now includes support for dynamically providing load rules when loading sources from a build definition or workspace. The capability is exposed through an extension point in the Rational Team Concert plug-in for Jenkins. For more information, see the wiki on dynamic load rules support.
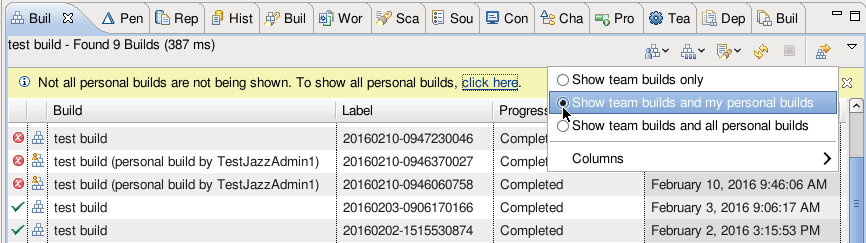
Personal build filters
The Builds view has an option to display only the personal builds that the current user requests.
Enterprise platform extensions
Dependency build and promotion
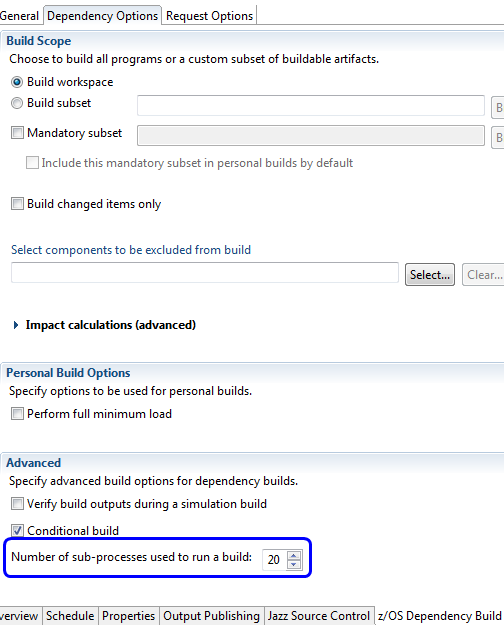
Multiple process builds
z/OS dependency builds now support using multiple processes for compilation activities. You can select the number of processes in the build definition editor on the Dependency Options tab of the z/OS Dependency Build page.
Further detail on reason for full analysis
The build log for a dependency build now contains further information if preprocessing runs a full analysis instead of a change set analysis. The log information can help identify the changes and configuration conditions that caused that analysis type to be executed.
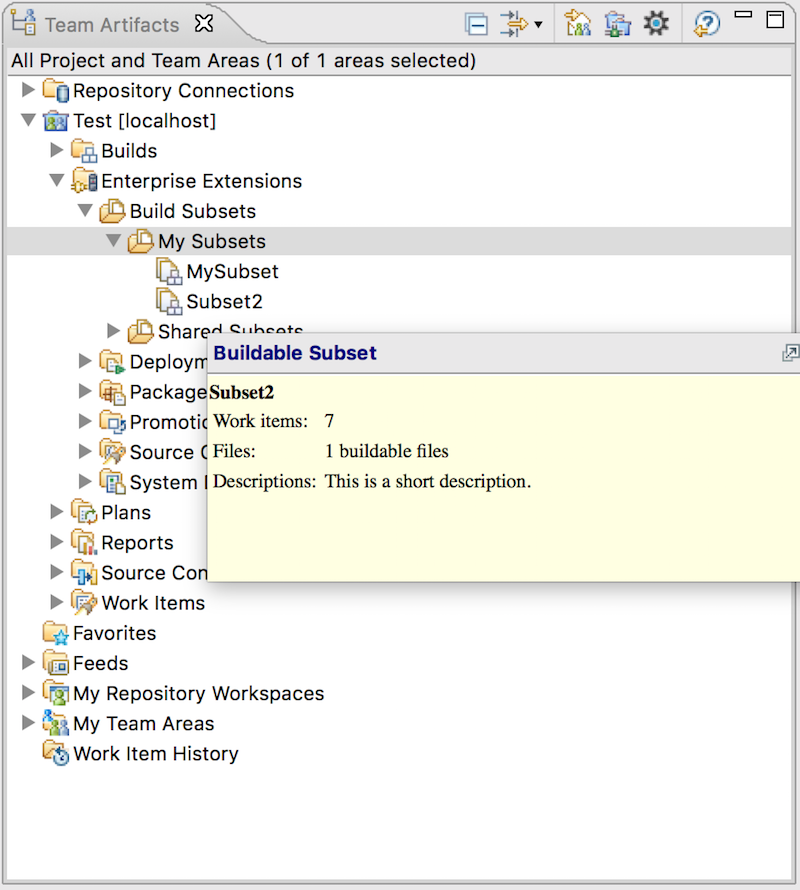
Tooltip information for buildable subsets
When you hover over a subset in the Rational Team Concert Eclipse client, a tooltip displays associated work items, the number of buildable files, and a description.
Changes to retrieve file details
The Open Local File and Open Remote File selections are available from the context menu of the Source Location column in the Files from the build machine produced by other builds table when the value of the column is not empty.

Build log publishing
Log publishing batch size
The performance of log publishing during z/OS builds is substantially improved. The connection to the repository is reused, which reduces overhead, and logs are published to the build result in batches. You can configure the batch size on the Output Publishing tab of the build definition editor. The default batch size is 10.

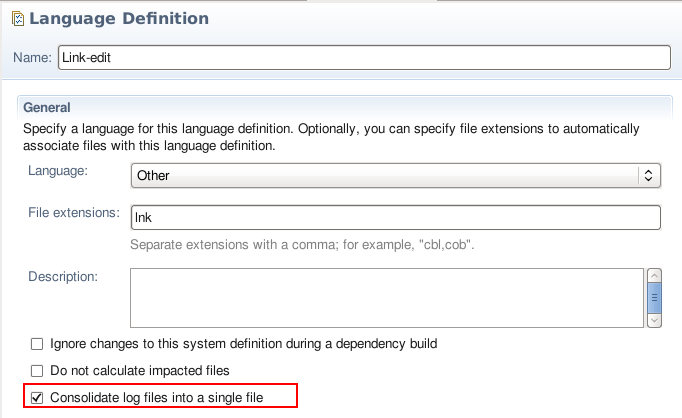
Consolidating log files
The Language Definition editor now contains an option to consolidate all published log files for a source member into a single file.
Compacting log files
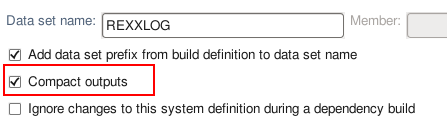
You can now choose to compact log files produced during z/OS builds. When log files reside in a physical PDS they are compressed to save space. When they are uploaded to a build result, trailing whitespace is removed. Compacted log files in the PDS can be uncompressed in TSO using BLZCMD.
In the Data Set Definition editor, you can provide a default value for the compact setting, which is used when the DD has its Compact option set to Inherited.
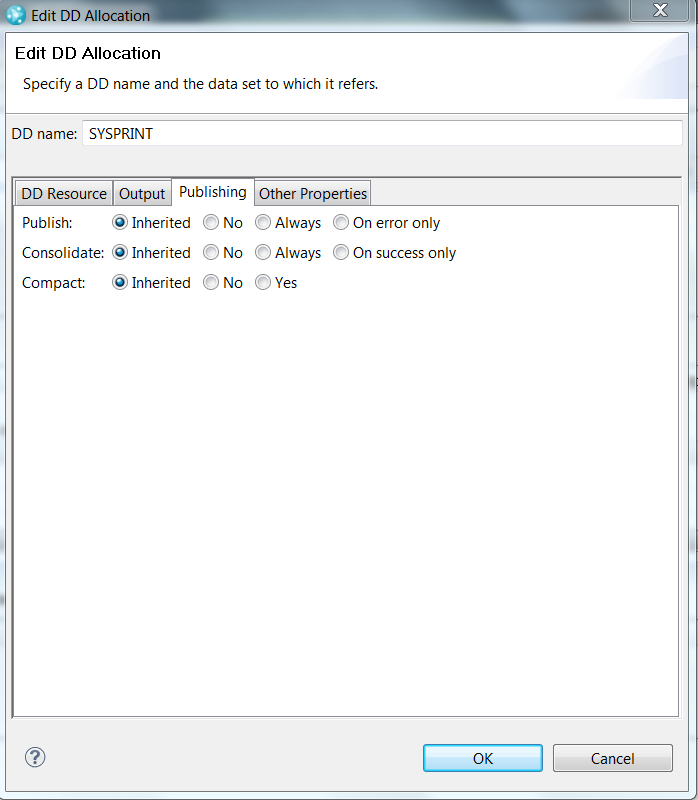
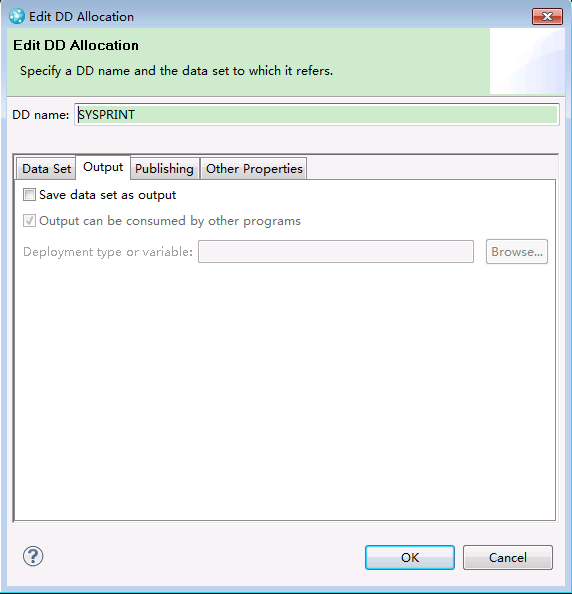
DD allocation publishing options
Log publishing options can be overridden for individual DD allocations. You can change whether and under what circumstances an output is published, and whether and under what circumstances the published output creates a consolidated log file.
Publish Output setting:
- Inherited: Publish logs in both PDS and build result, according to the settings in the build definition.
- No: Publish logs in PDS only, for successful and failed builds. Logs are not published to the build result.
- Always: Publish logs in both PDS and build result, for successful and failed builds.
- On error only: Publish logs in both PDS and build result, when the build fails.
The publish output setting in the Edit DD Allocation dialog box has a higher priority than that in the build definition. For example, if Publish job output logs is not selected in the build definition, but Always is selected in a DD allocation dialog box, the related logs are still published into the build result according to the individual log publish setting. The Publish successful logs as zip files option in the build definition is now always available, even when Publish job output logs in the build definition is not selected.
Consolidate Output setting:
- Inherited: Use the consolidated log file setting from the language definition.
- No: An individual log file is always used for this DD, regardless of the language definition setting.
- Always: A consolidated log file is always used for this DD, regardless of the language definition setting.
- On success only: A consolidated log file is used for this DD when the translator step succeeds, otherwise an individual log file is used.
Compact setting:
- Inherited: Use the compact log file setting from the data set defintion.
- No: The log is left alone.
- Yes: The log file is compacted.
Build logs in the Build Map editor
When a DD has publishing enabled and it is using a new or existing data set definition, the PDS information is stored in the build map. This information is available on the Logs tab of the Build Map editor and, when integrated with Rational Developer for z Systems, its File Location value is a link that opens the remote member.

Source code data scanning
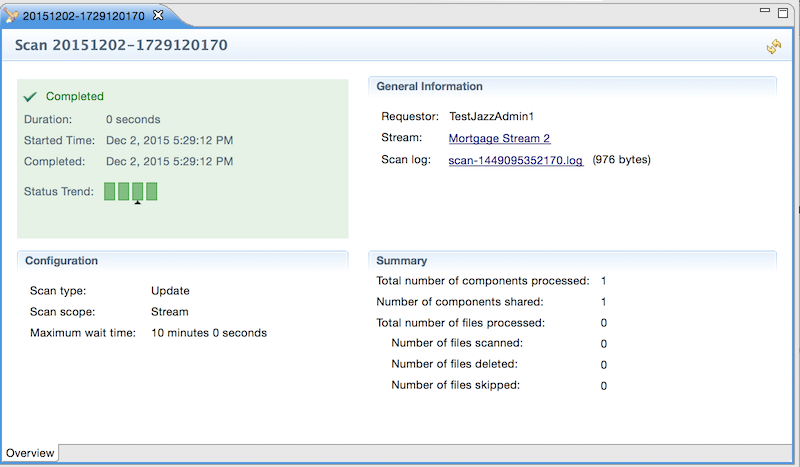
Show number of shared components in scan result
The scan result now shows the number of components shared during a Source Code Data scan.
System definitions
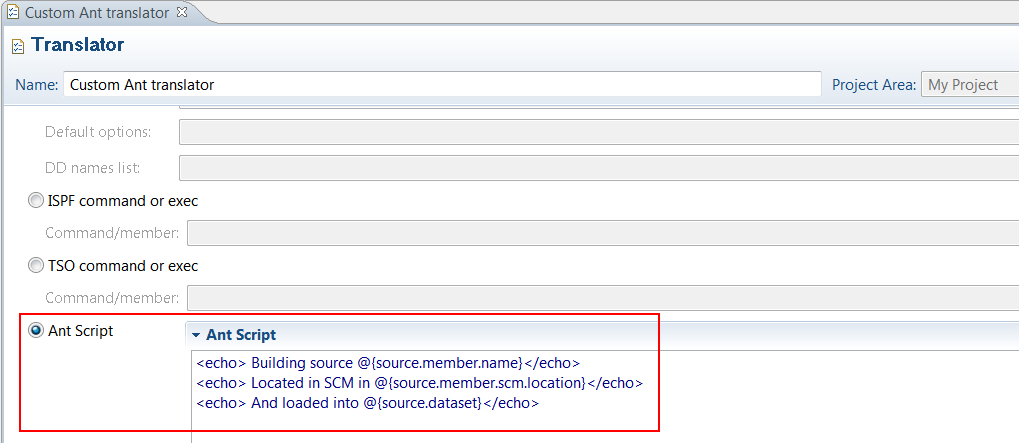
Support for custom Ant scripts in translators
You can now define translators with a new type of call method: an Ant script. You can specify Ant syntax, which will run as part of the dependency build when the translator is invoked by a language definition. As part of the dependency build, these Ant scripts have access to the build context, including variables and properties.
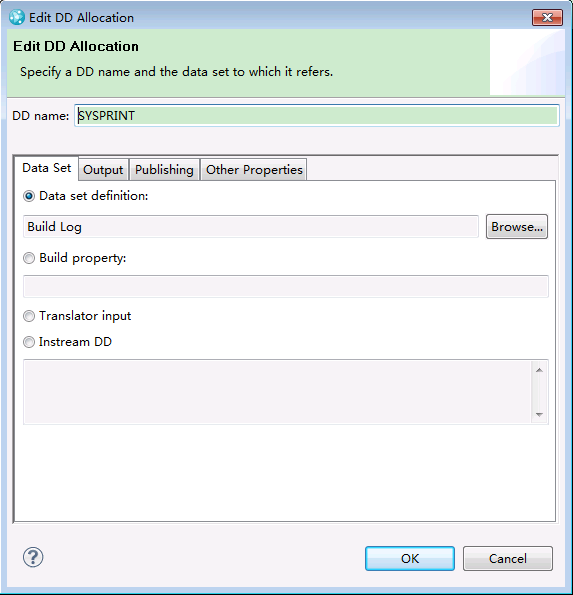
DD allocation dialog box
The DD Allocation dialog box in the translator editor is now organized into to four tabs: Data Set, Output, Publishing, and Other Properties.
Data Set Definitions now better supports system symbols
Validation in the Data Set Definition editor now allows 16-character system symbols, system symbols whose name contains an underscore or national characters, and substrings of system symbols.
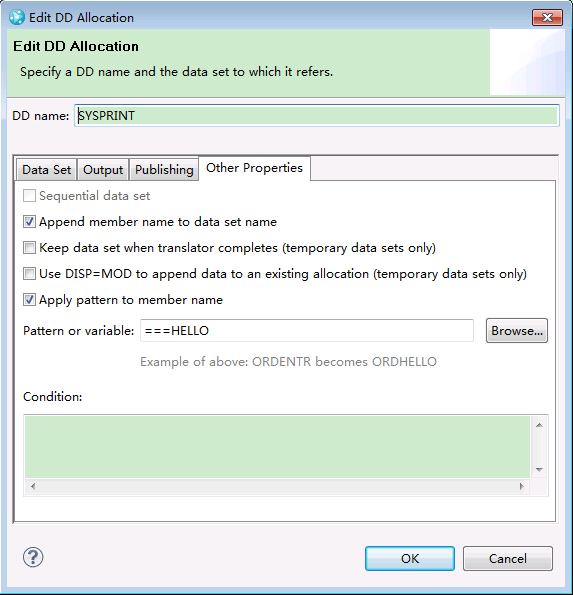
Changes to member rename
When the data set for a DD allocation is a build property or a non-temporary data set definition, the Apply pattern to member name option is enabled on the Other Properties tab.


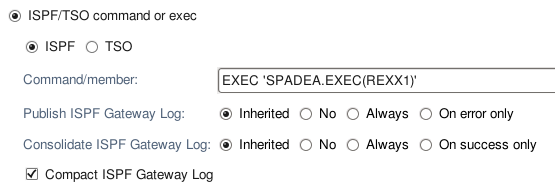
ISPF and TSO call methods
The ISPF and TSO call methods are grouped into a single option in the Translator editor. Publish, consolidation, and compacting options are available for the ISPF Gateway log file, similar to the publishing options for DDs.
ISPF client
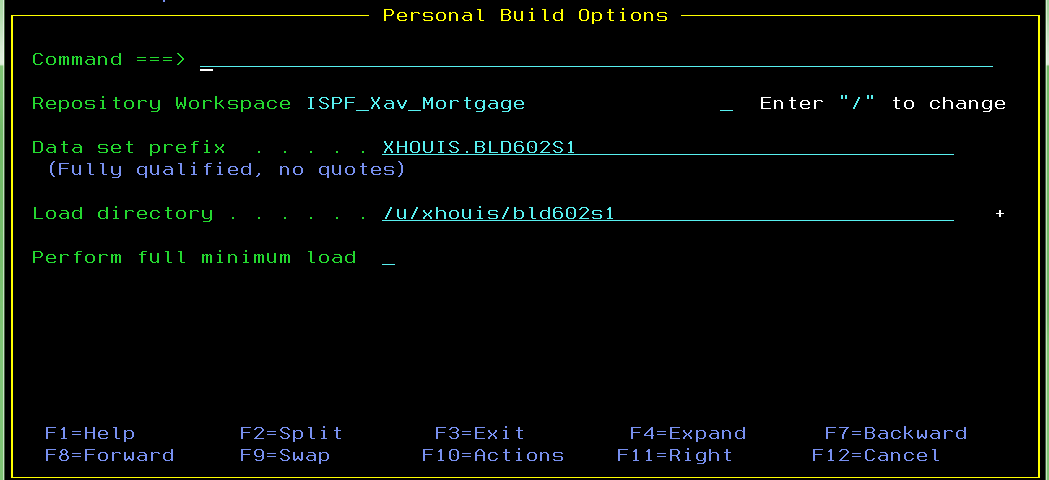
Personal build options kept for next request
The personal build options entered by the ISPF user (Repository workspace, Data set prefix, and Load directory) are kept and automatically redisplayed to the user on the next personal build request options panel.
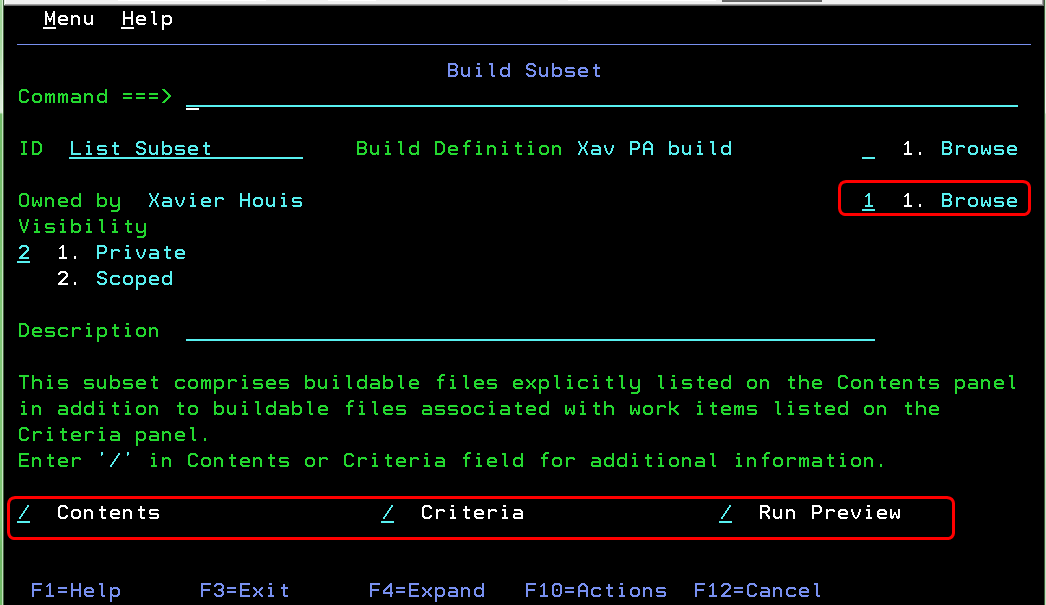
Build subset capabilities
On the Edit Build Subset panel, which displays an overview of the subset, you can now modify the subset ownership by using the Browse field. You can also add or remove contents by using the Contents field, add or remove criteria by using the Criteria field, and request a preview of the subset that displays the buildable files in the subset by using the Run Preview field.
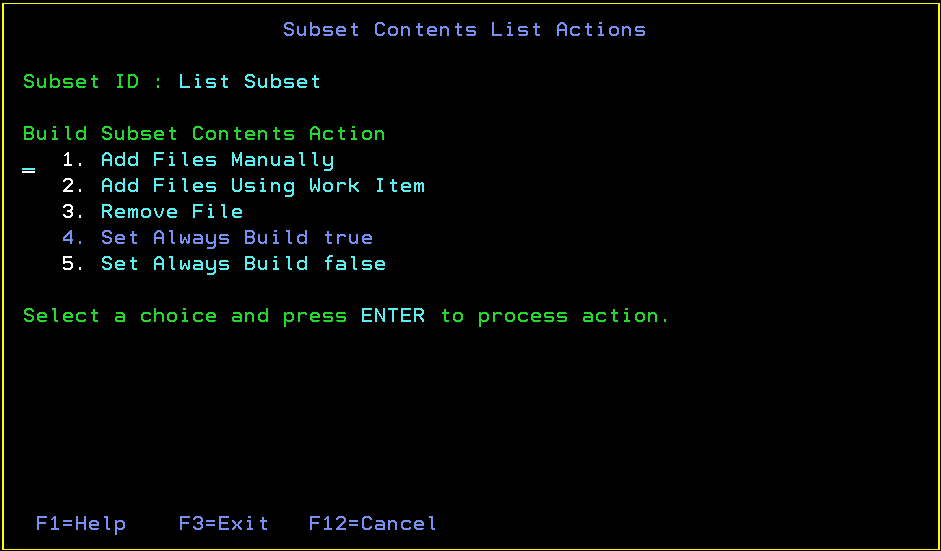
The Build Subset Contents panel displays a static list of buildable files that are rebuilt when you build the edited subset. You can add files, remove files, add files using a work item, and change the value of the Always Build field for each buildable file.

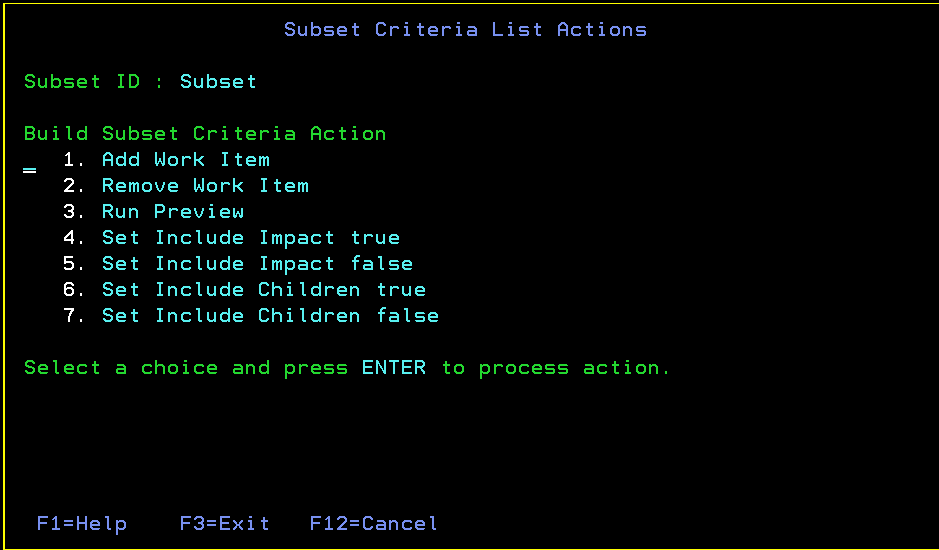
The Build Subset Criteria panel displays a list of work items containing buildable files that are rebuilt when you build the edited subset. You can add or remove work items, request a preview of a selected work item, and change the value of the Include Impact or Include Children fields for each work item criteria.

zload CLI subcommand
zload CLI subcommand loads an entire workspace or only items specified by a remote path
The zload CLI subcommand can now load either an entire workspace or a set of remote items by specifying a list of remote paths. The remote path can specify the name, alias, or UUID of a component, or a remote path within a component. To specify a remote path within a component, use the following format: <name, alias, or UUID of the component><remote path within the component>.
Load zFiles or zFolders directly to a dataset
The CLI zload subcommand can now load zFiles or zFolders specified by the remote-path option directly to a data set. The -d or --dataset option specifies the complete dataset name where the zFiles or zFolders will be loaded.
The specified dataset must exist before you run the zload subcommand.
Client for Microsoft Visual Studio IDE
Team artifacts filter
You can now filter the content of the Team Artifacts view based on the owning process areas. You can opt to see the content owned by your project or team areas, or customize the filter by selecting or unselecting some of the project or team areas. You can filter content under Source Control, Build Engines, Build Definitions, All Plans, and Team Area Shared (Queries).

Baseline history graph
You can now see a graphical diagram of the baseline histories of a component in a repository workspace or stream. This new view enables you to see how changes flow across release streams, see where baselines are used in different streams, and compare the contents of two streams or workspaces.

You can open this view by selecting a component
of a stream or workspace in the Team Artifact View.
For details, see the Baseline history graph section.
File locking
When you lock a file, the system now prompts you if there are incoming changes to that file. You can continue with the locking operation or you can cancel it and manually accept incoming changes before retrying.
Stream and component locking
You can now lock streams and components to prevent deliveries. The actions to lock and unlock streams and components are available in the Team Artifacts view of the Eclipse and Visual Studio clients. For details, see the Stream and Component Locking section.
Switching histories in the History view
In the History view, you can now switch between the workspace history and stream/component history, and you can browse recently viewed history windows.

Pinning of Search view
You can now pin the search results in the Search view. Also, the view is reused for showing newer search results if not pinned.
Locking streams and components
Streams and components can now be locked from the Team Artifacts view. When a stream or component is locked, only the user that holds the lock can deliver changes.
Lock information in the Repository Browser view
You can now see lock information in the repository browser view. You can also lock or unlock a file from the same view.

Component hierarchies in the Pending Changes view
Component hierarchies are now shown in the Pending Changes view as well as the Team Artifacts view. The following image shows the Pending Changes view for a workspace with a component hierarchy.

You can set a preference to control whether the Pending Changes view shows components in a hierarchy or a flat list. The following image shows the preference in the Visual Studio client.

The preference is also available in the shell, as shown in the following image.

Workspace load
In the Load wizard, you can now select and define subfolders in the sandbox during load operations. With this feature, you can load multiple workspaces with common components into the same sandbox.

Rational Team Concert shell
Switching history in the History view
In the History view, you can now switch between the workspace history and stream/component history, and you can browse recently viewed history windows.
Locking streams and components
You can now lock streams and components from the Team Artifacts view. When a stream or component is locked, only the user that holds the lock can deliver changes.
Component hierarchies in the Pending Changes view
Component hierarchies are now shown in the Pending Changes view. You can set a preference in the Other Preference section of the control panel to control whether the Pending Changes view shows components in a hierarchy or a flat list.