Introduction
In the IBM Engineering Lifecycle Management (ELM) 7.0 release, an IBM Engineering Systems Design Rhapsody Model Manager (RMM) server is deployed as an extension to IBM Engineering Workflow Management (EWM). The purpose of this document is to show the performance impact of combining the two servers.
Summary of results
- Given what we tested, the added RMM load cost an additional ~5% CPU on the combined server with very little impact to EWM service times. Database disk utilization increased by ~2%.
Disclaimer
The information in this document is distributed AS IS. The use of this information or the implementation of any of these techniques is a customer responsibility and depends on the customers ability to evaluate and integrate them into the customers operational environment. While each item may have been reviewed by IBM for accuracy in a specific situation, there is no guarantee that the same or similar results will be obtained elsewhere. Customers attempting to adapt these techniques to their own environments do so at their own risk. Any pointers in this publication to external Web sites are provided for convenience only and do not in any manner serve as an endorsement of these Web sites. Any performance data contained in this document was determined in a controlled environment, and therefore, the results that may be obtained in other operating environments may vary significantly. Users of this document should verify the applicable data for their specific environment.
Performance is based on measurements and projections using standard IBM benchmarks in a controlled environment. The actual throughput or performance that any user will experience will vary depending upon many factors, including considerations such as the amount of multi-programming in the users job stream, the I/O configuration, the storage configuration, and the workload processed. Therefore, no assurance can be given that an individual user will achieve results similar to those stated here.
This testing was done as a way to compare and characterize the differences in performance between different versions of the product. The results shown here should thus be looked at as a comparison of the contrasting performance between different versions, and not as an absolute benchmark of performance.
Topology
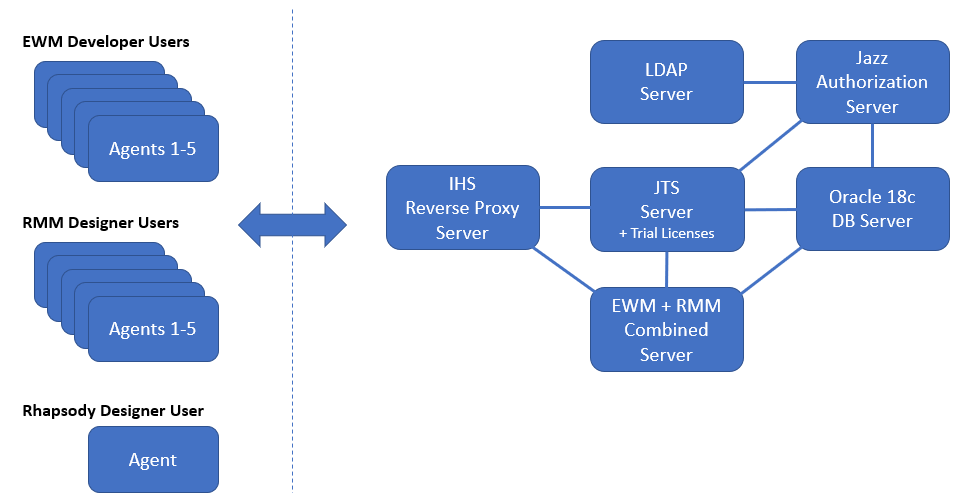
The topology we used in our performance testing is shown below.
Machine Details
| Function |
Machine Count |
Machine Type |
CPU / Machine |
Total # of CPU vCores/Machine |
Memory/Machine |
Disk |
Disk capacity |
Network interface |
OS and Version |
| Oracle DB Server |
1 |
Physical |
|
40 |
64G RAM |
|
|
Gigabit Ethernet |
Red Hat Enterprise Linux Server 7.6 |
| EWM + RMM Combined Server |
1 |
Physical |
|
24 |
32G RAM
8G Heap |
|
|
Gigabit Ethernet |
Red Hat Enterprise Linux Server 6.10 |
| JTS Server |
1 |
VMware VM |
2 x Intel Xeon E5-2665 2.4GHz (dual-core) |
4 |
16G RAM
8G Heap |
N/A |
|
Gigabit Ethernet |
Red Hat Enterprise Linux Server 7.1 |
| Jazz Authoriztion Server |
1 |
VMware VM |
2 x Intel Xeon E5-2665 2.4GHz (dual-core) |
4 |
16G |
|
|
Gigabit Ethernet |
Red Hat Enterprise Linux Server 7.1 |
| LDAP Server |
1 |
VMware VM |
N/A |
N/A |
N/A |
N/A |
N/A |
Gigabit Ethernet |
N/A |
| IHS Server |
1 |
VMware VM |
2 x Intel Xeon E5-2698 2.3GHz |
4 |
16G |
N/A |
|
Gigabit Ethernet |
Red Hat Enterprise Linux Server 7.6 |
| EWM Developer Agents |
5 |
VMware VM |
2 x Intel Xeon E5-2698 2.3GHz (dual-core) |
4 |
16G |
N/A |
|
Gigabit Ethernet |
Red Hat Enterprise Linux Server 7.1 |
| RMM Designer Agents |
5 |
VMware VM |
2 x Intel Xeon E5-2698 2.3GHz (dual-core) |
4 |
16G |
N/A |
|
Gigabit Ethernet |
Windows Server Enterprise 2016 |
| Rhapsody Designer Agents |
1 |
VMware VM |
2 x Intel Xeon E5-2698 2.3GHz (dual-core) |
4 |
16G |
N/A |
|
Gigabit Ethernet |
Windows Server Enterprise 2016 |
N/A: Not applicable.
Network connectivity
All server machines and test clients are located on the same subnet. The LAN has 1000 Mbps of maximum bandwidth and less than 0.3 ms latency in ping.
Test methodology
The test methodology involved resetting the environment prior to each test, running tests for a duration that allotted time for 500 users to ramp up, settle in, work at a steady pace, and ramp down. Performance data was collected during a steady state period of one hour. The tests were repeated and results were compared. Note: there is an acceptable degree of variation in the EWM web service times. So to avoid false alarms when comparing results, response times for each service were rounded up by 50ms.
Test automation and workload characterization
Automation
Internal tooling which consisted of java API implementations that work with RMM-enabled models and that perform various EWM operations was used to generate the full test load.
The java implementations were made available via a combination of executable jar files and as custom code executed via Rational Performance Tester (RPT). The number of threads and frequency at which operations were invoked by each thread were controlled via configuration files.
EWM Workload
500 users execute the following actions with 1 minute think time between operations for each user.
| Task |
Description |
% of Workload |
| Accept |
Accepts incoming changes. |
21.5% |
| Baseline |
Creates a baseline. |
2.0% |
| Checkin |
Checks in a file. |
41.3% |
| CloneWorkspace |
Clones a workspace. |
0.2% |
| CloseChangeSets |
Completes a changeset. |
3.5% |
| CompareStreamWorkspace |
Compares repository workspace against current stream. |
4.5% |
| CompareWorkspaceBaseline |
Compare baselines against workspace. |
1.8% |
| Deliver |
Delivers a change set. |
6.3% |
| Discard |
Discards a change set. |
1.8% |
| History |
Gets history on a single file. |
4.6% |
| Load |
Loads "Stable" component, an unchanging component of 78 folders / 652 files (~12 MB on disk). |
1.2% |
| RefreshPendingChanges |
Refresh pending changes for workspace. |
8.4% |
| Suspend |
Suspends and resumes a change set. |
2.9% |
| Unload |
Unloads "Stable" component. |
0.1% |
RMM Workload
| Test name |
Description |
% of Workload |
# of Users |
# of Hits per hour |
Each # per min |
| Diagrams : Get hotspots |
Return 20 hotspots of 1 diagram. |
1.71% |
50 |
30 |
2.00 |
| Diagrams : Get image |
Return image of 1 diagram. |
1.71% |
50 |
30 |
2.00 |
| Diagrams : Get info |
Return info of 1 diagram. |
1.71% |
50 |
30 |
2.00 |
| Diagrams : Get need update |
Request for 2 diagrams. |
0.23% |
50 |
4 |
15.00 |
| Diagrams : Publish all |
Publish 100 diagrams; 20/100 changed. |
0.01% |
10 |
1 |
60.00 |
| Diagrams : Publish need update |
Publish 2 diagrams. |
0.23% |
50 |
4 |
15.00 |
| Explorer : Expand a node |
Query children of a node (avg 145). |
16.42% |
80 |
180 |
0.33 |
| Explorer : Get breadcrumbs |
Query breadcrumbs (avg depth 3). |
20.52% |
100 |
180 |
0.33 |
| Explorer : Get top nodes |
Returns 25 top nodes. |
20.52% |
100 |
180 |
0.33 |
| Explorer : Get top nodes in component |
Returns 1 top project. |
16.42% |
80 |
180 |
0.33 |
| Form : Open artifacts form |
Open artifacts form. |
20.52% |
100 |
180 |
0.33 |
Rhapsody Workload
| Test Name |
Description |
Frequency |
| EWM-RMM-Scenario1 |
Logs into repository, creates an EWM workspace, loads EWM workspace, creates Rhapsody application instance, and loops through all sample models where each model created will be checked in then delivered. |
Initiate 1 deliver per minute to simulate a total of 500 users issuing a deliver within an 8-hour work day. |
Data volume and shape
The following table outlines the volume and shape of the test data at the start of each test.
|
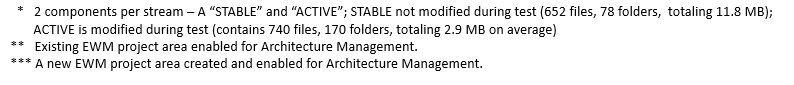
EWM** |
RMM*** |
|
|
| Project Areas |
1 |
1 |
|
|
| Work items |
770 |
- |
|
|
| Streams |
100 |
1 |
|
|
| Workspaces |
|
800 |
|
|
| Components |
200* |
800 |
|
|
| Folders |
24,800* |
- |
|
|
| Files |
139,200* |
546,400 versions |
273,200 unique |
2 avg versions/file |
| Model Elements |
- |
8,838,400 versions |
4,419,200 unique |
2 avg versions/file |
| Links (local) |
- |
- |
- |
- |
| Diagrams |
- |
80,800 versions |
40,400 unique |
2 avg versions/file |
Source content size (on disk) |
1,476 MB |
- |
- |
- |
Performance results
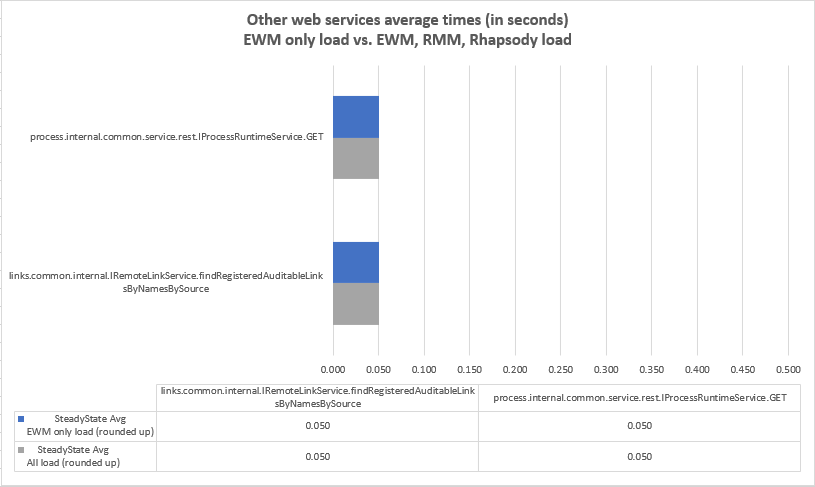
Response times
Average service times were comparable when comparing performance during an EWM only workload versus a full workload consisting of EWM, RMM, and Rhapsody.


Resource utilization
The following charts highlights the system resource utilization during an EWM only workload, RMM only workload, and a full workload consisting of EWM, RMM, and Rhapsody. Here we can see the additional resource costs when combining RMM and Rhapsody with EWM.
OS Resource Utilization - Overview
| CPU |
 |
| Disk |
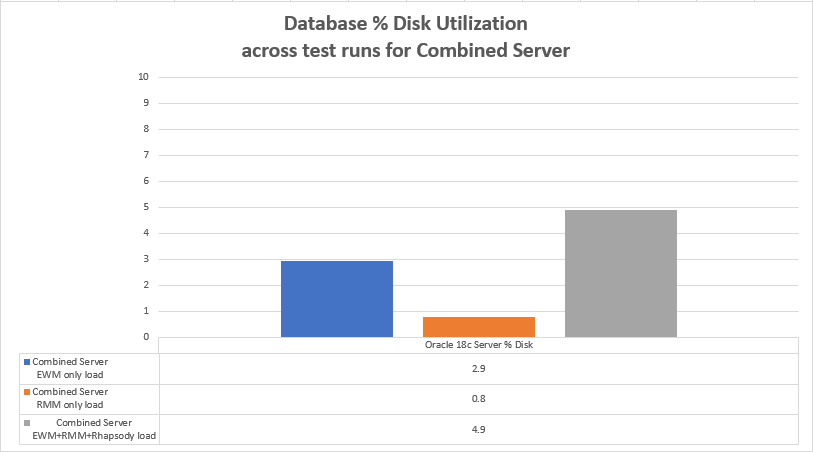 |
Garbage collection
No operations were impacted by garbage collection pauses. The average pause time was less than 1 second.
About the author(s):
SentellaCystrunk is a performance engineer focusing on the performance and scalability of products in the Engineering Lifecycle Management family.
Questions and comments:
- What other performance information would you like to see here?
- Do you have performance scenarios to share?
- Do you have scenarios that are not addressed in documentation?
- Where are you having problems in performance?
Warning: Can't find topic Deployment.PerformanceDatasheetReaderComments