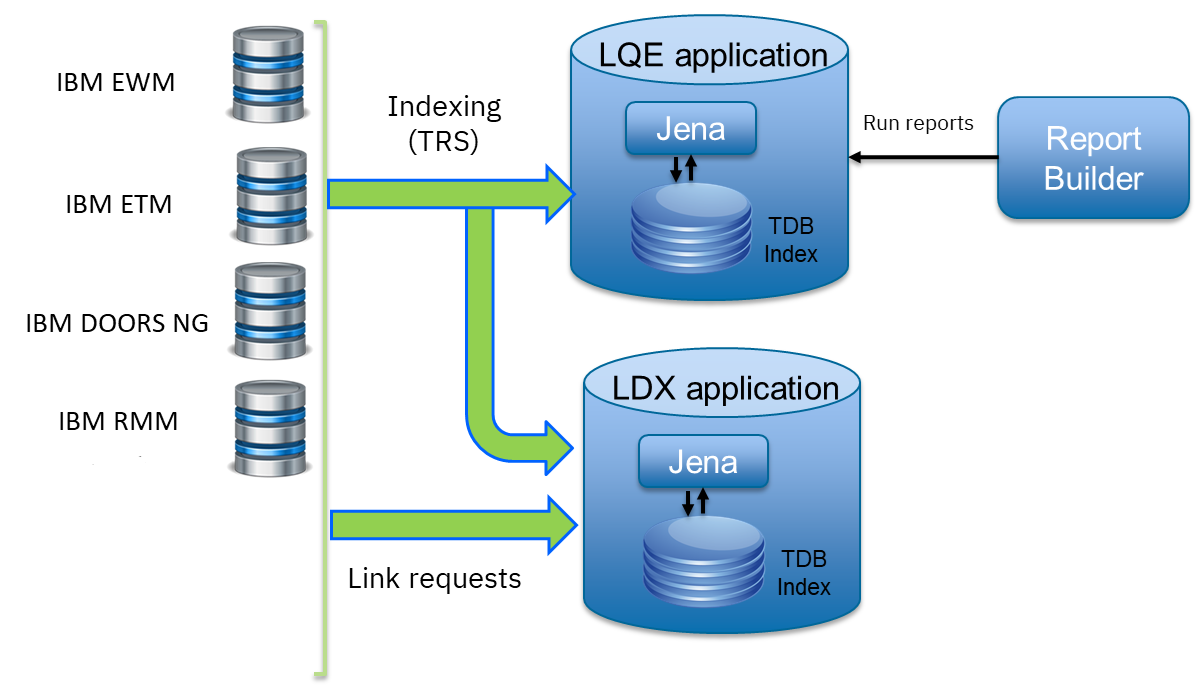
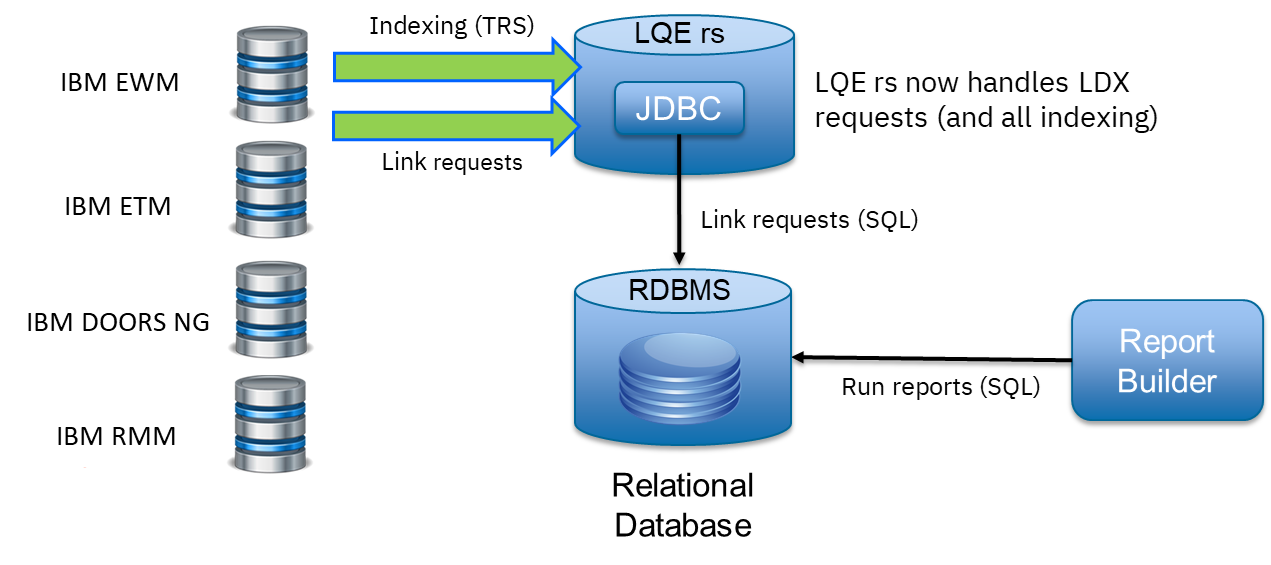
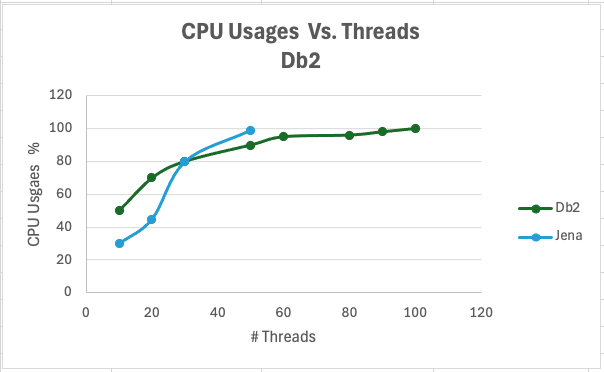
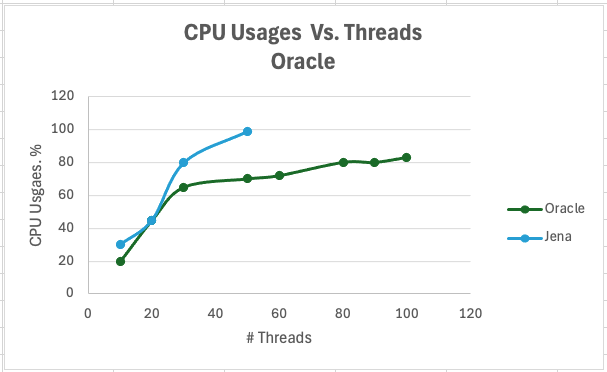
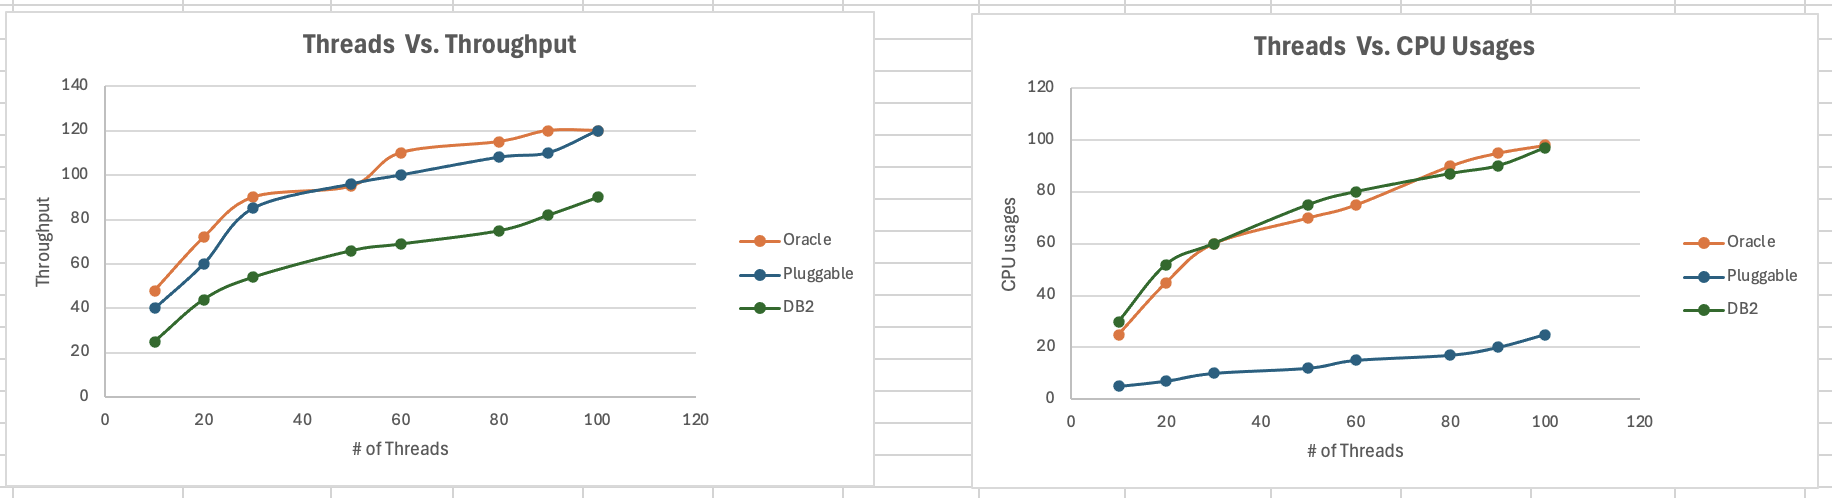
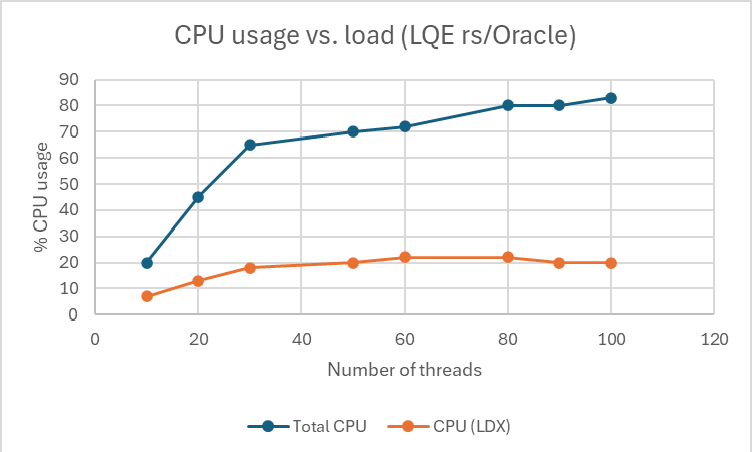
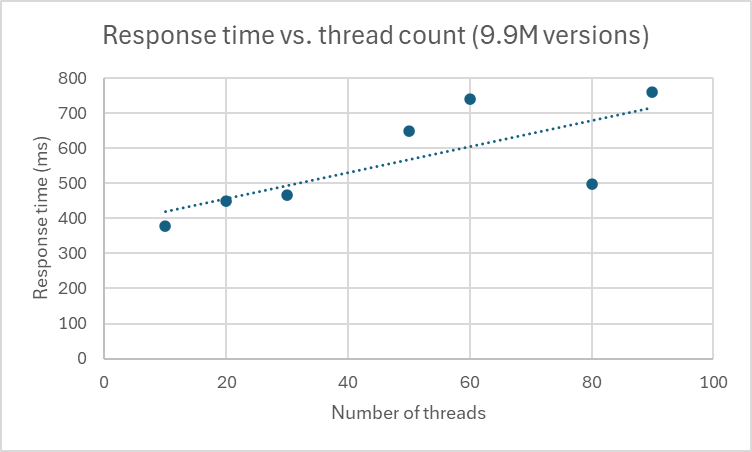
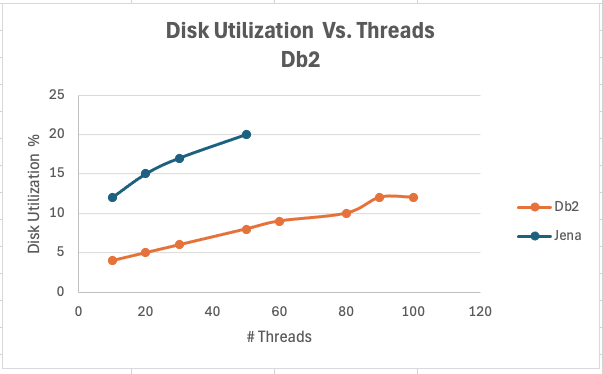
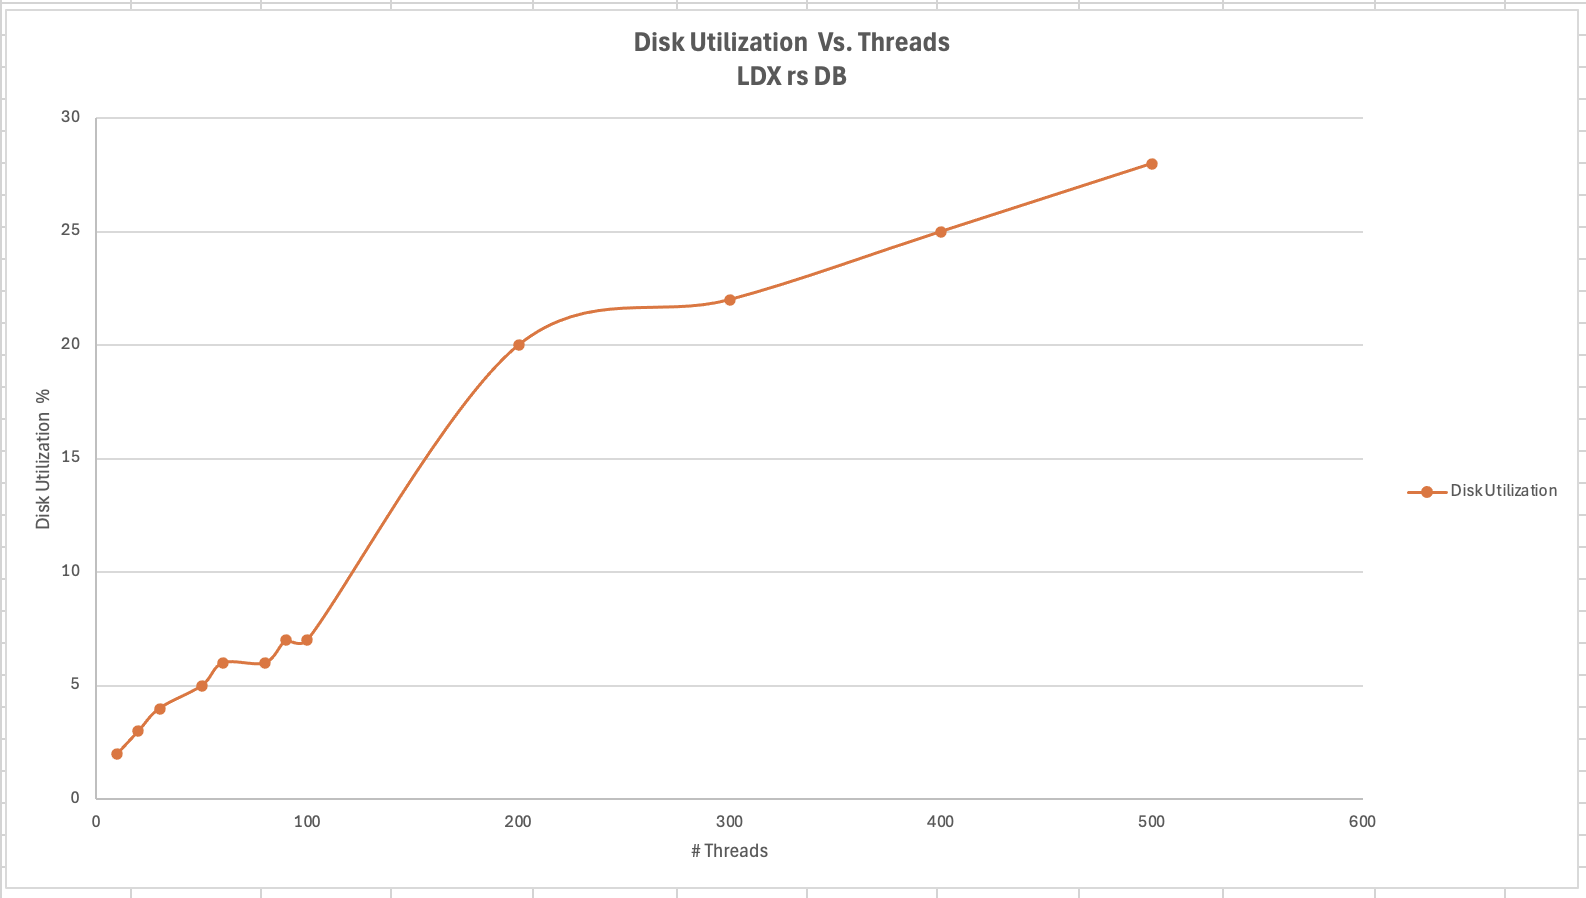
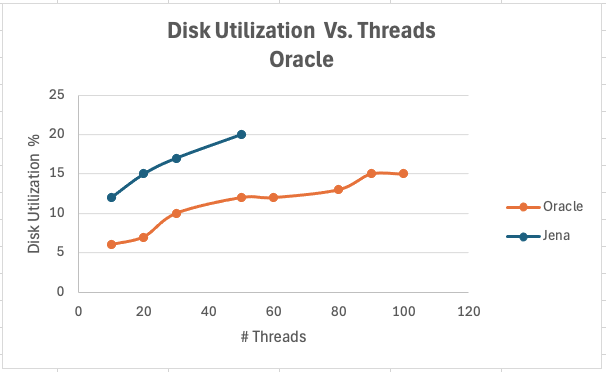
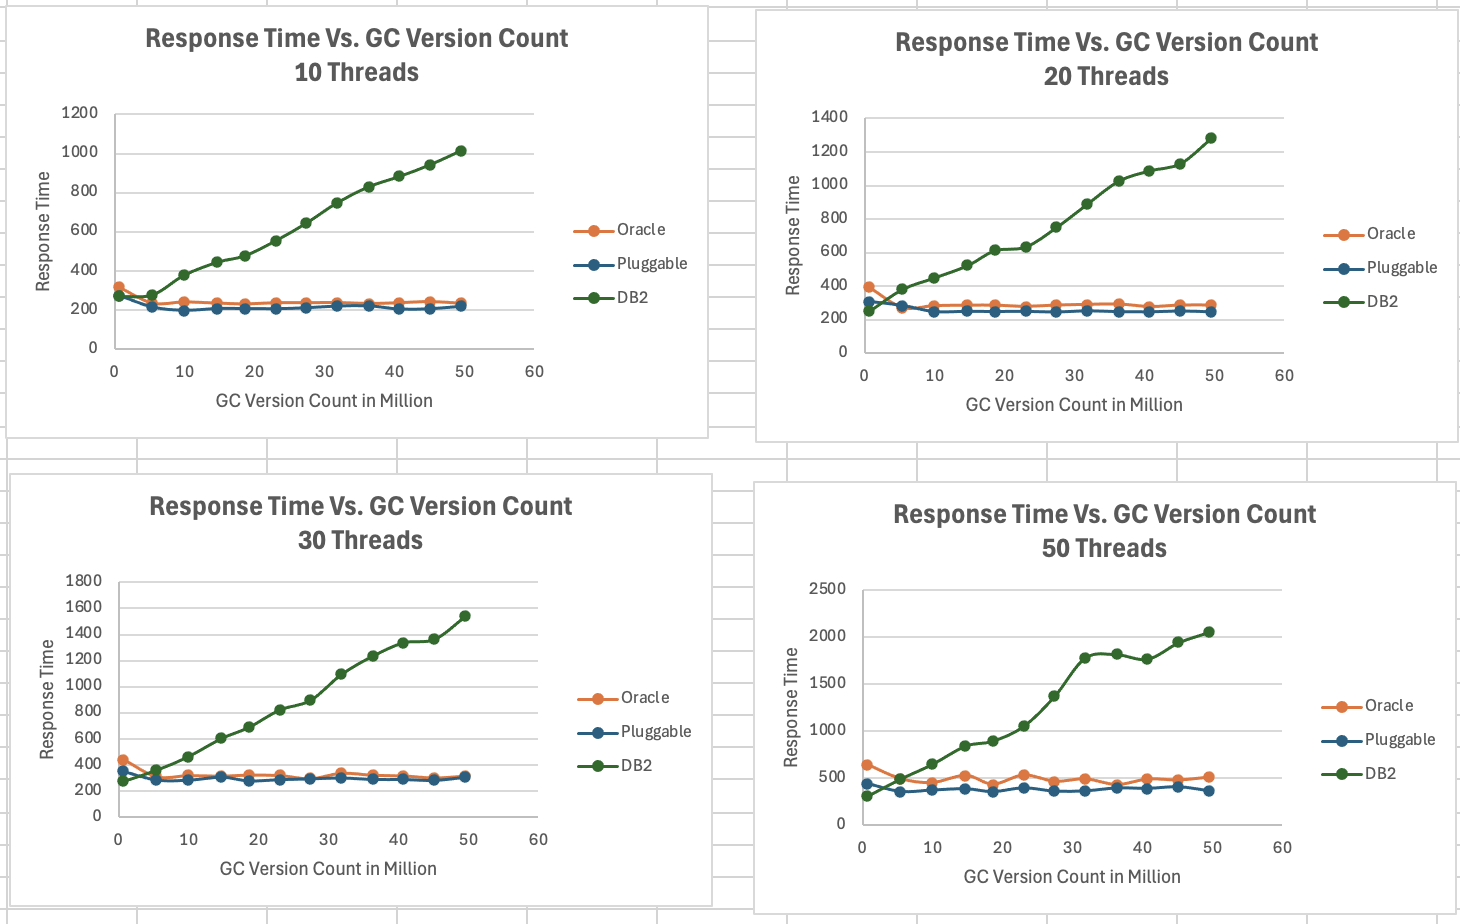
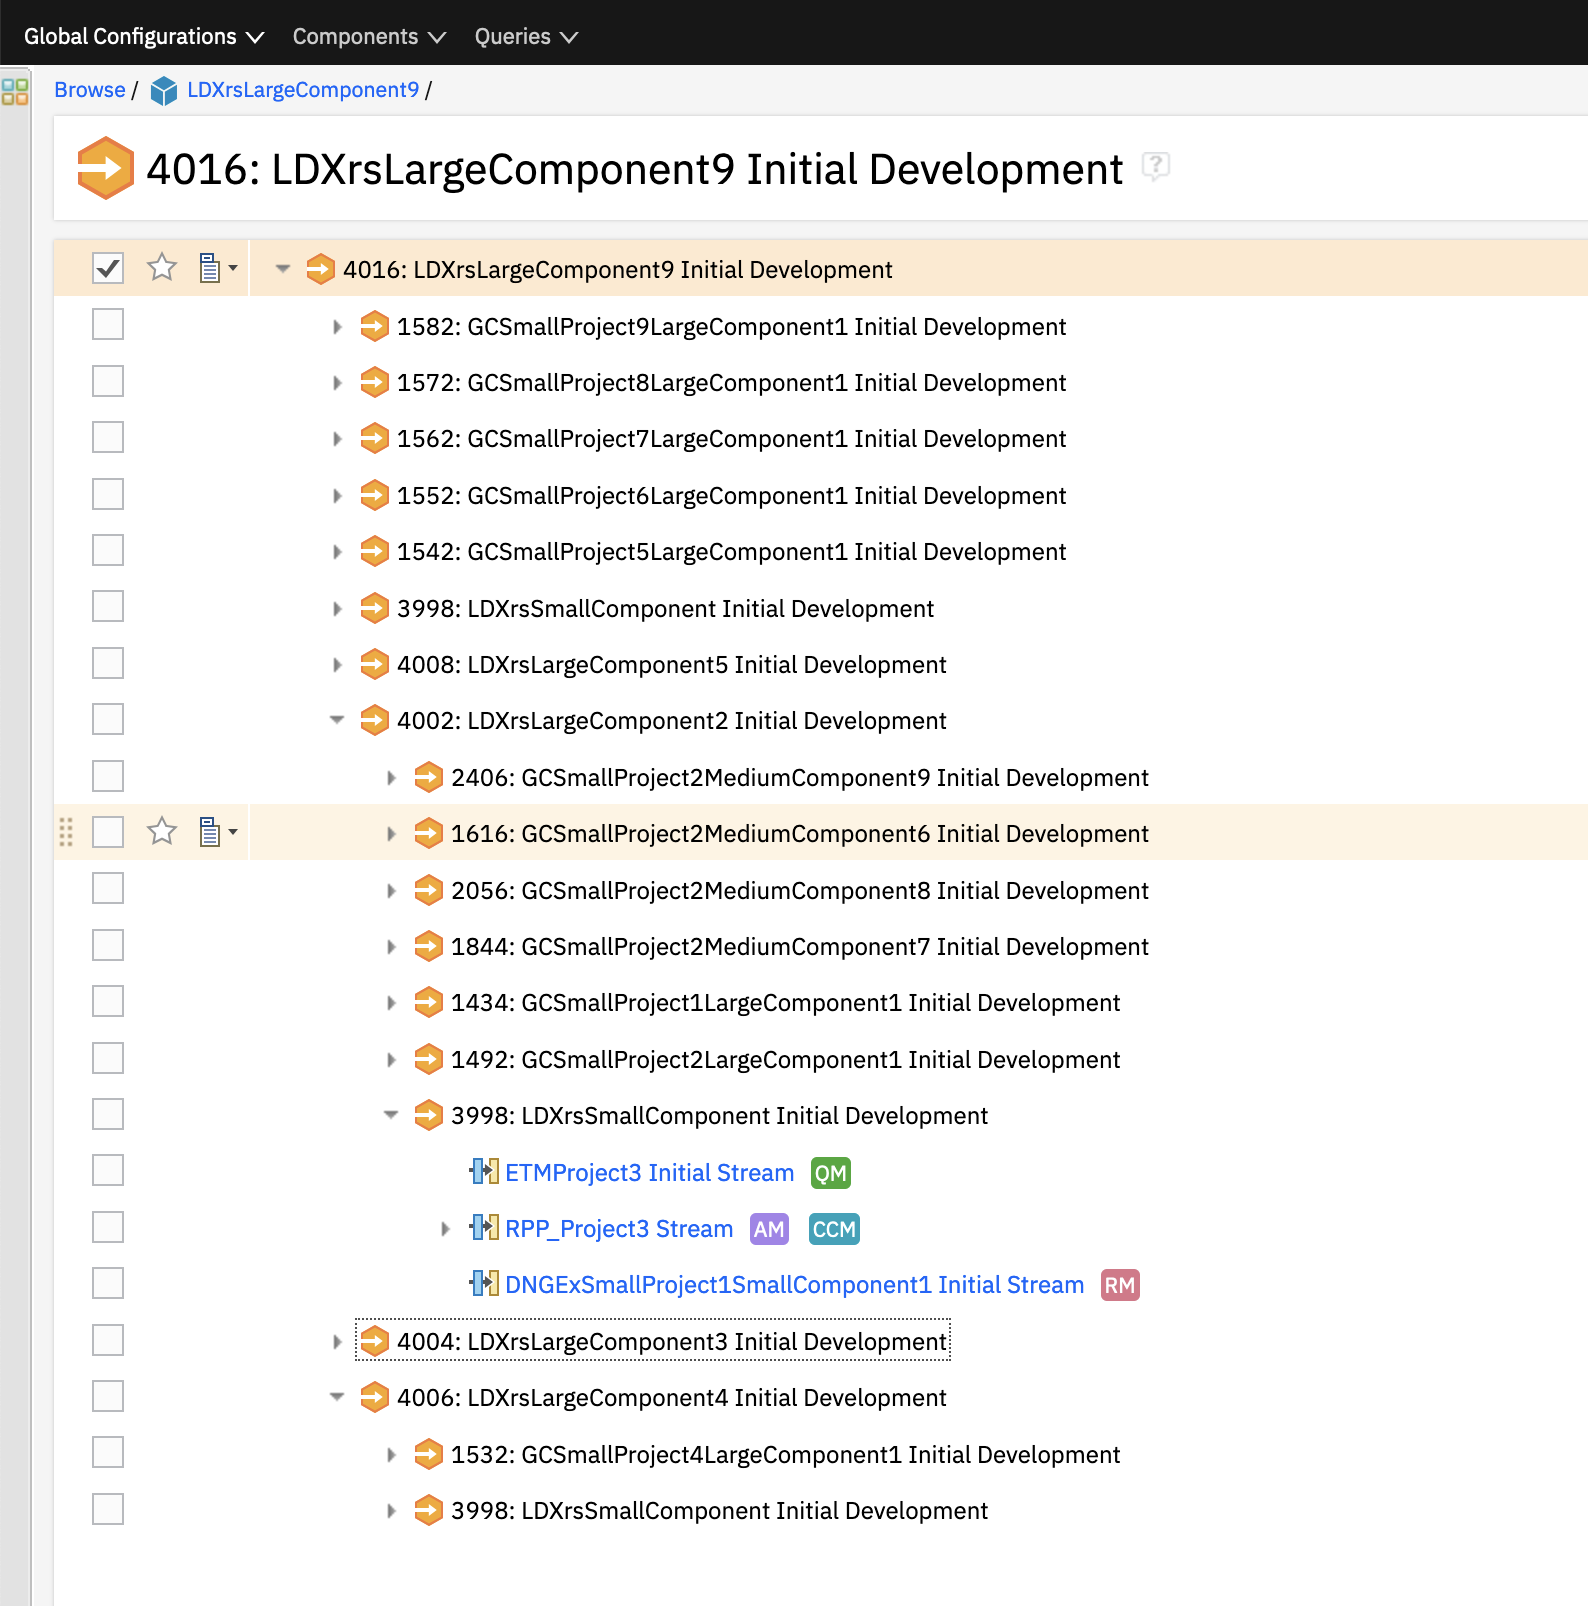
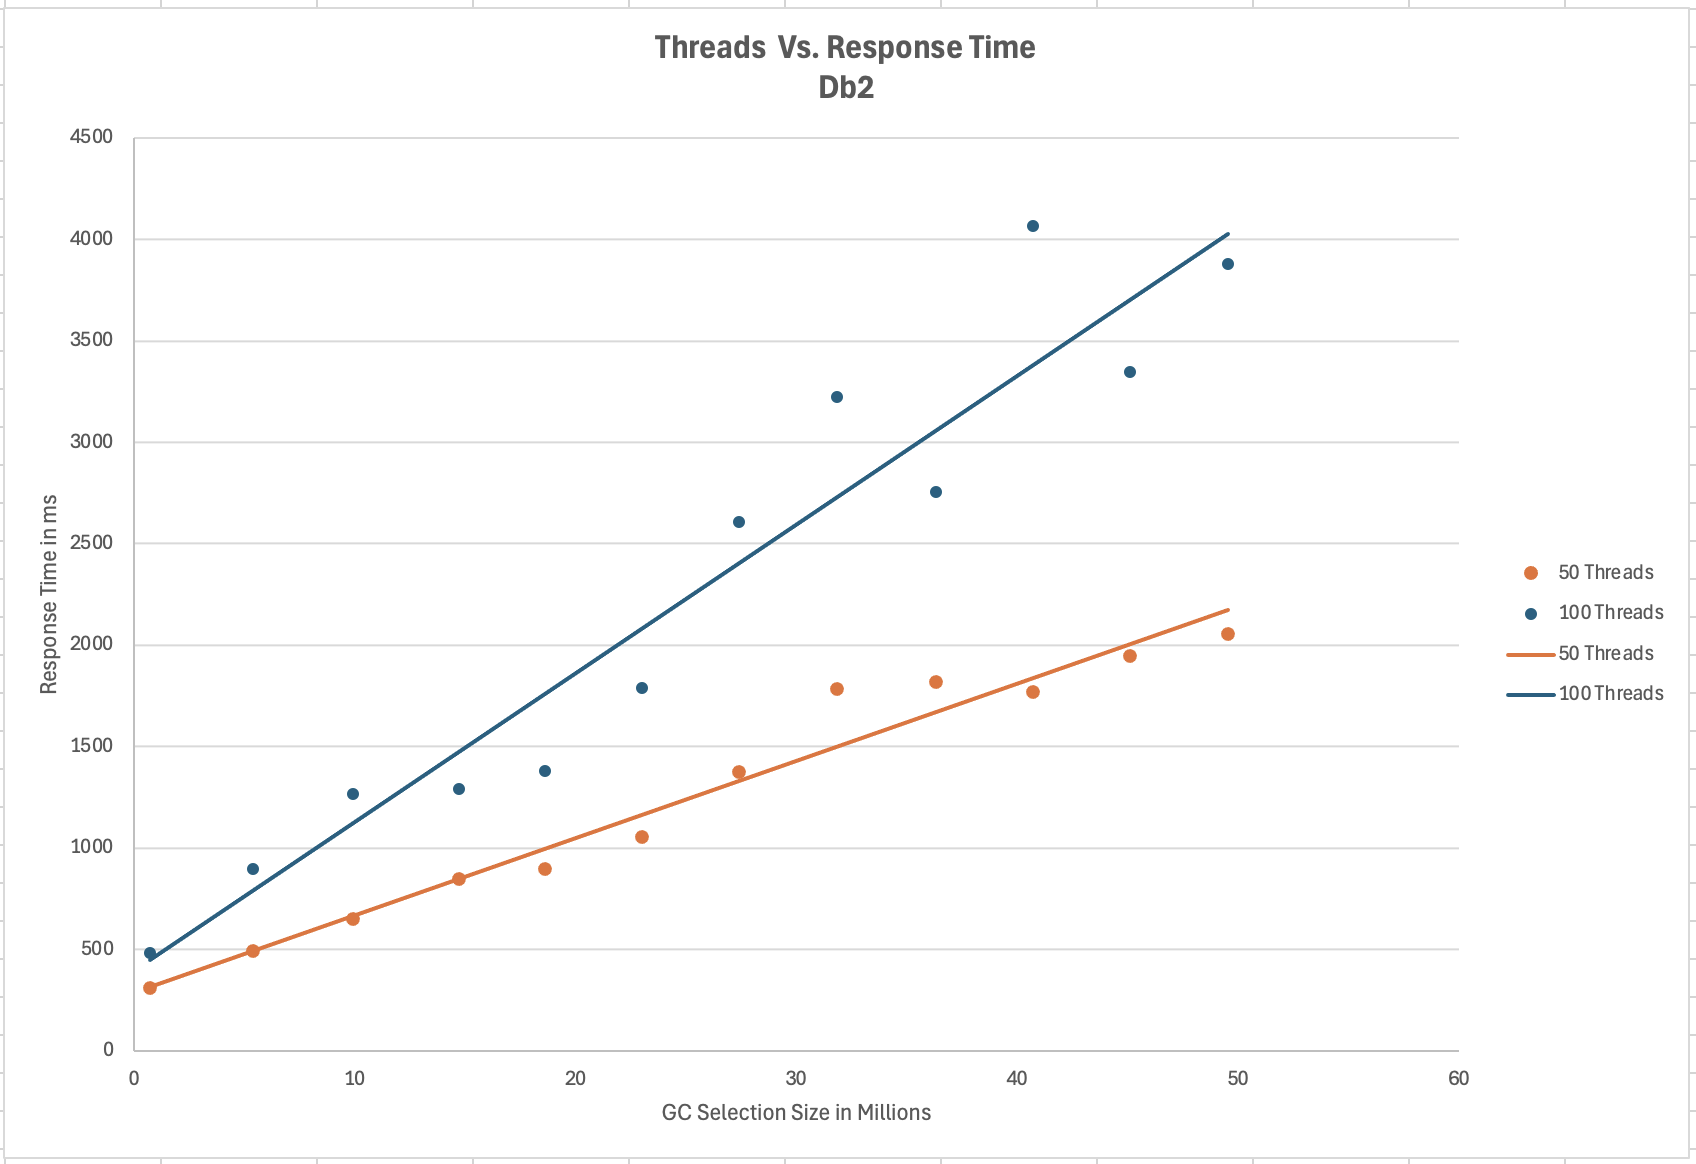
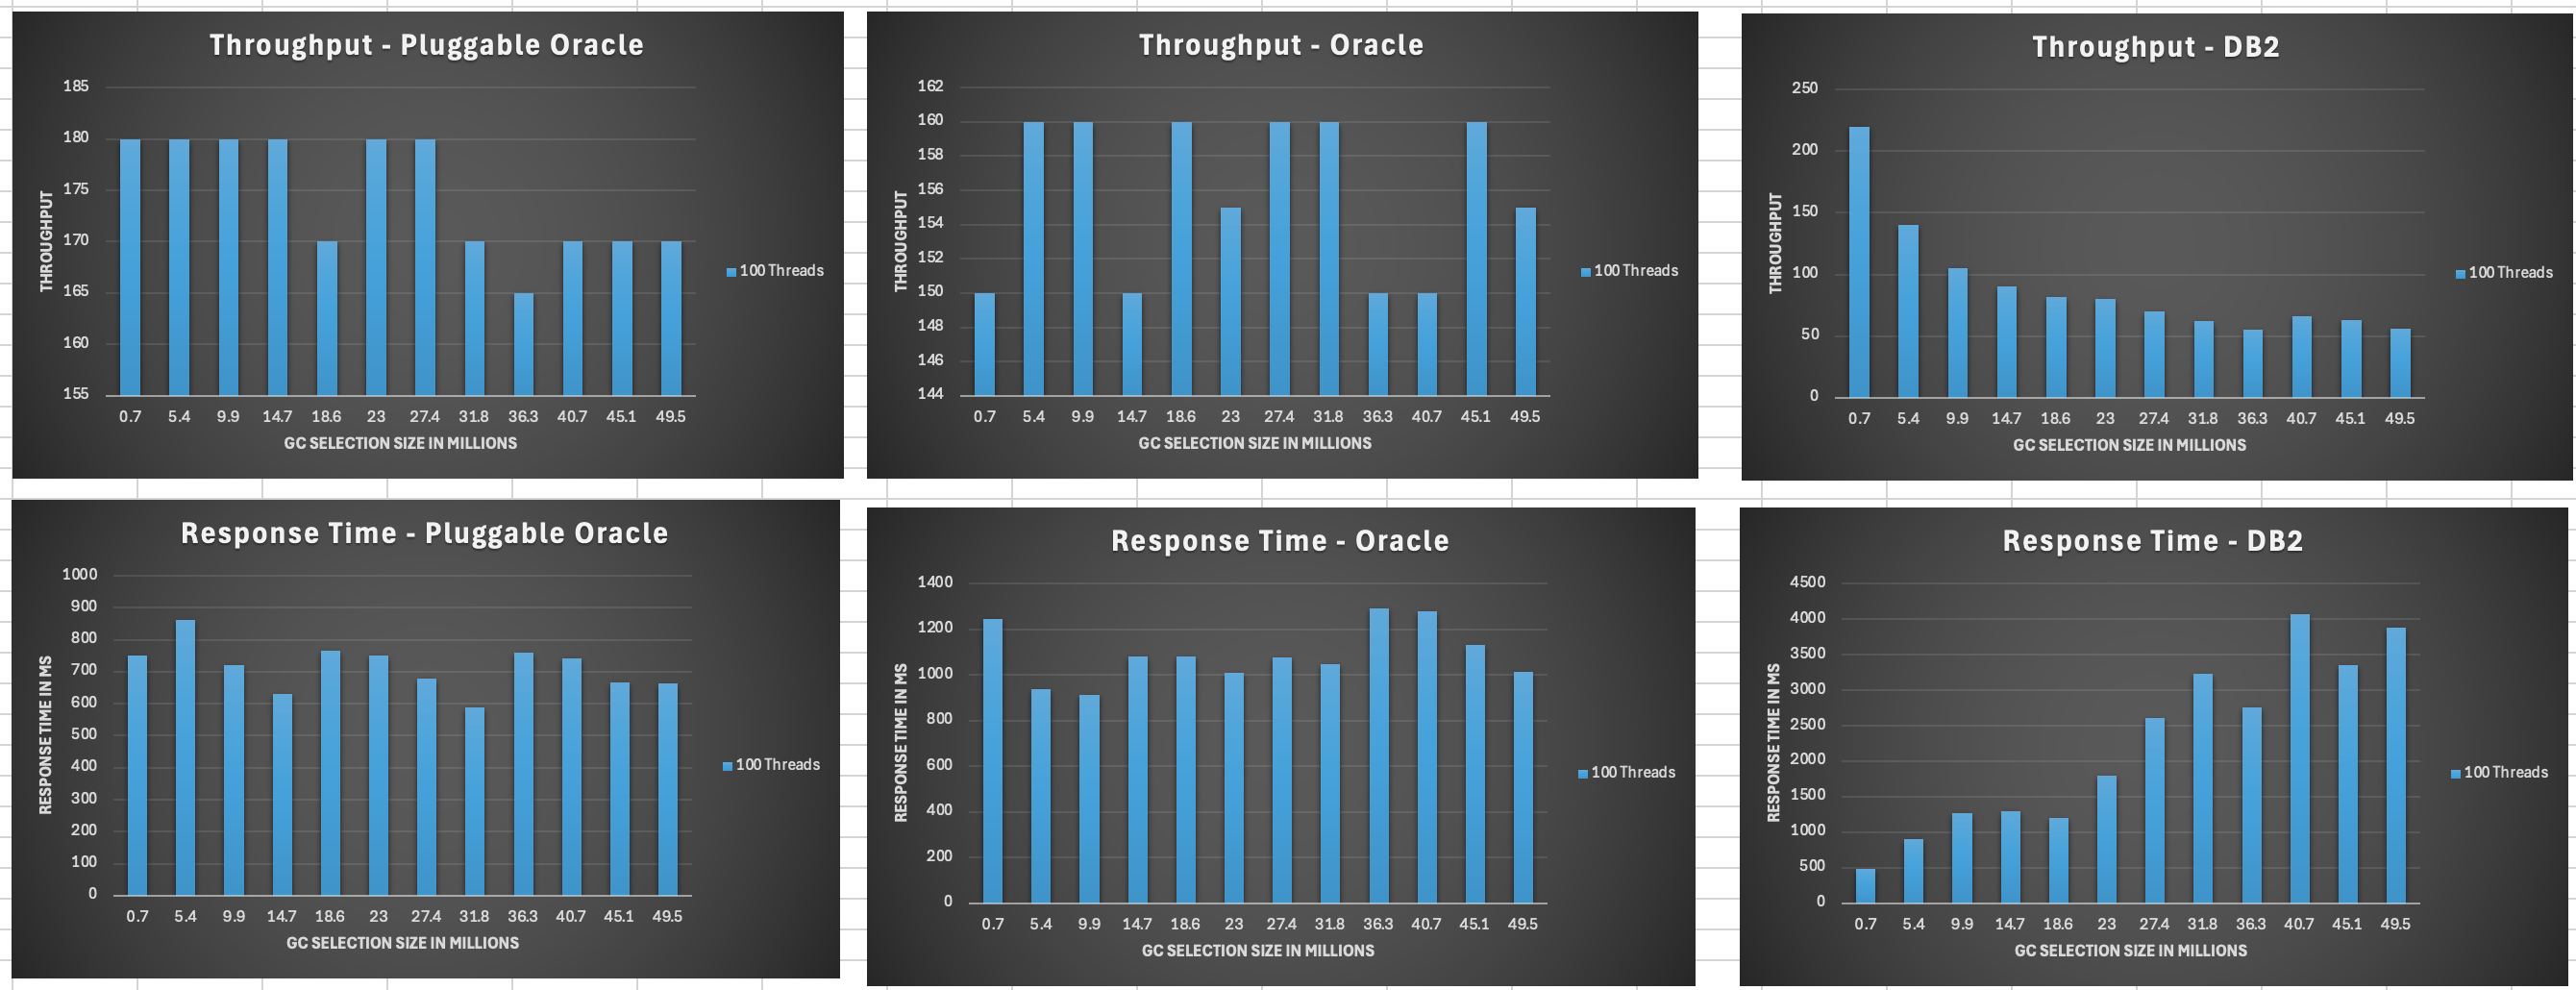
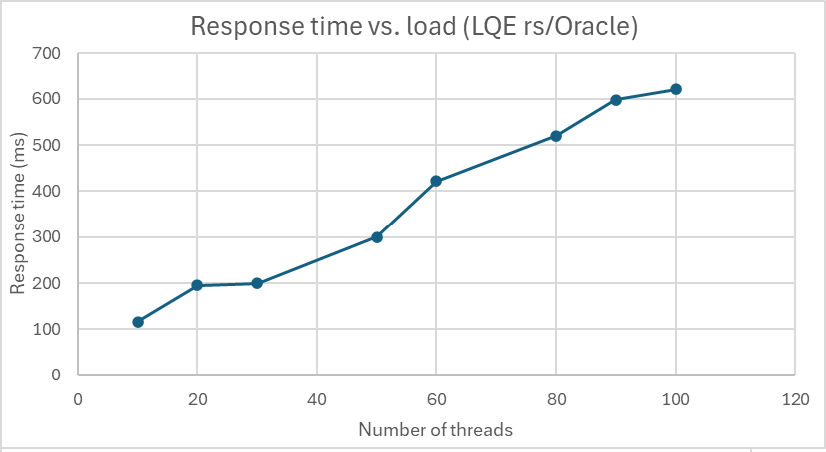
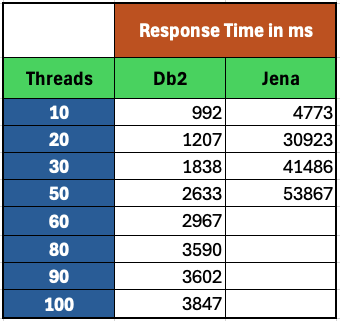
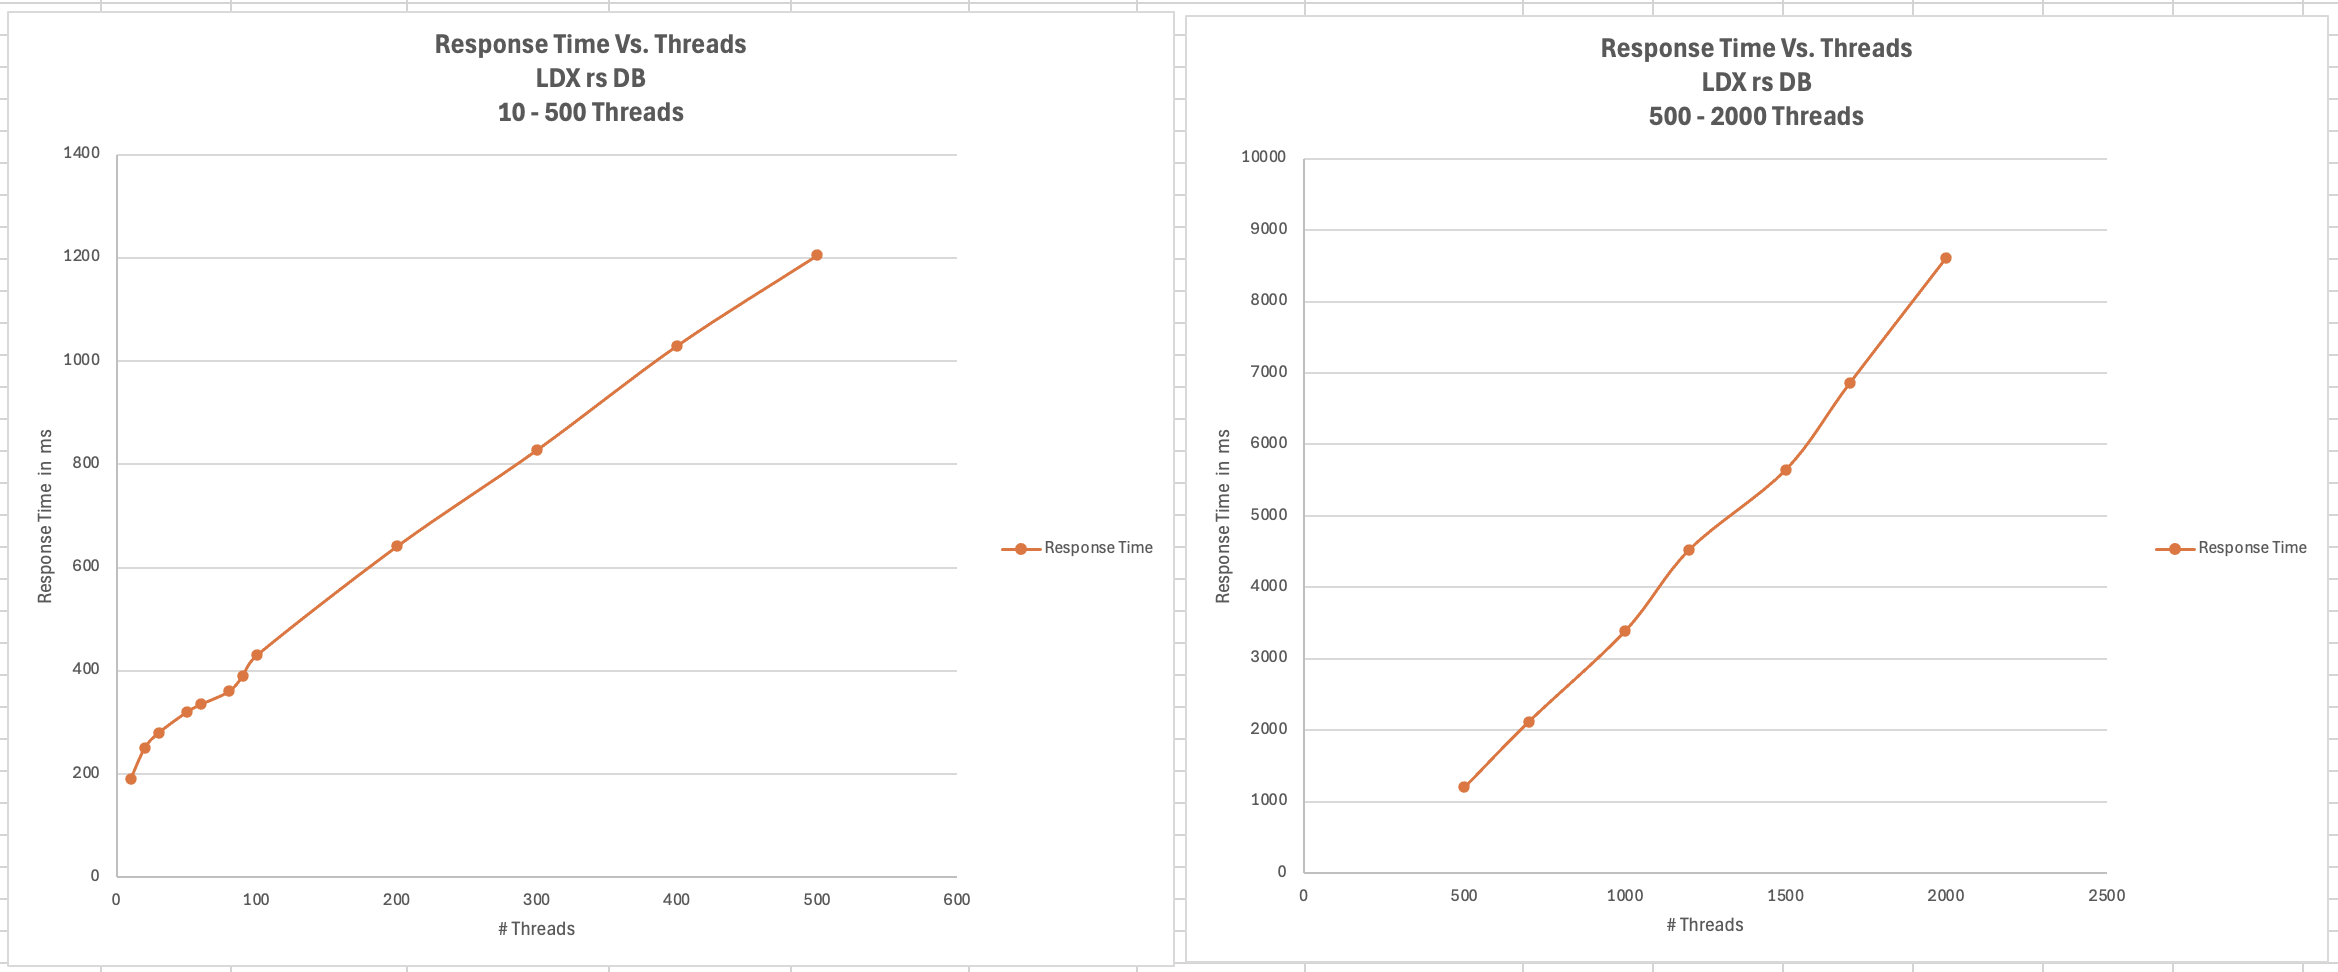
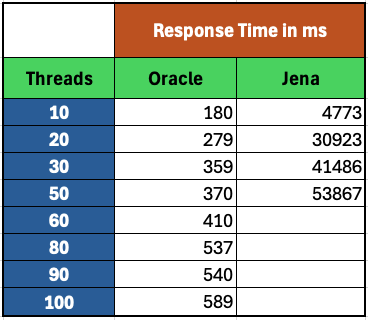
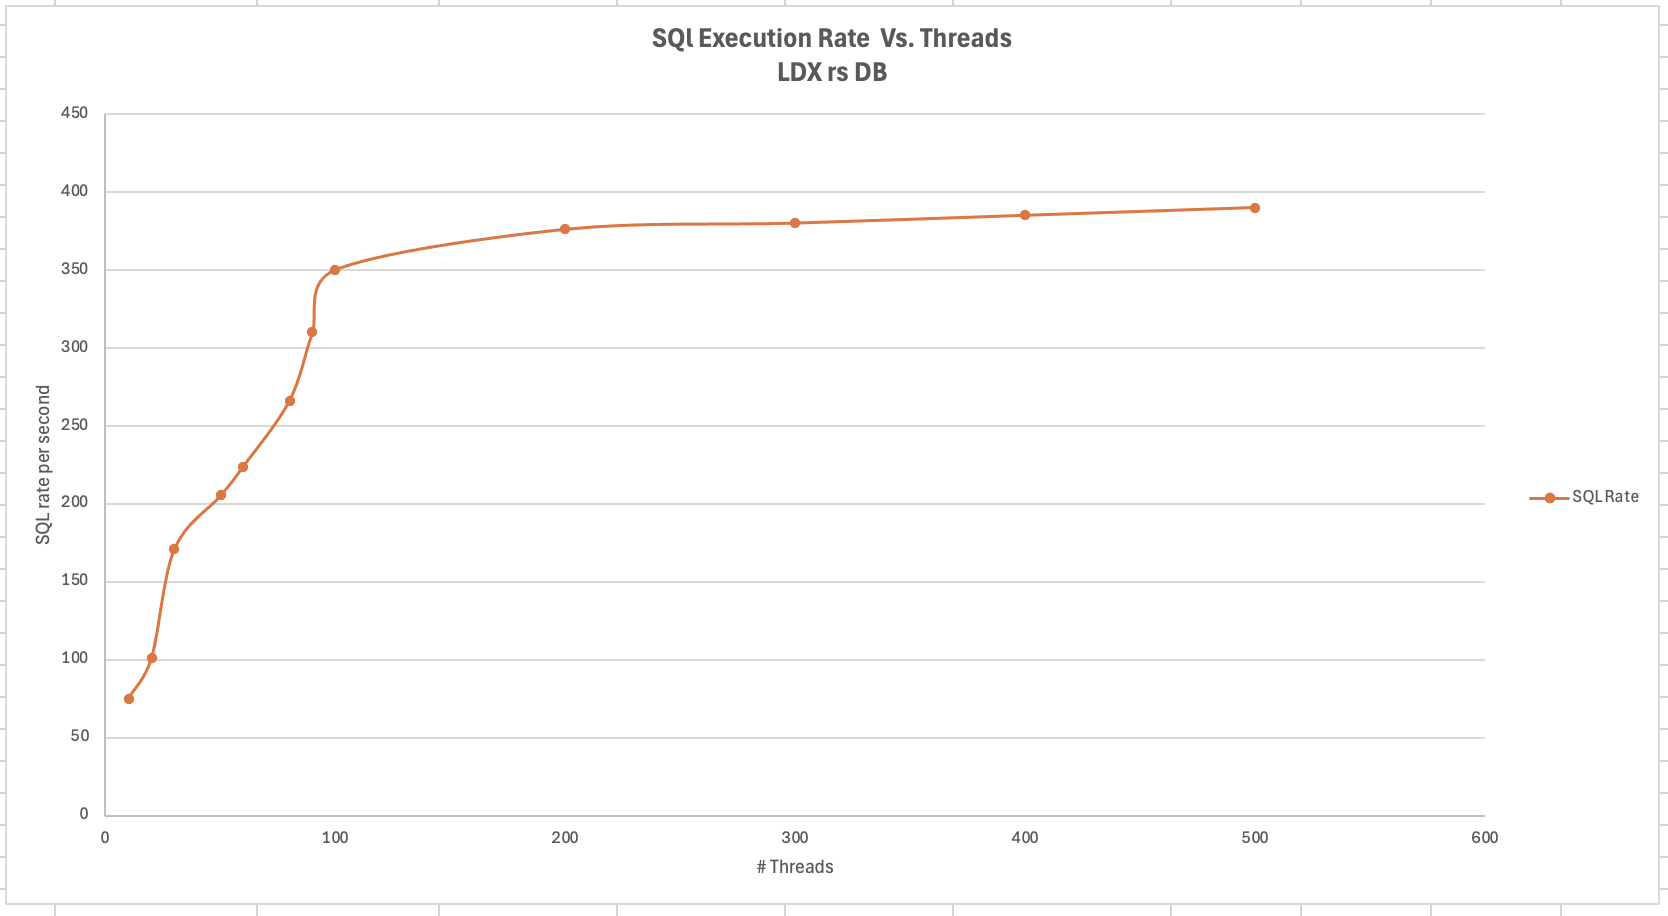
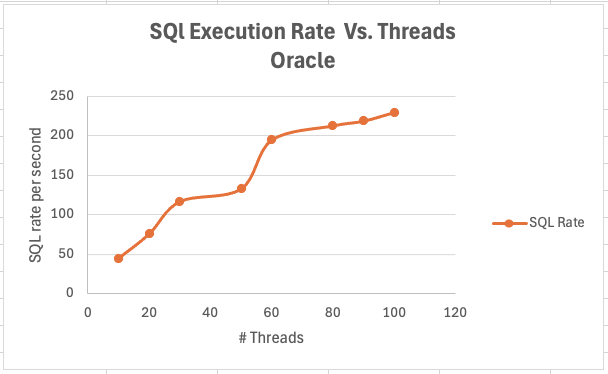
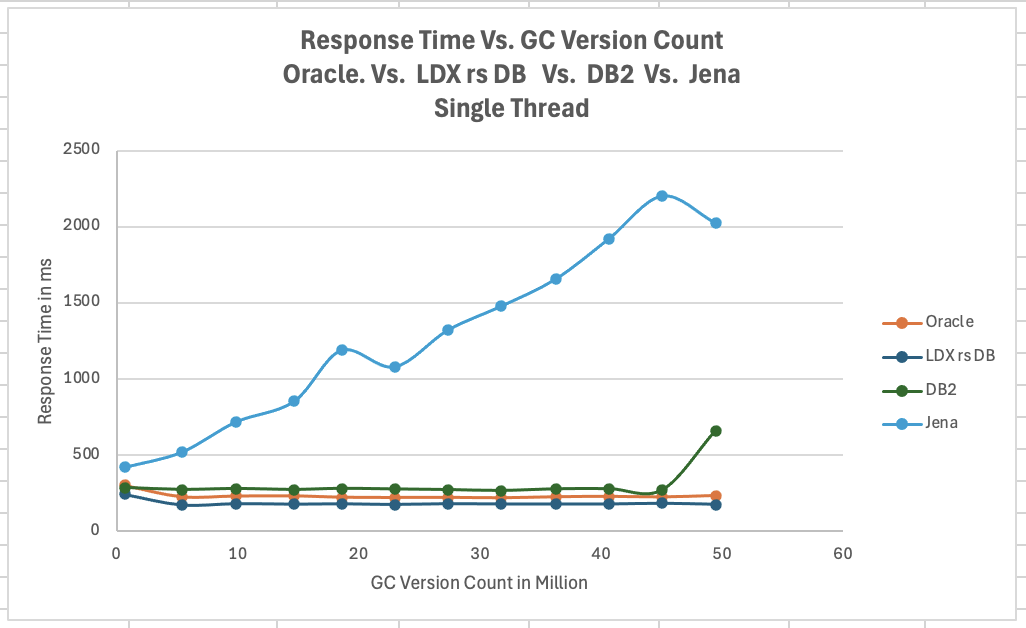
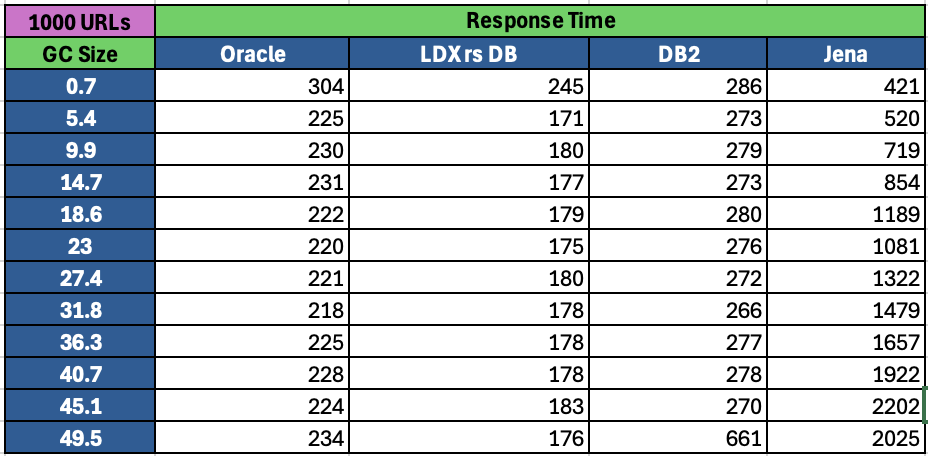
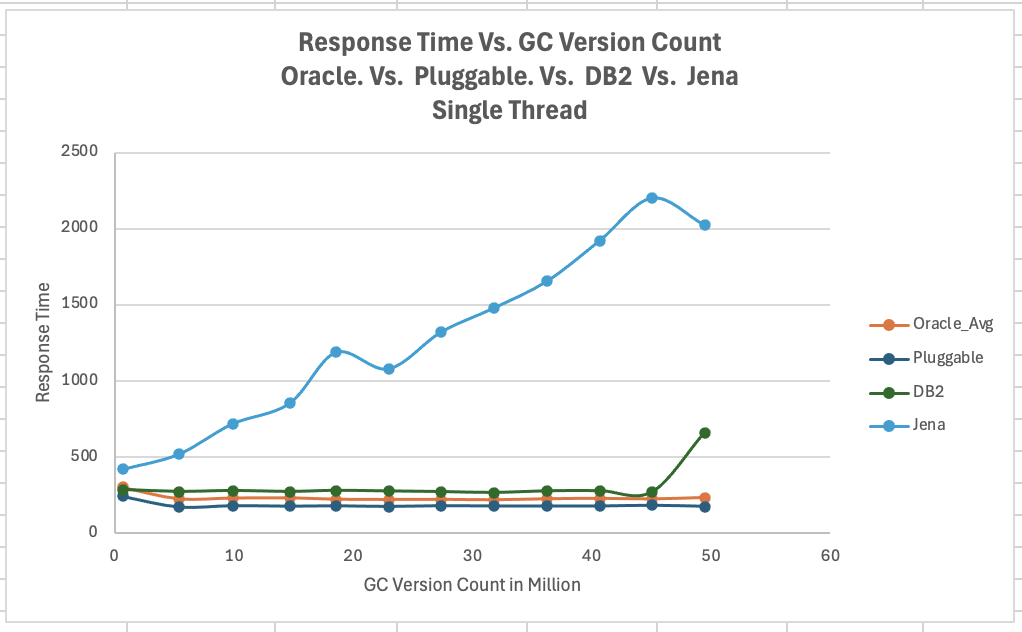
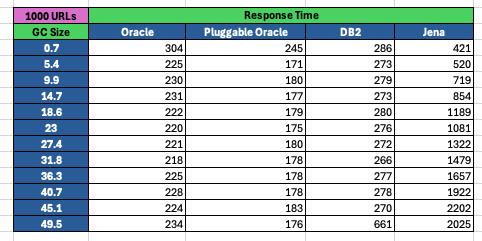
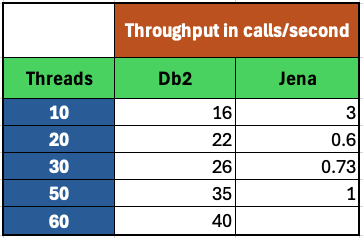
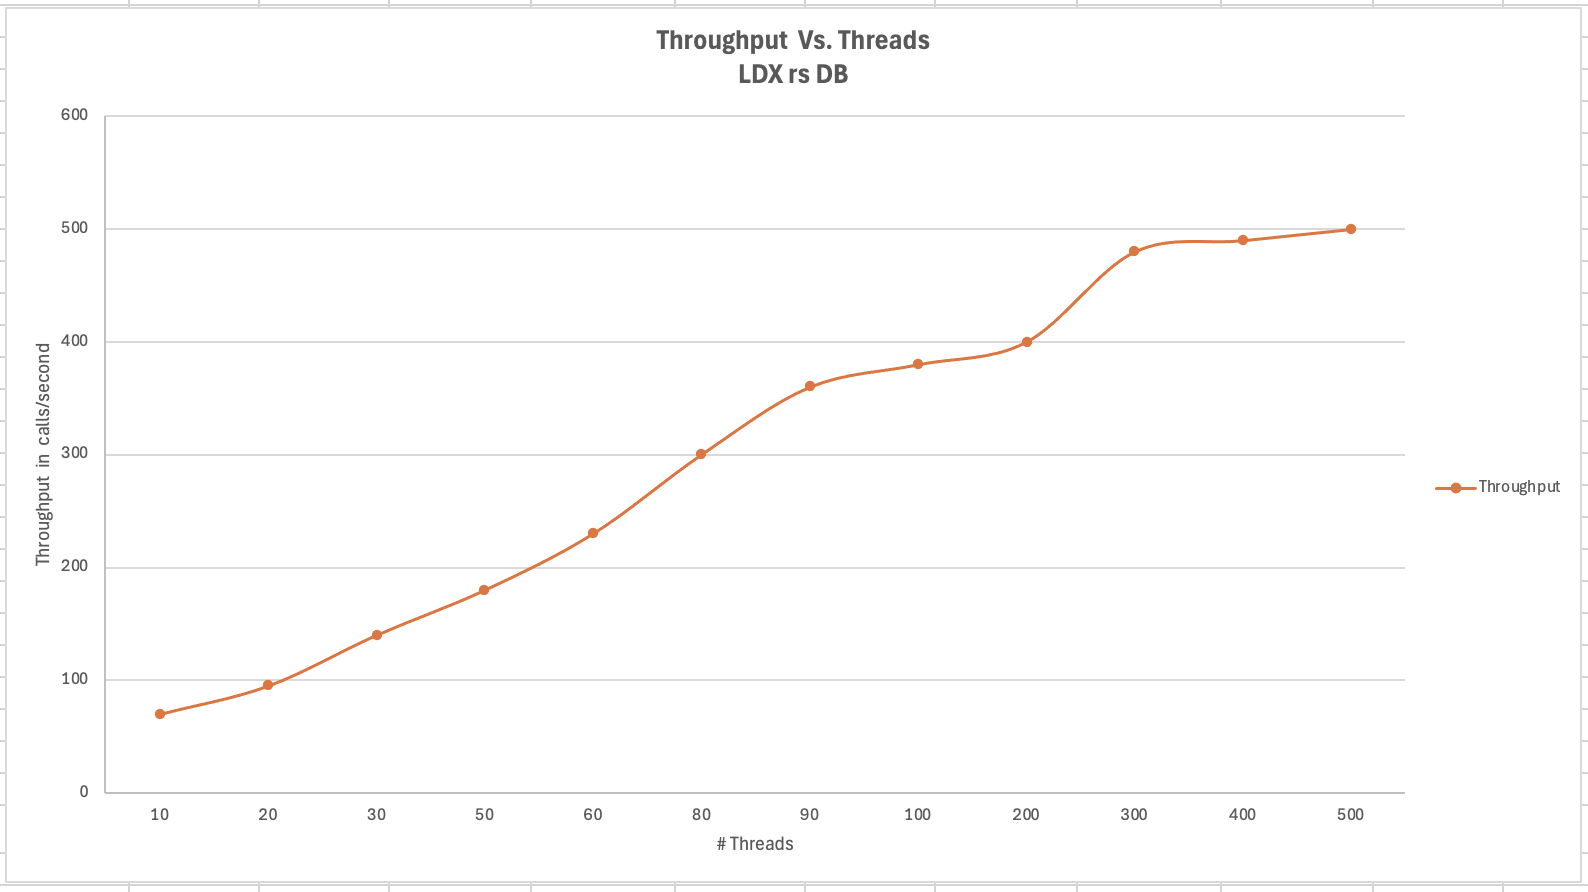
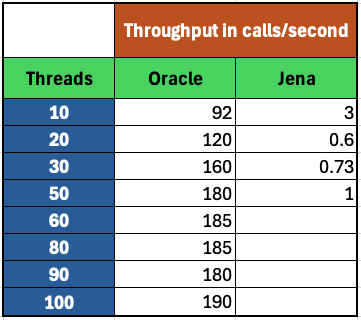
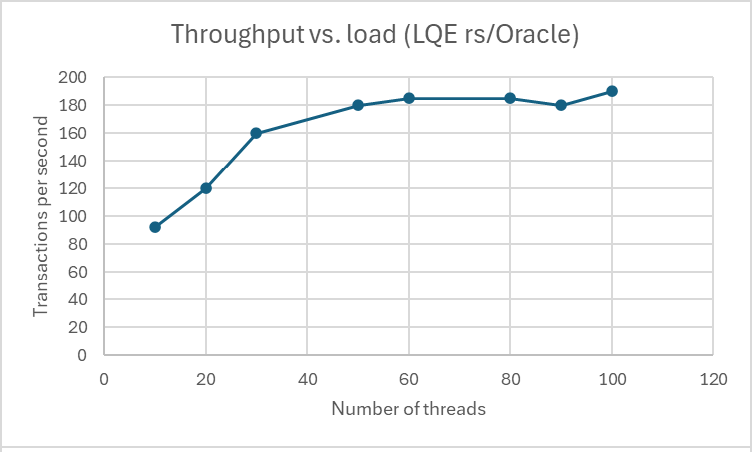
<div id="header-title" style="padding: 10px 15px; border-width:1px; border-style:solid; border-color:#FFD28C; background-image: url(<nop>https://jazz.net/wiki/pub/Deployment/WebPreferences/TLASE.jpg); background-size: cover; font-size:120%"> ---+!! LDX rs 7.1 Performance Report <img src="https://jazz.net/wiki/pub/Deployment/WebPreferences/todo.png" alt="todo.png" width="50" height="50" align="right"> %DKGRAY% Authors: Main.SameerkumarKalaria, Main.VaughnRokosz <br> Build basis: 7.1.0 %ENDCOLOR%</div></sticky> <!-- Page contents top of page on right hand side in box --> <sticky><div style="float:right; border-width:1px; border-style:solid; border-color:#DFDFDF; background-color:#F6F6F6; margin:0 0 15px 15px; padding: 0 15px 0 15px;"> %TOC{title="Page contents"}% </div></sticky> <sticky><div style="margin:15px;"></sticky> ---+ Introduction The Link Index Provider (LDX) is a component of the Engineering Lifecycle Management solution (ELM) that builds and maintains an index of links between artifacts. ELM applications query the LDX to get information about links. In the ELM 7.1 release, the LDX was rearchitected to use a relational database for storing link information. This article discusses the performance of the new LDX architecture. The new LDX architecture, which IBM calls LDX rs, is based on the same architecture that was adopted for [[https://jazz.net/wiki/bin/view/Deployment/LQErs703Performance][the Lifecycle Query Engine (LQE) in the 7.0.3 release]]. Here's what you can expect from LDX in 7.1: * Simplified deployment topologies, allowing for a single LQE rs to support both reporting and link resolution. A separate LDX server is no longer required (although that is still an option) * Improved scalability and resilience. LDX rs handles concurrent queries more efficiently, and long link queries will no longer impact the entire LDX server * Equivalent or better performance for link queries * Load shifts from the LQE/LDX server to the database server: * Less memory is required for LDX or LQE servers * CPU and memory usage will increase on your database server. Consider deploying a new database server to support LQE/LDX rs. The following topics are covered in this article: * Architectural changes for LDX rs in 7.1 release * Deployment topology * Data shape used for performance testing and testing environment details * Performance test results ---+++!! Standard Disclaimer The information in this document is distributed AS IS. The use of this information or the implementation of any of these techniques is a customer responsibility and depends on the customer’s ability to evaluate and integrate them into the customer’s operational environment. While each item may have been reviewed by IBM for accuracy in a specific situation, there is no guarantee that the same or similar results will be obtained elsewhere. Customers attempting to adapt these techniques to their own environments do so at their own risk. Any pointers in this publication to external Web sites are provided for convenience only and do not in any manner serve as an endorsement of these Web sites. Any performance data contained in this document was determined in a controlled environment, and therefore, the results that may be obtained in other operating environments may vary significantly. Users of this document should verify the applicable data for their specific environment. Performance is based on measurements and projections using standard IBM benchmarks in a controlled environment. The actual throughput or performance that any user will experience will vary depending upon many factors, including considerations such as the amount of multi-programming in the user’s job stream, the I/O configuration, the storage configuration, and the workload processed. Therefore, no assurance can be given that an individual user will achieve results similar to those stated here. This testing was done as a way to compare and characterize the differences in performance between different versions of the product. The results shown here should thus be looked at as a comparison of the contrasting performance between different versions, and not as an absolute benchmark of performance. <br> ---++ How LQE and LDX architecture has evolved Up until the 7.0.2 release, the Lifecycle Query Engine (LQE) stored information using a triple store database provided by [[https://jena.apache.org/documentation/tdb/][Apache Jena]] (Jena TDB). This was also true for the Link Index Provider (LDX), since LDX is just a specialized instance of LQE. This is shown in the architectural diagram below. <img src="https://jazz.net/wiki/pub/Deployment/LDXrs710Performance/Architecture702.png" width="600" /> Abbreviations: * EWM: Engineering Workflow Management * ETM: Engineering Test Management * ERM: Engineering Requirements Management DOORS Next Both LQE and LDX used Tracked Resource Set (TRS) feeds provided by applications to index data and store it in the Jena triple store. LDX indexed a subset of the TRS data, focusing just on links. Reporting against LQE data involved an instance of the Report Builder application. Reports were defined in Report Builder and then executed by the LQE server. The LQE server would read data from the Jena triple store and return it to Report Builder. For link-related queries, applications made requests to the LDX asking for links. The LDX would read data from the Jena triple store and return it to the applications. Note that the LDX was often hosted in the same Java Virtual Machine (JVM) as the Jazz Team Server (JTS), although larger customers were encouraged to [[https://www.ibm.com/support/pages/node/6348196][move the LDX onto its own dedicated server]]. This architecture had several disadvantages for large indexes or high concurrent load: * The Jena index must be local to the LQE/LDX server machine, which prevents addressing scale issues through clustering * Both LQE and LDX index application data, which added load to the ELM application servers * Large Jena indexes must be almost entirely cached in memory for performance reasons, so that LQE/LDX servers require large amounts of RAM (as well as large Java heaps) * Jena does not have a sophisticated query optimization engine, so complex traceability reports can be slow, and there are limited options to tune SPARQL queries to perform better An additional limitation of the Jena architecture is how it deals with load. A single long-running query can severely impact the performance of the entire LQE or LDX server. There are two reasons this happens. * There is contention for internal resources within Jena when running queries. Too many simultaneous queries will interfere with each other, and bottlenecks form when some of those queries take a long time to run * Workloads that involve both query execution and indexing create contention between read and write operations against Jena. If a query is running when indexed data is written to disk, the updated data is temporarily stored in a journal file. Jena can combine the data in the main database with the updates in the journal to present a consistent view of the state of the database at the time the query started. The journal is merged into the main database once there are no reads pending. There are some problems with this approach. First, the journal will continue to grow as long as there are queries running. And queries will be running if the reports are slow, or if the report workload is high (i.e., many users are running reports frequently). A busy LQE server may not be idle very often, which means that the journal keeps growing. LQE tries to limit the impact by suspending indexing when the number of pending journal updates reaches a threshold, but that means that reports will include stale data until the indexing resumes. Additionally, queries get slower as the journal grows, since Jena has to do more work to identify the correct dataset for a given query. This means there is a feedback loop where slow queries cause the journal to grow, which in turn causes the queries to be slower and then prevents the journal from being merged into the main database. This feedback loop can even be triggered by a single slow query. Because of these disadvantages, LQE was rearchitected in 7.0.3 to replace Jena with a relational database. LDX in 7.0.3 stayed with the Jena architecture. ---+++ LQE and LDX architecture in the 7.1 release In the 7.1 release, LDX has adopted the relational store. The recommended deployment topology is shown below. <img src="https://jazz.net/wiki/pub/Deployment/LDXrs710Performance/Architecture71.png" width="600"/> Abbreviation: * RMM: Engineering Rhapsody Model Manager In 7.1, you can deploy a single LQE rs instance that will support both reporting and link resolution. This LQE rs instance will still read the TRS feeds provided by the applications, but the indexed data is stored in a relational database instead of in the Jena triple store. Requests to generate reports flow from Report Builder to the relational database, bypassing the LQE server. Requests for link information flow from the applications to LQE rs (in its role as LDX), but the link data is retrieved from the relational database instead of from the Jena triple store. This improves the scalability of the LQE solution in several ways: * Database optimization engines are more sophisticated than Jena, allowing for improved query execution * There is no longer a need for a separate LDX application, simplifying the topology (and reducing load on the ELM applications by eliminating unnecessary reads of the TRS feeds) * There are more options for tuning the performance of SQL queries than there were for SPARQL queries * Relational databases are designed for high data volumes * Relational databases are much better at dealing with concurrent reading and writing. While locking is still needed, the locking usually happens at the row level. Lock escalation to the table level is not frequent, so one slow SQL query will not disrupt the entire server. * Since query processing shifts from the LQE rs server to the database server in this architecture, the LQE rs server requires less RAM. RAM freed up from LQE can be moved to the database server where it can be used more efficiently. Less memory is also required for link resolution, since the caching of selections within LQE/LDX is no longer needed (that moves to the relational database). * Data is represented more efficiently in the database compared to Apache Jena TDB files, saving storage space * Clustering becomes possible through standard database solutions like Oracle RAC or Db2 !PureScale You have the option to deploy LDX rs as an application separate from LQE rs, but this requires that you set up a separate data warehouse for LDX rs data. An instance of LDX cannot share the index data created by LQE rs. IBM recommends that you start with a single LQE rs server and only deploy a separate LDX server if the LQE rs server cannot handle your workload. IBM strongly recommends using [[https://jazz.net/wiki/bin/view/Deployment/DeploymentMonitoring][monitoring tools]] to watch for signs that a single LQE rs is not enough. ---+ Test methodology This section discusses how the LDX rs performance tests were conducted. It covers: * The data used for testing * The topology of the test environment * How load was applied to the servers ---++ Data Shape The test repository was based on the repository used during [[https://jazz.net/wiki/bin/view/Deployment/LQErs703Performance#Data_shape][LQE rs testing in 7.0.3]]. That repository was extended with 6 additional ELM applications, and links were created between the artifacts. %TABLE{ tableborder="2" cellpadding="2" cellspacing="2" cellborder="2" headeralign="right" dataalign="right" disableallsort="on" tablewidth="30%" }% | *Application* | *Artifact count* | *Database size* | |rm1 | 10 million | 800G | |rm2 | 20,000 | 27G | |rm3 | 20,000 | 27G | |etm1 | 5 million| 832G | |etm2 |700,000 | 15G | |etm3 |700,000 | 12G | |ewm1| 2 million| 152G| |ewm2| 60,000 | 65G| |ewm3| 60,000 | 3.5G | |gc| 1000 components | <br> Links were established between the requirements in the rm2 and rm3 servers and artifacts in ETM, EWM, and RMM: 1. *Validated By (ETM)*: Links artifacts in ERM that are validated by test cases in ETM 2. *Tracked By (EWM)*: Links artifacts in ERM that are tracked by work items in EWM 3. *Implemented By (EWM)*: Links artifacts in ERM that are implemented by tasks in EWM 4. *Affected By (EWM)*: Links artifacts in ERM that are affected by changes in EWM 5. *Derives Architecture Element (RMM)*: Links artifacts in ERM that derive architectural elements in RMM 6. *Traced By Architecture Element (RMM)*: Links artifacts in ERM that are traced by architectural elements in RMM 7. *Satisfied By Architecture Element (RMM)*: Links artifacts in ERM that are satisfied by architectural elements in RMM 8. *Refined By Architecture Element (RMM)*: Links artifacts in ERM that are refined by architectural elements in RMM *Abbreviations*: * EWM = Engineering Workflow Management * ETM = Engineering Test Management * ERM = Engineering Requirements Management DOORS Next * RMM = Engineering Rhapsody Model Manager There are a total of 10,000 cross-application links. There are an additional 50 million links between ERM artifacts. <span style="font-size: 13px; font-weight: bold; text-decoration: underline;">Global configurations</span> Since cross-application linking always happens in the context of a global configuration (GC), GCs were created with selection sizes ranging from 700,000 to 50 million. Selection size refers to the number of versions that are part of the stream or baseline that is referenced by the GC component. Here is an example of one of the test GCs. This particular GC contains 40 million versions. <img src="%ATTACHURLPATH%/GCComponent.png" alt="GCComponent.png" width="700" height="700" /> ---++ Load testing methodology In normal operation, users interact with applications, and those applications decide whether to send requests for link information to LDX. The load tests simulate user activity by sending requests directly to the LDX server, bypassing the applications. Direct interaction with the LDX during load testing offers several advantages: * More precise control of the workload applied to LDX is possible * Application-side bottlenecks that might restrict traffic to the LDX are avoided The workload applies the maximum level of stress possible. * Each request asks for links for 1000 artifacts * Each simulated user makes requests as fast as possible (no think time) ---+++ Threads vs. users The performance tests characterize workload in terms of threads. The workload is generated by sending requests directly to the LDX server from a test program, and the test program simulates multi-user load by running multiple threads. Each thread can be thought of as a simulating a very active user that does nothing but make requests for links. There is no pausing, so each thread makes requests as fast as it can. This is an extremely intense workload that is designed to drive the LDX rs system to its limits. Real users are much less active, and interact with LDX rs indirectly through the applications. For example, when a user opens a view that has link columns using ERM, a request will be sent to LDX rs from the ERM server. You can consider each thread (or simulated user) to be the equivalent of 20 real users. ---+++ Performance Automation Tools Used in Testing To evaluate the performance of the LDX rs under various conditions, we employed a combination of custom-developed automation tools and industry-standard monitoring solutions. This approach allowed us to generate load, measure response times, and monitor throughput and CPU usage. <span style="font-size: 14px; font-weight: bold; text-decoration: underline;">Load Generation and Response Time Measurement</span> 1. *Custom JAVA Automation Tool*: * _Functionality_: The tool was developed using JAVA to generate load on the LDX rs REST API through a multithreading mechanism. It triggers LDX rs API calls in parallel based on configurations specified in a configuration file. * _Configuration Options_: * Thread Load: Number of concurrent threads. * Database Type: Choice between relational databases and Jena. * Number of Target URLs: The number of URLs to target per API call. * API Call Frequency: How many times to trigger the same API. * ‘RunBoth’ Property: If set to true, the tool can handle load for both relational databases and Jena simultaneously and compare their results at the end. * _Output_: The tool generates a simple text file as the result file, capturing the response times for each test run. 2. *Usage*: This tool was instrumental in measuring the response time of the LDX rs API under different thread loads and configurations, providing essential data for performance analysis. <span style="font-size: 14px; font-weight: bold; text-decoration: underline;">Throughput and CPU Usage Monitoring</span> 1. *NMON*: * _Functionality_: NMON is used for monitoring system performance and resource usage. * _Integration_: The NMON tool was started automatically by the JAVA automation tool during each performance run. * _Output_: After the performance run, NMON data was used for detailed analysis of CPU usage and other system metrics over the duration of the test. 2. *IBM Instana*: * _Functionality_: IBM Instana Observability automatically discovers, maps, and monitors all services and infrastructure components, providing complete visibility across your application stack. We used for monitoring throughput and CPU usage during load test. * _Configuration_: * Central Monitoring: Instana backend was configured on a central machine. * Agents: Instana agents were running on each server that needed to be monitored. * _Output_: Instana provided real-time data and insights into the system's performance, aiding in the identification of performance bottlenecks. ---------------- <br> ---++ Test Environment Details Performance tests were conducted against 4 different test environments, in order to example LDX performance on both Oracle and DB2, as well as collecting baseline data from Jena. The 4 test systems: %TABLE{ tableborder="2" cellpadding="2" cellspacing="2" cellborder="2" headeralign="right" dataalign="right" disableallsort="on" tablewidth="60%" }% | *#* | *Description* | *Specs* | *Notes*| |1| LQE Jena | 40 vCPU, 768G RAM| | |2| LQE rs/Oracle | 40 vCPU, 768G RAM| Oracle co-located with LQE rs| |3| LQE rs/Db2 | 40 vCPU, 768G RAM| Db2 co-located with LQE rs| |4a| LDX rs (Oracle) | Oracle: 80 vCPU, 768G RAM| LDX rs and Oracle on separate servers| |4b| | LDX rs: 24 vCPU, 64G RAM | | <br> Topologies 1-3 are the same as were used in the [[https://jazz.net/wiki/bin/view/Deployment/LQErs703Performance#Deployment_topology][LQE rs performance testing in 7.0.3]]. Topology 4 sets up an LDX rs server with its own dedicated database server. LDX rs and Oracle are each deployed onto seperate servers, and the Oracle instance uses high-speed storage (a RAID 10 array of 24 nvme drives). The servers in the test environment are all physical servers. The hardware specifications are listed below. <table border="2" cellpadding="2" cellspacing="2" cellborder="2"> <tr> <th><b>Role</b></th> <th><b>Server</b></th> <th><b>Machine Type</b></th> <th><b>Processor</b></th> <th><b>Total Processors</b></th> <th><b>Memory</b></th> <th><b>Storage</b></th> <th><b>OS Version</b></th> </tr> <tr> <td> LQE rs/Oracle</td> <td> Oracle 19c </td> <td> IBM System SR650 </td> <td> 2 x Xeon Silver 4114 10C 2.2GHz (ten-core) </td> <td> 40 </td> <td> 768 GB </td> <td> RAID 10 – 900GB SAS Disk x 16 </td> <td> RHEL 7 </td> </tr> <td> LQE/Jena </td> <td> Oracle 19c </td> <td> IBM System SR650 </td> <td> 2 x Xeon Silver 4114 10C 2.2GHz (ten-core) </td> <td> 40 </td> <td> 768 GB </td> <td> RAID 10 – 900GB SAS Disk x 16 </td> <td> RHEL 7 </td> </tr> <tr> <td> LQE rs/Db2 </td> <td> Db2 11.5 </td> <td> IBM System SR650 </td> <td> 2 x Xeon Silver 4114 10C 2.2GHz (ten-core) </td> <td> 40 </td> <td> 768 GB </td> <td> RAID 10 – 900GB SAS Disk x 16 </td> <td> RHEL 7 </td> </tr> <tr> <td> LDX rs</td> <td> !WebSphere Liberty </td> <td> IBM System x3550 M4 </td> <td> 2 x Intel Xeon E5-2640 2.5GHz (six-core) </td> <td> 24 </td> <td> 64 GB </td> <td> RAID 1 – 300GB SAS Disk x 4 – 128K Strip Size </td> <td> RHEL 7 </td> </tr> <tr> <td> Oracle for LDX rs </td> <td> Oracle 19c </td> <td> IBM System SR650 V2 </td> <td> 2 x Xeon Silver 4114 10C 2.2GHz (ten-core) </td> <td> 80 </td> <td> 768 GB </td> <td> Raid 10 - 800GB NVME Kioxia Mainstream Drive x 24 - 7.3 TB on /mnt/raid10 </td> <td> RHEL 8 </td> </tr> </table> <br> ---+ Performance Test Results This section presents the results of the performance tests against the 4 topologies. In summary: * LDX rs outperforms the Jena architecture by a significant margin, especially at higher load levels. * The limiting factor is the number of processors on the server hosting LDX or LQE. * Higher throughputs should be possible by adding more CPUs ---++ Single-user testing This section looks at the response times for LDX rs queries for the 4 different test topologies, using one simulated user. You can consider these to be "best case" numbers since they reflect performance when the systems are not under heavy load. Each request asks for the links associated with 1000 different artifacts. The tests were repeated with global configurations of various sizes (ranging from 700,000 versions to 50 million versions). *Test Parameters*: <table border="2" cellpadding="2" cellspacing="2" cellborder="2"> <tr> <th><b>Parameter</b></th> <th><b>Value</b></th> </tr> <tr> <td>Threads</td> <td>Single thread</td> </tr> <tr> <td>Target URLs</td> <td>1000</td> </tr> <tr> <td>GC Selection Size</td> <td>0.7M to 50M</td> </tr> <tr> <td>Number of Link types</td> <td>7</td> </tr> </table> <br> The chart below summarizes the response times for a query returning links for 1000 URLs, executed against all 4 topologies. The relational store topologies outperform Jena at every level of scale, and are not sensitive to the version counts. LQE/Jena degrades as the version counts increase. ---------------- <div style="display: flex;"> <img src="%ATTACHURLPATH%/SingleThreadChart.png" alt="SingleThreadChart.png" width="700" height="500" /> </div> ---------------- ---++ Load test results: LQE rs/Oracle This section presents the results of the load testing against topology 2 (LQE rs/Oracle). *Test Parameters*: <table border="2" cellpadding="2" cellspacing="2" cellborder="2"> <tr> <th><b>Parameter</b></th> <th><b>Value</b></th> </tr> <tr> <td>Test environment</td> <td>LQE rs/Oracle (topology 2)</td> </tr> <tr> <td>Threads</td> <td>10 to 100</td> </tr> <tr> <td>Target URLs</td> <td>1000</td> </tr> <tr> <td>GC Selection Size</td> <td>40M</td> </tr> <tr> <td>Number of Link types</td> <td>7</td> </tr> <tr> <td>Environment</td> <td>Topology 2</td> </tr> </table> <span style="font-size: 14px; font-weight: bold; text-decoration: underline;">Summary:</span> * Maximum throughput: 185 requests per second (at 60 threads) * Throughput is limited by available CPU * Response times increase gradually if the system becomes overloaded * Disk utilization on the database server is low * System behaviour under load is improved when compared to LQE/Jena The detailed results for response time, CPU usage, and throughput are shown below. Looking at the three charts together, the throughput levels out at 60 threads. The total CPU usage on the server at that point is 70%. Response times increase as the load increases, but remain within reasonable levels. <img src="https://jazz.net/wiki/pub/Deployment/LDXrs710Performance/RespTopology2.png" width="600"/> <img src="https://jazz.net/wiki/pub/Deployment/LDXrs710Performance/CPUTopology2.png" width="600"/> <img src="https://jazz.net/wiki/pub/Deployment/LDXrs710Performance/ThroughputTopology2.png" width="600"/> Disk utilization on the LQE rs/Oracle server is low (15% at 100 threads). The storage subsystem is not a bottleneck. ---+++ Comparing to LQE/Jena LQE/Jena reaches a maximum throughput of 3 transactions per second at only 10 threads. <img src="%ATTACHURLPATH%/Throughput-Oracle.png" alt="Throughput-Oracle.png"/> Response times for LQE/Jena are much higher than for LQE rs/Oracle, and the Jena response times degrade quickly as load increases . <img src="%ATTACHURLPATH%/ResponseTime-Oracle.png" alt="ResponseTime-Oracle.png" /> ---++ Load test results: LQE rs/Db2 This section presents the results of the load testing against LQE rs/Db2 (topology 3). *Test Parameters*: <table border="2" cellpadding="2" cellspacing="2" cellborder="2"> <tr> <th><b>Parameter</b></th> <th><b>Value</b></th> </tr> <tr> <td>Threads</td> <td>10 to 100</td> </tr> <tr> <td>Target URLs</td> <td>1000</td> </tr> <tr> <td>GC Selection Size</td> <td>.7M to 50M</td> </tr> <tr> <td>Number of Link types</td> <td>7</td> </tr> <tr> <td>Environment</td> <td>Topology 3</td> </tr> </table> <span style="font-size: 14px; font-weight: bold; text-decoration: underline;">Summary of results:</span> * LQE rs/Db2 performance at load is impacted by the number of versions in a global configuration * Throughput can vary from 200 transactions per second (700k version) to 50 transactions per second (50M version) * LQE rs/Db2 outperforms LQE/Jena by a significant margin * Throughput is additionally limited by available CPU * Response times increase gradually if the system becomes overloaded * System tolerates overloads without crashing * Disk utilization on the database server is low <span style="font-size: 14px; font-weight: bold; text-decoration: underline;">Throughput</span> The throughput decreases as the GC selection size increases. The chart below shows the impact of selection size on throughput for a constant workload generated by 20 threads. At smaller selection sizes, where the response time is faster, throughput reaches approximately at 120 requests per second. However, as the selection size grows, throughput drops to as low as 25 requests per second (for 50M versions). ---------------- <img src="%ATTACHURLPATH%/GCImpactThroughput-Db2.png" alt="GCImpactThroughput-Db2.png" width="700" height="500" /> ---------------- ---+++ Comparing to LQE/Jena <span style="font-size: 14px; font-weight: bold; text-decoration: underline;">Throughput</span> The table below compares the throughput of LQE rs/Db2 to LQE/Jena, for a large GC containing 40 million versions. LQE rs/Db2 outperforms LQE/Jena significantly, even with this large GC. ---------------- <img src="%ATTACHURLPATH%/Throughput-Db2.png" alt="Throughput-Db2.png" /> ---------------- <span style="font-size: 14px; font-weight: bold; text-decoration: underline;">CPU Usage</span> The chart below shows CPU usage for LQE rs/Db2 and Jena, as load increases. For LQE rs/Db2, the server has maxed out the CPU at 60 threads. In this topology, the LQE rs server and the Db2 server are co-located; separating the LQE rs application onto its own server would improve performance. LQE/Jena becomes non-responsive past 50 threads. ---------------- <img src="%ATTACHURLPATH%/CPU-Db2.png" alt="CPU-Db2.png" /> ---------------- <span style="font-size: 14px; font-weight: bold; text-decoration: underline;">Average Response Time</span> The table below shows how response times vary as load increases, for both LQE rs/Db2 and LQE/Jena, for a large GC selection size of 40 million versions. LQE rs/Db2 outperforms Jena. ---------------- <img src="%ATTACHURLPATH%/ResponseTime-Db2.png" alt="ResponseTime-Db2.png" /> ---------------- Looking at the response times for LQE rs/Db2 using a smaller GC (10 million versions), the response times increase slightly as the load increases. For this run, the CPU on the test system maxes out around 60 threads. <img src="%ATTACHURLPATH%/DB2Resp10M.png" alt="DB2Resp10M.png" /> <span style="font-size: 14px; font-weight: bold; text-decoration: underline;">Disk Utilization on DB Server</span> Disk utilization on the DB server shows a gradual increase as load increases but remains low. The storage subsystem is not a bottleneck. ---------------- <img src="%ATTACHURLPATH%/DiskIO-Db2.png" alt="DiskIO-Db2.png" /> ---------------- ---++ LDX rs/Oracle This section analyzes the performance of the LDX rs system in a topology where the LDX application and the database are hosted on separate servers. Oracle is deployed as the relational store on the dedicated database server. *Test Parameters*: <table border="2" cellpadding="2" cellspacing="2" cellborder="2"> <tr> <th><b>Parameter</b></th> <th><b>Value</b></th> </tr> <tr> <td>Threads</td> <td>Up to 500</td> </tr> <tr> <td>Target URLs</td> <td>1000</td> </tr> <tr> <td>GC Selection Size</td> <td>40M</td> </tr> <tr> <td>Number of Link types</td> <td>7</td> </tr> <tr> <td>Topology</td> <td>Topology 4</td> </tr> </table> <br> Topology 4 involves a standalone LDX rs and a separate high capacity database server: * LDX rs server: 24 vCPu, 32G RAM * Database server: 80 vCPU, 768G RAM * Storage: RAID 10 array of 24 nvme drives <span style="font-size: 14px; font-weight: bold; text-decoration: underline;">Summary of results:</span> * Maximum throughput: 500 requests per second at 500 threads, with throughput starting to level off starting at 300 threads. * Response times increase slightly as the workload increases, but stays below 1s up until 400 threads. As load increases past that point, response times continue to increase. * The LDX rs server nears 100% CPU around 500 threads (90% CPU at 400 threads) * The system could handle up to 2000 threads without hanging or crashing, but response times had degraded to 9 seconds at that load. * CPU and Disk utilization on the database server is low. The database is not a bottleneck for this workload. The limiting factor is the number of processors available on the LDX rs server. <span style="font-size: 14px; font-weight: bold; text-decoration: underline;">Throughput</span> The expectation is that throughput should increase steadily as the number of threads increases (more threads means more work gets done). At some point, the system will reach a maximum throughput once a bottleneck forms. In this test, throughput increases steadily up until 300 threads, and there is a small increase in throughput up to 500 threads. There is no additional throughput gain beyond 500 threads. The CPU usage on the LDX rs server is maxing out between 300-500 threads, so CPU is the bottleneck. The expectation is that adding more processors to the LDX rs server would allow for higher throughput. ---------------- <img src="%ATTACHURLPATH%/Throughput-LDXrs.png" alt="Throughput-LDXrs.png" width="700" height="500" /> ---------------- <span style="font-size: 14px; font-weight: bold; text-decoration: underline;">CPU Usage</span> At 500 threads, the LDX rs server’s CPU usage nears 95%, while the database server still has spare CPU capacity. This indicates that the LDX rs server is the bottleneck rather than the database. As the load increases beyond 500 threads, the LDX rs server becomes overloaded, and response times degrade. The database server’s CPU usage remains relatively constant beyond 500 threads. Database CPU usage does not increase since the bottleneck is in the LDX rs server. ---------------- <img src="%ATTACHURLPATH%/CPU-LDXrs.png" alt="CPU-LDXrs.png" width="700" height="500" /> ---------------- <span style="font-size: 14px; font-weight: bold; text-decoration: underline;">Average Response Time</span> The response time analysis is presented in two charts. The first chart illustrates the system’s response time up to its effective limit of 500 threads. In this range, the response time remains consistently under 1 second. The second chart shows the system’s behavior under extreme load, ranging from 500 to 2000 threads. In this scenario, the response time increases as the thread count increases. Despite the increasing response times, the system continues to process requests, unlike in the case of Jena, which stops responding after 50 threads. This indicates that while the system experiences performance degradation under high load, it still maintains functionality, processing requests without failing. ---------------- <img src="%ATTACHURLPATH%/ResponseTime-LDXrs.png" alt="ResponseTime-LDXrs.png" width="1200" height="500" /> ---------------- <span style="font-size: 14px; font-weight: bold; text-decoration: underline;">Disk Utilization</span> Disk utilization on the database server increases as the thread count rises. The disk I/O stabilizes at around 30% after the load reaches 1000 threads. This indicates that the disk is not a bottleneck, as it has sufficient capacity to handle the I/O demands even under higher loads. ---------------- <img src="%ATTACHURLPATH%/DiskIO-LDXrs.png" alt="DiskIO-LDXrs.png" width="700" height="500" /> ---------------- ---+ Tuning LDX rs for large workloads To ensure optimal performance and stability of the LDX RS under high-load conditions, several tuning configurations need to be adjusted for large workloads, such as scenarios involving 1000, 2000, or 5000 concurrent threads. These adjustments aim to enhance connection handling capabilities. Below sections provide recommendations for tuning critical parameters on the LDX rs server, JTS server, IBM HTTP Server (IHS), Oracle database and Db2 database to handle large workloads effectively. <span style="font-size: 16px; font-weight: bold; text-decoration: underline;">LDX rs tuning</span> To enhance the ability of LDX rs to manage a high number of concurrent connections and reduce potential bottlenecks caused by connection constraints below tuning settings needs to be done. *Increase Maximum Total Connections and Maximum Connections Per Route:* * Navigate to the LDX rs advanced properties section. * Set the following properties: * *Maximum Total Connections*: Increase the value based on the expected load. For example, set it to 2000 for 2000 concurrent threads. * *Maximum Connections Per Route*: Match this value with the Maximum Total Connections property. If the load is 2000, set this property to 2000. *Disable Process Query Metrics:* * Go to Relational Store Settings page, ensure that the 'Process query metrics' option is disabled. * This setting, if enabled, can introduce additional overhead on LDX rs, leading to reduced performance under heavy workloads. ---------------- <span style="font-size: 16px; font-weight: bold; text-decoration: underline;">JTS tuning</span> To manage the number of outgoing HTTP connections effectively to avoid resource contention below tuning settings needs to be done. *Increase Outgoing HTTP Connection Properties:* * Navigate to the JTS advanced properties section and locate the following properties: * *Maximum Outgoing HTTP Connections per Destination*: Set the value based on the load on LDX rs. For a load of 2000 threads, set this property to 2000. * *Maximum Outgoing HTTP Connections Total*: Similarly, set this property value to 2000 for a load of 2000 threads. ---------------- <span style="font-size: 16px; font-weight: bold; text-decoration: underline;">IHS tuning</span> To adjust the maximum number of clients (HTTP request on IHS server) to allow the IHS server to handle high loads below tuning settings needs to be done. *Increase MaxClients Value in httpd.conf:* * Open the ‘httpd.conf ‘configuration file on IHS. * Set the 'MaxClients' value based on the expected load. For example: * If the LDX RS is expected to handle 2000 concurrent threads, set MaxClients to 2000. ---------------- <span style="font-size: 16px; font-weight: bold; text-decoration: underline;">Oracle tuning</span> For optimal performance on Oracle, it is recommended to tune the specified parameters while keeping filesystemio_options and parallel_degree_policy at their default values to maintain system stability and avoid potential overhead. <div style="border: 1px solid #d3d3d3; padding: 10px; background-color: #f2f2f2; font-family: monospace;"> alter system set memory_max_target=250G scope=spfile;<br> alter system set memory_target=250G scope=spfile;<br> alter system set sga_max_size=0 scope=spfile;<br> alter system set sga_target=0 scope=spfile;<br> alter system set pga_aggregate_limit=0 scope=spfile;<br> alter system set pga_aggregate_target=0 scope=spfile;<br><br> #rebounce db. note that in the test we also secured the sizes of sga_max_size, db_cache_size and session_cached_cursors<br> alter system set sga_max_size=123G scope=spfile;<br> alter system set db_cache_size=32G scope=spfile;<br> alter system set session_cached_cursors=1000 scope=spfile;<br><br> #rebounce db<br><br> ####disable adaptive plan<br> alter system set optimizer_adaptive_plans=false; </div> ---------------- <span style="font-size: 16px; font-weight: bold; text-decoration: underline;">Db2 tuning</span> This section addresses Db2 configuration parameters used during the performance testing. We used the following settings for dwDB database: %TABLE{ tableborder="2" cellpadding="2" cellspacing="2" cellborder="2" headeralign="center" dataalign="right" disableallsort="on" tablewidth="40%" }% | Log file size (4KB) | (LOGFILSIZ) = 393216 | | Number of primary log files | (LOGPRIMARY) = 60 | | Number of secondary log files | (LOGSECOND) = 112 | | Size of database shared memory (4KB) | (DATABASE_MEMORY) = 64000000 = 256G | | Buffer pool BP_32K size | 3950000 = 126G | <br> restart the Db2 instance to take effect. ---------------- ---+ Additional details on the data shape ---++ Artifacts count in DOORS NEXT The data shape for DOORS NEXT is made up of standard-sized components. We have 3 standard size modules small, medium and large in each components. Number of artifacts in all 3 modules are summarized below.. We have 3 different standard module sizes: * Small (200 artifacts) * Medium (1500 artifacts) * Large (10,000 artifacts) We use these standard module sizes to create 3 different standard components. %TABLE{ tableborder="2" cellpadding="2" cellspacing="2" cellborder="2" headeralign="right" dataalign="right" disableallsort="on" tablewidth="50%" }% | * Artifact type* | * Small component * | * Medium component * | * Large component * | | Number of large modules | 0 | 0 | 1 | | Number of medium modules | 0 | 3 | 0 | | Number of small modules | 20 | 0 | 0 | | Total module artifacts | 4200 | 4500 | 10000 | | Non-module artifacts | 100 | 100 | 100 | <br> We have created 1 small project with 3 components 1 small, 1 medium and 1 large. The number of artifacts for this standard small project is summarized below. %TABLE{ tableborder="2" cellpadding="2" cellspacing="2" cellborder="2" headeralign="right" dataalign="right" disableallsort="on" tablewidth="20%" }% | * Artifact type * | * Count * | | Large components | 1 | | Medium components | 1 | | Small components | 1 | | Total components | 3 | | Module artifacts | 18,700 | | Non-module artifacts | 300 | | Total artifacts | 19,000 | | Large modules (10,000 artifacts) | 1 | | Medium modules (1,500 artifacts) | 3 | | Small modules (200 artifacts) | 20 | <br> So, we have total 19000 artifacts in one DOORS NEXT small project. ---------------- ---++ Artifacts count in ETM %TABLE{ tableborder="2" cellpadding="2" cellspacing="2" cellborder="2" headeralign="right" dataalign="right" disableallsort="on" tablewidth="30%" }% | *Artifact Type* | *Count* | | test plans | 12 | | test cases | 10,200 | | test scripts | 11,875 | | test suites | 780 | | test case execution records | 50,756 | | test suite execution records | 720 | | test case results | 122,400 | | test suite results | 3,600 | | test execution schedules | 2,848 | | test phases and test environments | 840 | | build definitions and build records | 244 | ---------------- ---++ Artifacts count in EWM There are total 30,187 different work items in the EWM project area. %TABLE{ tableborder="2" cellpadding="2" cellspacing="2" cellborder="2" headeralign="right" dataalign="right" disableallsort="on" tablewidth="20%" }% | *Work Item Type* | *Count* | | Defect | 4,537 | | Task | 25,609 | | Story | 38 | | Epic | 3 | | total | 30,187 | ---------------- ---++ Table sizes in the LQE rs repository | *TABLE NAME* | *ROW COUNT* | | *SELECTIONS_SELECTS* | *411549948* | | *URL* | *135587348* | | *WORK_ITEM_LINK_PROP* | *18371610* | | *RDF_STATEMENT* | *4846212* | | *RDF_STATEMENT_RDF_TYPE* | *4846212* | | *VERSION_RESOURCE* | *4251587* | | *VERSION_RESOURCE_RDF_TYPE* | *4251587* | | *TEST_SCRIPT_STEP_RESULT_LINK_PROP* | *3110140* | | *TEST_RESULT_LINK_PROP* | *2956644* | | *WORK_ITEM_SUBSCRIBERS* | *2731486* | | *WORK_ITEM_SCHEDULE_RDF_TYPE* | *1954679* | | *WORK_ITEM* | *1954679* | | *WORK_ITEM_SCHEDULE* | *1954679* | | *WORK_ITEM_RDF_TYPE* | *1954679* | | *TEST_SCRIPT_STEP* | *1567500* | | *TEST_SCRIPT_STEP_RDF_TYPE* | *1567500* | | *TEST_EXECUTION_RECORD_LINK_PROP* | *1091366* | | *TEST_SCRIPT_STEP_RESULT_RDF_TYPE* | *969595* | | *TEST_SCRIPT_STEP_RESULT* | *969595* | | *REQUIREMENT_RELATIONSHIP* | *851067* | | *REQUIREMENT_LINK_PROP* | *851066* | | *ITEM* | *832101* | | *RDF_STATEMENT_LINK_PROP* | *645587* | | *ARCHITECTURE_ELEMENT_RDF_TYPE* | *522294* | | *TEST_CASE_REQUIREMENT_RELATIONSHIP* | *458191* | | *TEST_RICH_TEXT_SECTION* | *428836* | | *TEST_RICH_TEXT_SECTION_RDF_TYPE* | *428836* | | *ITEM_LINK_PROP* | *427743* | | *TEST_SCRIPT* | *391875* | | *TEST_SCRIPT_RDF_TYPE* | *391875* | | *TEST_CASE* | *390207* | | *TEST_CASE_RDF_TYPE* | *390207* | | *TEST_EXECUTION_SUITE_ELEMENT_LINK_PROP* | *296265* | | *ARCHITECTURE_ELEMENT* | *261147* | | *TEST_RESULT_RDF_TYPE* | *242398* | | *TEST_RESULT* | *242398* | | *WORK_ITEM_REQUIREMENT_RELATIONSHIP* | *201702* | | *REQUIREMENT_RDF_TYPE* | *198532* | | *TEST_SUITE_RESULT_LINK_PROP* | *188803* | | *TEST_CASE_LINK_PROP* | *143323* | | *TEST_SCRIPT_STEP_LINK_PROP* | *120000* | | *REQUIREMENT* | *99266* | | *TEST_EXECUTION_RECORD* | *99134* | | *TEST_EXECUTION_RECORD_RDF_TYPE* | *99134* | | *TEST_EXECUTION_SUITE_ELEMENT_RDF_TYPE* | *98755* | | *TEST_EXECUTION_SUITE_ELEMENT* | *98755* | | *TEST_SCRIPT_LINK_PROP* | *80000* | | *WORK_ITEM_TEST_CASE_RELATIONSHIP* | *79422* | | *TEST_APPROVAL_DESCRIPTOR_APPROVAL* | *59870* | | *TEST_APPROVAL_RDF_TYPE* | *59870* | | *TEST_APPROVAL* | *59870* | | *TEST_SUITE_ELEMENT_LINK_PROP* | *59400* | | *RESOURCE_PROPERTY_LINK_PROP* | *52116* | | *CONFIGURATION_LINK_PROP* | *49922* | | *CONFIGURATION_RDF_TYPE* | *41101* | | *SELECTIONS_RDF_TYPE* | *28123* | | *SELECTIONS_LINK_PROP* | *25602* | | *TEST_SUITE_LINK_PROP* | *25600* | | *ARCHITECTURE_RELATIONSHIP* | *25348* | | *ARCHITECTURE_RELATIONSHIP_LINK_PROP* | *25348* | | *TEST_APPROVAL_DESCRIPTOR_RDF_TYPE* | *20040* | | *TEST_APPROVAL_DESCRIPTOR* | *20040* | | *TEST_QUALITY_APPROVAL_APPROVAL_DESCRIPTOR* | *20040* | | *TEST_PLAN_LINK_PROP* | *19924* | | *TEST_SUITE_ELEMENT* | *19800* | | *TEST_SUITE_ELEMENT_RDF_TYPE* | *19800* | | *CONFIGURATION_NAME* | *19342* | | *CONFIGURATION* | *19321* | | *CONFIGURATION_ACCEPTED_BY* | *19321* | | *CONFIGURATION_SELECTIONS* | *15313* | | *SELECTIONS* | *15313* | | *RESOURCE_PROPERTY_RDF_TYPE* | *15225* | | *RESOURCE_PROPERTY* | *15225* | | *ITEM_STRING_PROP* | *11885* | | *CONFIGURATION_CONTRIBUTION* | *11885* | | *TEST_QUALITY_APPROVAL* | *10020* | | *TEST_QUALITY_APPROVAL_RDF_TYPE* | *10020* | | *RDF_PROPERTY_RDF_TYPE* | *9463* | | *RDF_PROPERTY* | *9413* | | *CONFIGURATION_PREVIOUS_BASELINE* | *8952* | | *CONFIGURATION_BASELINE_OF_STREAM* | *8952* | | *TEST_SUITE_EXECUTION_RECORD_LINK_PROP* | *8123* | | *RESOURCE_SHAPE_PROPERTY* | *7495* | | *CACHED_CONFIG_ALL_CONFIGS* | *6757* | | *TEST_SUITE_RESULT* | *6600* | | *TEST_SUITE_RESULT_RDF_TYPE* | *6600* | | *CONFIGURATION_ACCEPTS* | *4920* | | *CACHED_CONFIG_ALL_SELECTIONS* | *4279* | | *TEST_PLAN_RDF_TYPE* | *4123* | | *TEST_PLAN* | *4123* | | *COMPONENT_RDF_TYPE* | *3936* | | *COMPONENT* | *3936* | | *COMPONENT_LINK_PROP* | *3925* | | *ITEM_RDF_TYPE* | *3779* | | *RDF_PROPERTY_LINK_PROP* | *3467* | | *CONFIGURATION_BOOLEAN_PROP* | *2503* | | *RESOURCE_SHAPE_LINK_PROP* | *2263* | | *CONFIGURATION_COMMITTER* | *1561* | | *RDF_CLASS_LINK_PROP* | *1522* | | *TEST_SUITE_RDF_TYPE* | *1380* | | *TEST_SUITE* | *1380* | | *TEST_SUITE_EXECUTION_RECORD* | *1320* | | *TEST_SUITE_EXECUTION_RECORD_RDF_TYPE* | *1320* | | *CONFIGURATION_DESCRIPTION* | *1290* | | *RDF_CLASS_RDF_TYPE* | *1218* | | *RDF_CLASS* | *1154* | | *TEST_ENVIRONMENT_RDF_TYPE* | *1040* | | *TEST_ENVIRONMENT* | *1040* | | *TEST_ENVIRONMENT_LINK_PROP* | *800* | | *WORK_ITEM_PLAN_LINK_PROP* | *566* | | *TEST_PLATFORM_COVERAGE_LINK_PROP* | *400* | | *RESOURCE_SHAPE_RDF_TYPE* | *360* | | *RESOURCE_SHAPE* | *360* | | *TEST_PHASE* | *330* | | *TEST_PHASE_RDF_TYPE* | *330* | | *TEST_BUILD_RECORD* | *320* | | *TEST_BUILD_RECORD_RDF_TYPE* | *320* | | *TEST_PHASE_LINK_PROP* | *292* | | *TEST_CATEGORY_RDF_TYPE* | *216* | | *TEST_CATEGORY* | *216* | | *TEST_PLATFORM_COVERAGE_RDF_TYPE* | *200* | | *TEST_PLATFORM_COVERAGE* | *200* | | *TEST_BUILD_RECORD_LINK_PROP* | *200* | | *SOURCE_FILE* | *159* | | *SOURCE_FILE_RDF_TYPE* | *159* | | *WORK_ITEM_CATEGORY_LINK_PROP* | *156* | | *WORK_ITEM_PLAN* | *154* | | *WORK_ITEM_PLAN_RDF_TYPE* | *154* | | *TEST_BUILD_DEFINITION_LINK_PROP* | *112* | | *TEST_CATEGORY_LINK_PROP* | *108* | | *WORK_ITEM_DELIVERABLE_RDF_TYPE* | *93* | | *WORK_ITEM_DELIVERABLE_LINK_PROP* | *93* | | *WORK_ITEM_DELIVERABLE* | *93* | | *WORK_ITEM_DELIVERABLE_RELEASE_PREDECESSOR* | *93* | | *WORK_ITEM_CATEGORY_RDF_TYPE* | *92* | | *WORK_ITEM_CATEGORY* | *92* | | *PREFIX* | *55* | | *TEST_BUILD_DEFINITION_RDF_TYPE* | *30* | | *TEST_BUILD_DEFINITION* | *30* | | *ACCESS_CONTEXT_RDF_TYPE* | *26* | | *LQE_INDEXING_ERROR* | *18* | | *LQE_INDEXING_ERROR_LINK_PROP* | *18* | | *TRS_DESCRIPTOR* | *16* | | *TRS_DESCRIPTOR_RDF_TYPE* | *16* | | *TRS_DESCRIPTOR_LINK_PROP* | *16* | | *RESOURCE_GROUP_USER_GROUPS* | *15* | | *RESOURCE_GROUP_RDF_TYPE* | *15* | | *RESOURCE_GROUP* | *15* | | *ACCESS_CONTEXT* | *13* | | *USER_GROUP* | *13* | | *USER_GROUP_RDF_TYPE* | *13* | | *USER_GROUP_NAME* | *12* | | *CACHED_CONFIG* | *12* | | *RESOURCE_GROUP_NAME* | *12* | ---+ References * [[https://jazz.net/wiki/bin/view/Deployment/LQErs703Performance][LQE rs Performance Report]] * [[https://jazz.net/blog/index.php/2023/10/20/whats-new-in-ibm-engineering-reporting-7-0-3-jazz-reporting-service-publishing-engineering-insights/][What's New in IBM Engineering Reporting 7.0.3]] * [[https://jazz.net/blog/index.php/2023/12/06/whats-new-for-ibm-engineering-7-0-3-administrators/][What's new for IBM Engineering 7.0.3 administrators?]] * [[https://jazz.net/wiki/bin/view/Deployment/LQErs703Performance][LQE rs 703 Performance Report]]
Attachments
Attachments
Topic attachments
I
Attachment
Action
Size
Date
Who
Comment
png
Architecture702.png
manage
85.2 K
2024-10-16 - 16:47
VaughnRokosz
png
Architecture71.png
manage
81.4 K
2024-10-16 - 16:52
VaughnRokosz
png
CPU-Db2.png
manage
28.6 K
2024-09-10 - 06:27
SameerkumarKalaria
CPU-Db2
png
CPU-LDXrs.png
manage
28.9 K
2024-10-04 - 14:57
VaughnRokosz
png
CPU-Oracle.png
manage
29.8 K
2024-09-10 - 05:57
SameerkumarKalaria
CPU-Oracle
png
CPUAndThroughput1.png
manage
85.6 K
2024-08-07 - 16:52
SameerkumarKalaria
SingleUserTestChart1
png
CPUTopology2.png
manage
28.2 K
2024-10-02 - 19:11
VaughnRokosz
png
DB2Resp10M.png
manage
22.3 K
2024-10-03 - 19:26
VaughnRokosz
png
DiskIO-Db2.png
manage
27.7 K
2024-09-10 - 06:27
SameerkumarKalaria
DiskIO
-Db2
png
DiskIO-LDXrs.png
manage
70.9 K
2024-09-19 - 15:19
SameerkumarKalaria
DiskIO
-LDXrs
png
DiskIO-Oracle.png
manage
28.6 K
2024-09-10 - 05:58
SameerkumarKalaria
DiskIO
-Oracle
png
FixedUserAndVaryGCSize1.png
manage
165.5 K
2024-08-07 - 16:54
SameerkumarKalaria
FixedUserAndVaryGCSize1
png
GCComponent.png
manage
340.3 K
2024-09-26 - 09:40
SameerkumarKalaria
GCComponent
png
GCImpactResponsetime-Db2.png
manage
113.9 K
2024-09-30 - 16:55
SameerkumarKalaria
GCImpactResponsetime
-Db2
png
GCImpactThroughput-Db2.png
manage
56.5 K
2024-09-13 - 10:46
SameerkumarKalaria
GCImpactThroughput
-Db2
png
GcSizeImpactOnThroughputAndResponseTime1.png
manage
667.7 K
2024-08-07 - 16:55
SameerkumarKalaria
GcSizeImpactOnThroughputAndResponseTime1
png
RespTopology2.png
manage
25.9 K
2024-10-02 - 19:11
VaughnRokosz
png
ResponseTime-Db2.png
manage
28.5 K
2024-09-10 - 06:27
SameerkumarKalaria
ResponseTime
-Db2
png
ResponseTime-LDXrs.png
manage
137.4 K
2024-09-19 - 15:19
SameerkumarKalaria
ResponseTime
-LDXrs
png
ResponseTime-Oracle.png
manage
28.0 K
2024-09-10 - 05:57
SameerkumarKalaria
ResponseTime
-Oracle
png
SQLRate-LDXrs.png
manage
76.3 K
2024-09-19 - 15:19
SameerkumarKalaria
SQLRate-LDXrs
png
SQLRate-Oracle.png
manage
29.6 K
2024-09-10 - 06:30
SameerkumarKalaria
SQLRate-Oracle
png
SingleThreadChart.png
manage
37.4 K
2024-10-02 - 18:14
VaughnRokosz
SingleThreadChart
png
SingleThreadTestData.png
manage
79.1 K
2024-09-16 - 04:57
SameerkumarKalaria
SingleThreadTestData
png
SingleUserTestChart1.png
manage
68.1 K
2024-08-07 - 16:53
SameerkumarKalaria
SingleUserTestChart1
png
SingleUserTestData.png
manage
26.2 K
2024-08-02 - 10:42
SameerkumarKalaria
SingleUserTestData
png
Throughput-Db2.png
manage
21.0 K
2024-09-10 - 06:26
SameerkumarKalaria
Throughput-Db2
png
Throughput-LDXrs.png
manage
25.7 K
2024-10-03 - 17:56
VaughnRokosz
png
Throughput-Oracle.png
manage
26.9 K
2024-09-10 - 05:52
SameerkumarKalaria
Throughput-Oracle
png
ThroughputTopology2.png
manage
25.9 K
2024-10-02 - 19:11
VaughnRokosz
png
VaryUserLoadAcrossAllGC1.png
manage
381.5 K
2024-08-07 - 16:54
SameerkumarKalaria
VaryUserLoadAcrossAllGC1
This topic: Deployment
>
WebHome
>
DeploymentPlanningAndDesign
>
PerformanceDatasheetsAndSizingGuidelines
>
LDXrs710Performance
History: r41 - 2024-10-16 - 16:58:03 -
VaughnRokosz
Copyright © by IBM and non-IBM contributing authors. All material on this collaboration platform is the property of the contributing authors.
Contributions are governed by our
Terms of Use.
Please read the following
disclaimer
.
Dashboards and work items are no longer publicly available, so some links may be invalid. We now provide similar information through other means. Learn more
here
.

