Rational Design Manager performance and scalability
Introduction
Performance and scalability are paramount in any multi-users client-server application. As many users access, often remotely, the application, providing good response times as well as being able to handle the load is one of the key factors on making a client-server application successful.
Rational Design Manager (DM) application is a client-server application allowing users to manages and collaborate around design resources using a web browser or one of its rich clients.
Starting with DM 4.0.4 a special emphasis has been put into tracking and improving the performance of the application, particularly on the server side, and the rest of this article describes the current scalability limitations in terms of concurrent users and size of the model data. This is only the first step in our journey to improve DM performances and stay tuned in the upcoming releases for more performance improvements.
Summary
This article describes the recommended scalability in terms of concurrent users and size of model data.
- DM 4.0.4 supports up to 100 concurrent users load (average 1 operation/min) working on a 110 MB model size. Performance is expected to be reasonable in such an environment.
- Because the DM Server CPU utilization is the main bottle neck, increasing the number of CPUs on the servers may help DM handle a scaled user load or model size.
- To maximize DM performance, refer to the performance tuning tips at the end of this article. Generally, you can size the hardware and network according to the expected number of concurrent users, increase the size of the thread pool used by the server’s web application container from the default, and set the size of the heap that the JVM uses appropriately.
Overview of the Design Manager architecture
The DM server is a set of JavaEE applications, each of them contributing to the overall DM features. Figure 1 provides an overview of the main DM parts as well as DM rich clients.
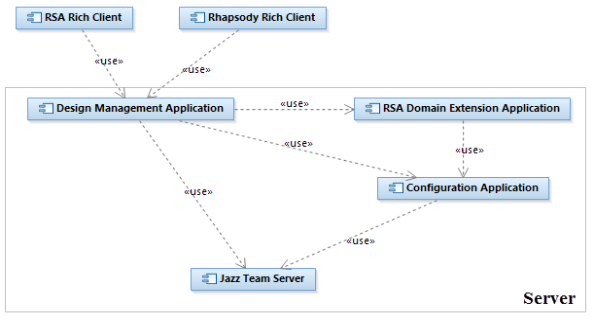
- Jazz Team Server: provides common services to the Jazz applications, like project area management, or user management and authentication.
- Configuration Application: Provides version and configuration management for Jazz applications.
- Design Management Application: The core of Design Manager server. Provides design, collaboration (reviewing and commenting) as well as Domain modeling capabilities.
- RSA Domain Extension Application: Used to create, edit and delete Rational Software Architect (RSA) based resources.
- RSA Rich Client: Extension allowing RSA integration with DM. It provides editing and collaborative capabilities directly into RSA.
- Rhapsody Rich Client: Rich client allowing Rhapsody users to interact with DM.
Performance test environment overview
The tests are usually run during one hour and a half with a frequency of one operation per user per minute.
As the tests are performed at the DM server services level, results are applicable to RSA DM as well as Rhapsody DM.
Performance test topology
As shown in figure 2, a three-tier topology has been used, with two application servers running Tomcat 7.0 and one database server running DB2 9.7. The Jazz Team Server (JTS) has been deployed on a different server than the Design Management, RSA Domain Extension and Configuration applications. This allows a better scalability when integrating different Jazz-based applications as each of them could be deployed on a different server allowing a better separation as well as maximizing the hardware resources usage. As we will see in the performance tip section, this topology increases the network usage making the overall performance more dependent on the network latency.
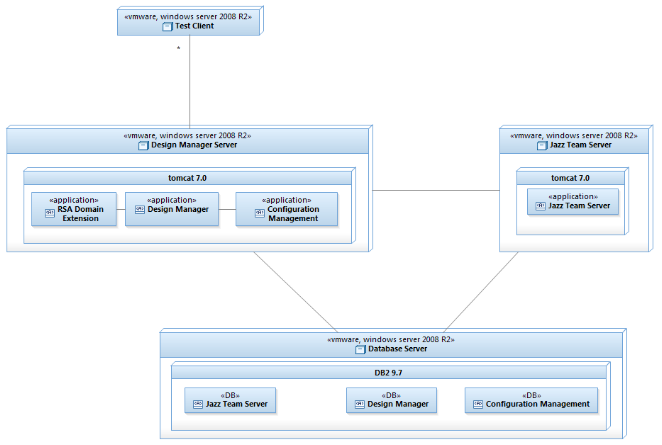
The test clients are all built on the same model and used to run up to 50 concurrent users. Users are scaled up by adding new test clients to avoid exhausting the hardware resources of the test clients that will lead to erroneous performance results.
All the machines (test clients and servers) used are VMWare virtual machines with the specifications shown in figure 3.
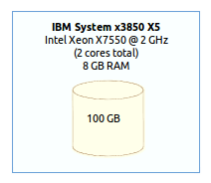
Figure 3 – Machines specification
Workload model
The DM performance tests are performed using a custom-made automated performance testing framework capable of simulating an arbitrary number of users interacting with a DM server over an arbitrary period of time. Each user executing a configurable mix of user-level operations (use case scenarios). The framework drives the tests and records the response time of every user-level operation invoked during the test run.
The list below provides an overview of the scenarios used in the performance tests, grouped in two categories, read and write scenarios.
- Read Scenarios:
- Open a UML Diagram: This scenario simulates a user opening a UML diagram
- Expand a node in the explorer: This scenario involves fetching the children for one of the root nodes in the performance test model data.
- Open a resource: This scenario simulates a user opening a resources in the resource editor.
- Search a resource: This scenario simulates a user making a keyword search in all models and in all project areas.
- Search a diagram: This scenario simulates a user making a keyword search in all diagrams.
- Rich Client Scenarios:
- Expand a node in the explorer: This scenario simulates one of the rich clients fetching the children for one of the root nodes.
- Open properties for a UML resource: This scenario simulates one of the rich clients opening the properties for a resource.
- OSLC Get: This scenario simulates the OSLC querying for changed UML resources.
- Write Scenarios
- Create a resource: This scenario simulates a user creating an ontology.
- Save a resource: This scenario simulates a user updating the title of an ontology resource.
- Create a comment: This scenario simulates the creation of a text comment on a resource.
- Lock a resource: This scenario simulates the locking of a resource.
- Unlock a resource: This scenario simulates the unlocking of a previously locked resource.
Table 1 shows the scenarios distribution in the workload mix used during the performance tests. The workload used is a 60% reads for 40% writes that matches the common usage pattern where DM is used for editing resources as well as for resources collaboration.
Table 1 – Workload scenarios distribution
Scenarios | Distribution |
Read Scenarios | 60% |
Open a UML diagram Expand a node in the explorer Open a resource Search a resource Search a diagram Rich Client – Expand a node in the explorer Rich Client – Open properties for a resource OSLC Get | 5% 9% 6% 8% 5% 9% 5% 13% |
Write Scenarios | 40% |
Create a resource Save a resource Create a comment Lock a resource Unlock a resource | 10% 11% 13% 3% 3% |
Scalability
Users scalability
The first scalability tests we ran was to identify the number of concurrent users DM could handle before the performance started to degradate significantly. The tests were performed with 50, 100 and 150 users on a project with 100MB of design data, which represents about 25,000 resources and about 800,000 elements once imported in DM.
The graph in figure 4 clearly shows that the tipping point, for our test environment and with a user transaction per minute, seems to be around 100 concurrent. Changing the test environment of the user transaction frequency would have an effect on the number of concurrent users. For example, running the same test with a scenario frequency of one transaction every three minutes, resulted on the application being able to handle at least 200 concurrent users.
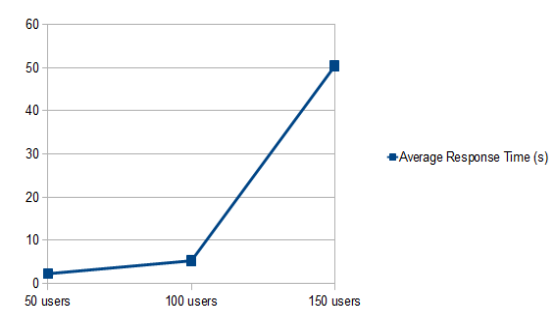
Figure 4 – Average response time when increasing the concurrent users
Looking at the resources utilization of the different servers during the 150 users tests, the only notable resource consumption was the the CPU utilization as shown in figure 5. This seem to point to the DM Server CPU as the bottleneck resource on the test. Increasing the number of CPU cores on the server could help DM handle a load superior to 100 concurrent users we were able to handle in our tests.
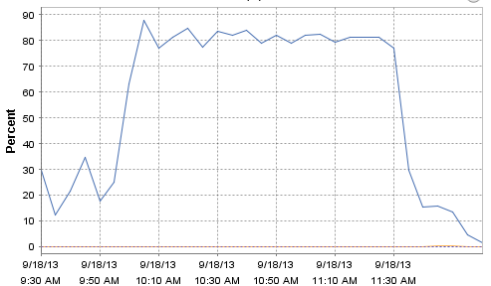
Figure 5 – DM server CPU utilization for the 150 users test
Workspace scalability
To identify the maximum model data size that DM can handle before the performance started to decrease significantly, we imported 3 different Rational Software Architect workspaces into Design Manager and run the tests using the resources generated by the import. The workspaces were containing respectively 63 MB, 110 MB and 230 MB of model data. Table 2 shows the resulting number of resources and elements in the Design Manager project area for each workspace.
Table 2: Number of resources and elements by size of workspace
Workspace size on disk (MB) | # Resources after import | # Elements after import |
63 | 14,000 | 450,000 |
110 | 25,000 | 800,000 |
230 | 59,000 | 1,400,000 |
The graph in figure 6, shows that the point of inflexion seems to be around 110 MB, as with 230 MB the average response time has more than doubled. As for the scalability test, this result is valid for our test environment and our user transaction frequency. Changing any of them could have an impact on the model data size that DM would be able to handle.
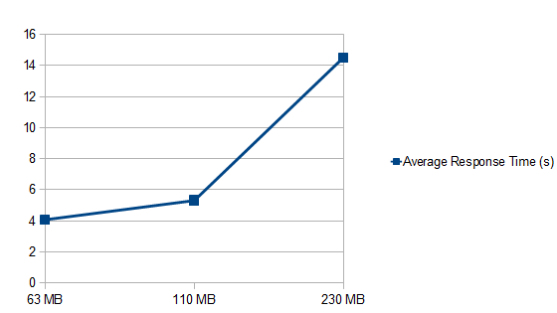
Figure 6 – Average response time when increasing the size of the workspace
In particular, it seems that the DM server CPU utilization is again the main bottleneck during the tests on the 230 MB workspace (see figure 7). Again, increasing the number of CPU cores could allow DM to handle more than the 110 MB of design data seen in our tests.
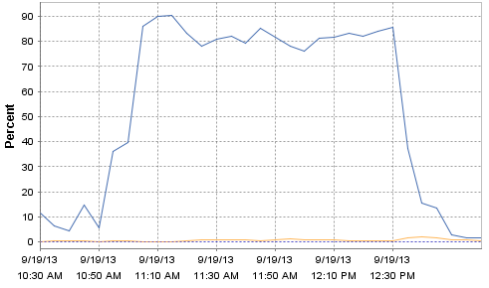
Figure 7 – CPU utilization for the 230MB test
Performance tuning tips
As a conclusion to this article here are some performance tuning tips that would help you maximize the performance of DM.
The performance tuning considerations for Design Manager are similar to those for other Jazz-based applications, in particular:
- Size your hardware and network accordingly to the number of concurrent users you are expecting.
- Increase the size of the thread pool used by the server's web application container from the default.
- Set the size of the heap the JVM uses appropriately.
Hardware sizing
To maximize DM performances use a 64-bit architecture with at least 2 CPU cores, and at least 6 GB RAM. As noted above, the main resource contention observed during the tests in the DM server is the CPU cores, so increasing the number of CPU cores of the DM Server should help increase the number of concurrent users and the size of the model data that DM can handle.
Network connectivity
In the test topology described previously, the DM application, the JTS application and the database were installed in different machines. This allows to increase the CPU, memory and disk available for each application, but in return it puts more pressure on the network connectivity, especially the network latency. To mitigate this, it is recommended to locate the three servers on the same subnet.
Thread pool size
The size of the thread pool used by the DM server's web application container should be at least 2.5 times the expected active user load. For example, if you expect to have 100 concurrently active users, like in the tests described above, set the thread pool size to at least 250 for both the DM Server and the JTS server.
JVM heap size
It is recommended to set the maximum JVM heap size to at least 6 GB. However, you can only do that if the server has at least 8 GB of RAM. As a rule of thumb, avoid setting the maximum JVM heap size to more than about 70-80% of the amount of RAM in the server has or you may experience poor performance due to thrashing.
If you are running Tomcat, you will need to edit the server-startup script to change the default values of -Xms and -Xmx to the desired value (6GB or more). Set both parameters to the same value to avoid the overhead of dynamic Java Virtual Machine (JVM) heap management. You will need to stop and restart the server for the changes to take effect.
If you are running Websphere Application Server (WAS), see the "Java virtual machine settings" section in the WAS information center for instructions specific to your WAS deployment.
Sources
About the author
Celso Gonzalez is a senior developer in the Design Management development team. He was responsible for the Review and Comments features before taking the lead on the DM effort to improve Design Manager performances. Celso can be contacted at cgonzale@ca.ibm.com.
Copyright © 2013 IBM Corporation