Velocity - hours in additional to points
4 answers
Can you please explain why you would want to base velocity on hours. Are you seeking to use ideal hours instead of Story points for your estimation? It will be difficult to respond with a proper answer until we understand the problem you are trying to solve and why you believe it should be solved using hours vs. Story points for the Velocity chart.
Velocity is method for measuring the rate at which scrum development teams consistently deliver business value. To calculate velocity, simply add up the estimates of the user stories delivered in an iteration (sprint), whether that is points, ideal days or whatever the unit of measure. A velocity chart shows the sum of estimates of the work (Stories) delivered across all iterations. Incomplete or partially done Stories are not counted in the calculation.
Velocity usually stabilizes over time unless the team composition varies widely or the length of the sprint changes. Velocity can be used for future planning purposes to help determine how much work the team can deliver each Sprint. If our velocity last Sprint was 20 points (or 20 ideal hours), then we should be able to do about the same for the next Sprint.
I look forward to understanding the problem you are trying to solve and to help brainstorm how we can help you.
I am always concerned any time someone tries to map the relationship between story points and hours.
The biggest problem I have is that once this relationship is defined, teams tend to go out of our way to “prove” the relationship or change the size of each story. It doesn’t allow for the relationship to change - which is should.
If a team gets faster at delivering specific types of stories the story size shouldn’t change - but the relationship between the size and duration will. Alternatively, if half a team goes out on vacation, and those that remained who worked on a 5 point story realized it took them twice as long as a 5-point story usually would. This does not mean that the story size was really twice as big as what was sized. Assuming that the story is similar in size to other 5-point stories in the backlog, then the size is still good. Because the the team’s velocity is different, the time it takes to complete the 5 point story will be different. It is still a 5 point story.
What is the business reason for wanting to compare story points to hours? Perhaps there is a better solution for achieving your goal.
I am not trying to map a relationship between points and "time spent".
This is one additional tool for management purpose. can be achieved using queries but I rather have it as a chart.
For sure this should not replace the velocity chart.
Comments
hi, Yaron,
I have the totally same question with you - Given the management concern, I want to have a chart where I can see all time spent(for those done & resolved ) in a certain sprint and all story point , do you have any way to solve this?
Thank you.
Hi Candy,

Hi, Clement,
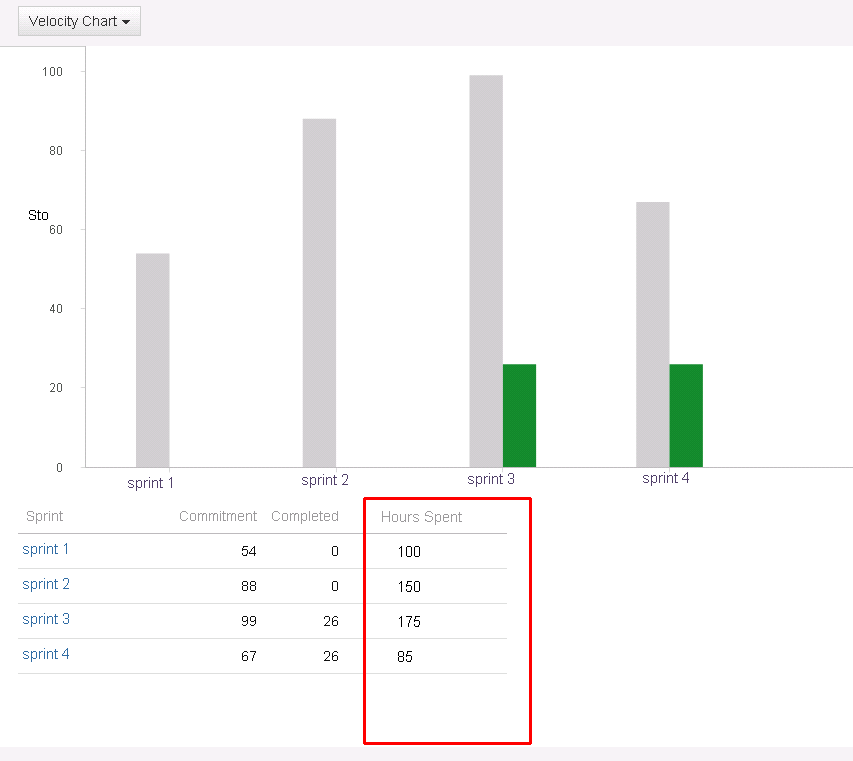
Thank you for your comments, but I'm afraid I didn't make my question clear, below is what I want - I want to have a new column with name Hours Spent in velocity chart, this field is the sum of all logged hours in a certain sprint(not all estimation hours).
Then as a manager, he could see not only how many story points are completed in each sprint , but also how many actual hours are spent. Do you have idea for this? Or do you have any way to have both story points and logged hours information for a certain sprint in one chart?
Thank you in advance!

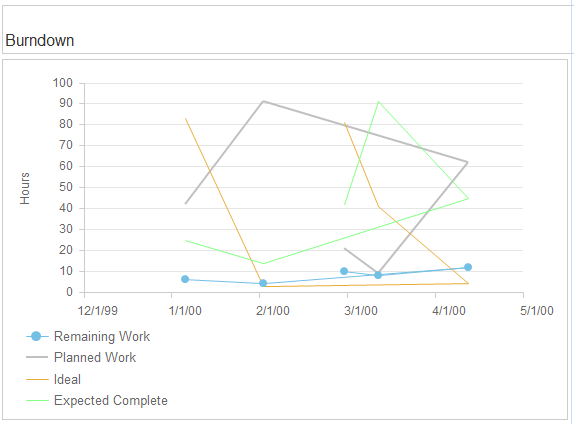
Yes, basically you need to modify this velocity report to add the hours. Are you familiar with BIRT? You can use the burndown template I mentioned in my previous comment to learn how to get hours info.
Oh, Clement, I know what you mean now, I'll give it a try to, thank you very much!