| Description | |
|---|---|
| Report Builder |
Reporting on link validity Previously, the only way that you could report on link validity was by manually editing the SPARQL code generated by Report Builder. Now, you can use the Report Builder guided interface to build reports about link validity. Existing reports still work as before, and the Link validity for relationships for those reports will be set to Ignore. You can modify the Link validity for such relationships on such reports to Optional, Required, or Does Not Exist to report on link validity. For example, you might build reports that include the following link validity information:
You can add the related columns and set conditions on link validity properties such as status, who last modified the status, and the last time the link was changed. Image of a traceability relationship for ETM test cases that validate requirements:  Image of optionally reporting on link validity for ETM test cases that validate requirements: 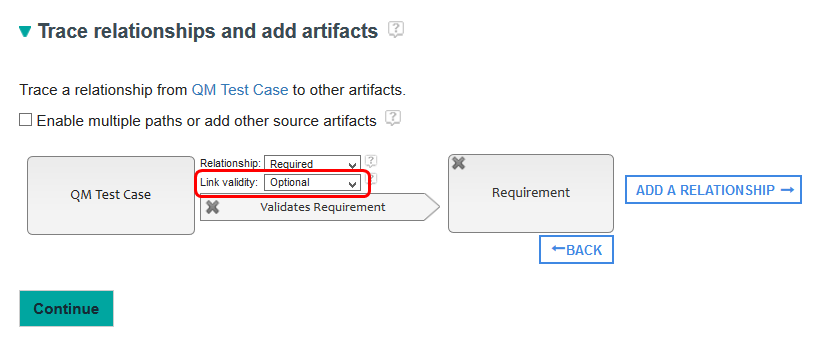 Image of the link validity properties you can report on:  Image of adding the Status column to the report:  Image of setting a link validity condition: 
|
|
Run Report Builder against the types from a user-specified set of Global Configurations Reporting takes types from across multiple projects, domains, and servers and utilizes a merging approach that helps to provide a concise view of the IBM Engineering Lifecycle Management (ELM) type system. This is referred to as the metamodel that is used in Report Builder for a particular data source connection (LQE, LQE scoped by a configuration, and Data warehouse have 3 corresponding metamodels). This allows reusable reports to be created and shared across the enterprise. The goals of the reporting type system require that an organization plans and communicates amongst their stakeholders what they want to see in their type system so that concepts that can be shared across project areas are set up appropriately. There are situations in which one consistent metamodel is not possible, for example:
To create a new Report Builder data source scoped by a configuration, an RB administrator:
 2. Clicks the Create a data source for a configuration. 3. Selects a configuration, typically a global configuration as shown below: Image of the configuration picker: 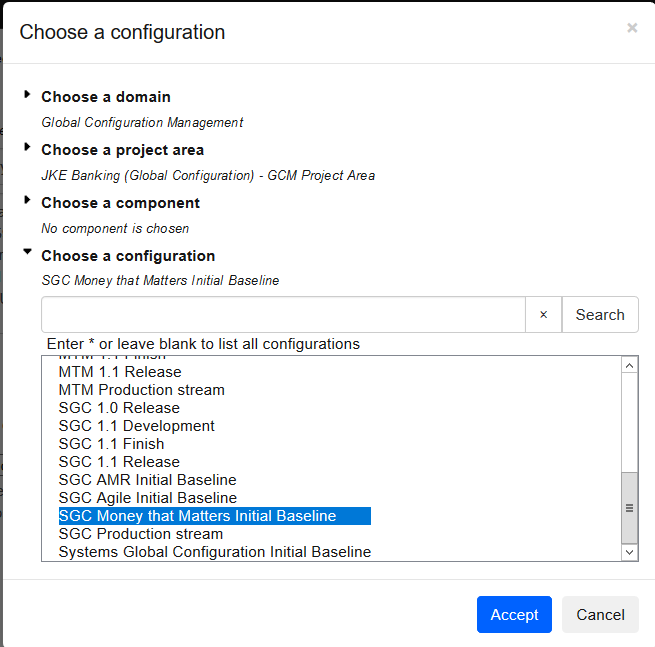 4. Verifies the details for the proposed new data source and clicks Save as shown below. Image of the data source details:  RB administrators can change the configuration for the data source by clicking Choose configuration as shown below. In doing so, the RB administrator must take care to select a configuration that is related to the current configuration with compatible DOORS Next types. Image of choosing the configuration and the Archive button : 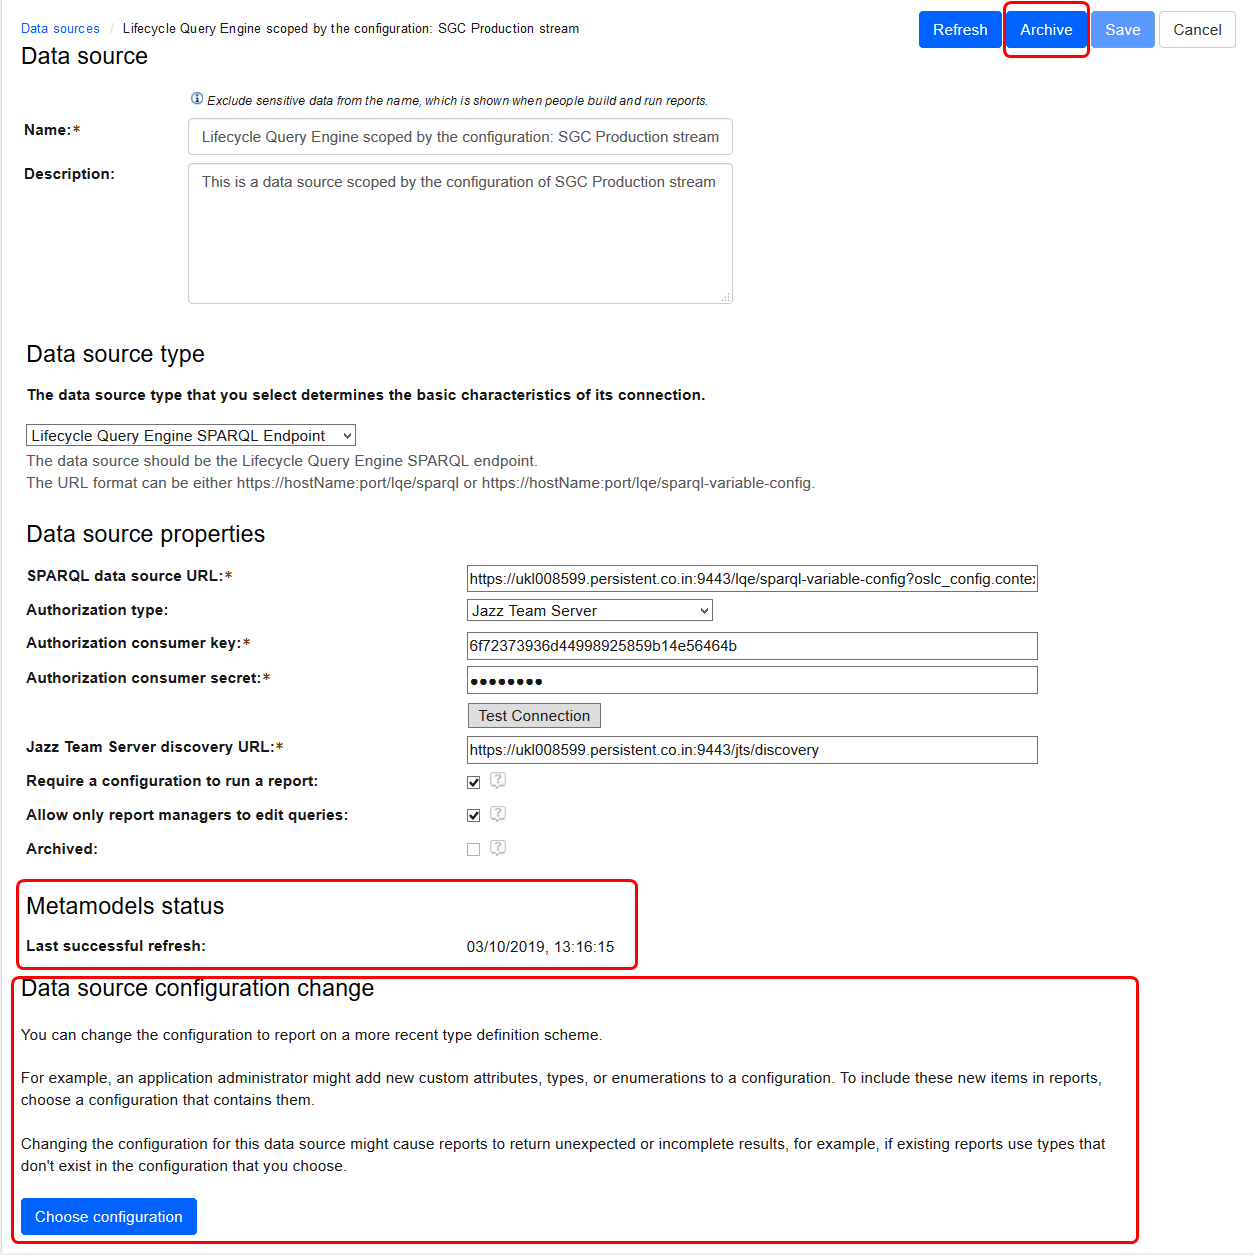 Currently the only ELM application that has a versioned type system is DOORS Next. Typically, you use a Global Configuration that has contributions from at least one DOORS Next configuration. When creating the new RB data source as above, RB will create metadata scoped to the specified configuration, only including type information from DOORS Next that belongs to the DOORS Next configurations that contribute to the global configuration. Note that creating such additional RB data sources consumes more memory on the RB server, and the server might need additional resources to perform well. RB administrators can archive data sources, such as configuration scoped ones, by clicking on Archive as shown in the image above. Before doing so, the RB administrator should ensure that reports for that data source are not in active use in dashboards or run frequently by users. Such reports cannot be modified or run if the associated data source is archived. Archiving a data source means that the RB server does not need to hold the metadata for that data source in memory. Users who have reporting requirements to reproduce old reports can Restore an archived data source. Configuration scoped data sources are not automatically refreshed. An RB administrator must manually refresh a configuration scoped data source. If the data uses a global baseline, then a refresh should never be needed. The page for a specific data source now includes a Metamodels status section that shows when the meta data for that data source was last refreshed. The above image shows an example where the last refresh was successful. Image of an example with simulated errors:  The Data sources page includes a new Show archived data sources check box which is cleared by default, and the page only lists data sources that are not archived. Setting that check box shows all data sources and a column for the archived state of each data source as shown below. Image of the Show archived data sources check box: 
|
|
|
Calculate custom column values from multiple attributes You can now calculate a custom column value on more than one attribute. For example, you can add a column to show the number of days it took to resolve a work item from its creation date. Or you can add a column that combines the defect ID and title columns. In the Add a custom expression window, choose attributes one by one from the list and then click the > button to move the attribute into the Custom Expression editing area to continue working with the expression. Image of adding a column that combines the defect ID and title columns for a LQE report: 
|
|
|
Folder enhancements: Drag and drop reports or folders and selecting all reports or folders Drag and drop reports or folders from one folder to another You can now drag and drop folders and reports from one location to another folder, in order to organize and move them with less effort. To drag and drop a report or folder to the desired target:
Image of the drag handle beside a report: 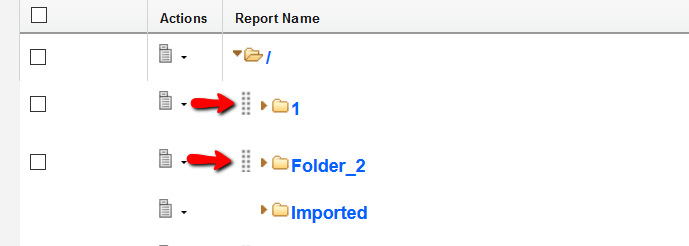 Select all reports or folders For folders that contain reports or other folders, you can now select all of the reports or folders in the parent folder. When you select an existing check box for a folder, the folder is selected and all the nodes beneath that folder are expanded and selected. If you then click the check box of the parent folder, only the check box of the parent checkbox is cleared and the child folders are still selected. If any child folder check boxes are cleared, the check box for its parent folders are cleared. If you expand a folder after it is selected, the expanded child folders are also selected. Image of a parent folder selected along with its child folders: 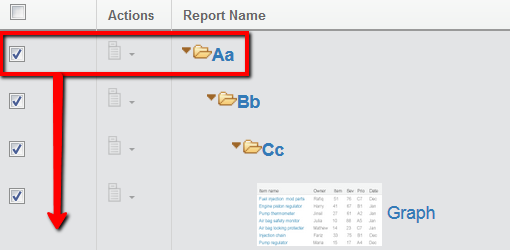
|
|
|
Validate reports before generation You can now validate existing reports before running them. If the artifact types and properties in a data source change over time, you can validate the reports associated with the data source. The validation determines if the artifact types and properties are still available. You can easily see which reports might be using changed data types and, in turn, make corrections. A green check mark means the report is valid. Select the reports to check and click Validate. Image of a validated report:  |
|
|
Archiving and restoring data sources Over time, you might create many data sources for specific configurations so that teams can generate consistent reports based on the type systems of those configurations. You can archive the data sources that teams no longer use or restore archived data sources later. If you restore a configuration-scoped data source, you must manually refresh the metamodel. Image of the Archive button on the Data Sources page: 
|
|
|
Choose a function when creating a custom expression When you create a report using an LQE data source, you might want to use different kinds of custom expressions based on the attributes that you choose. For example, if you choose attributes of Closed Date and Creation Date, you might want to know the length of time between these two dates. You can now open the Custom Expression window and choose the dateDiff function, and then generate and insert the custom expression into the query automatically. This feature is an improvement on the existing custom expression capability. Previously, when you opened the Add or Edit Custom Expression window, only the attributes were shown and you had to manually write the functions inside the Custom Expression field. Now, a new Choose Function list is added with frequently used functions to help you choose the functions quickly without worrying about the syntax of the query language. To find this new capability, when you are building an LQE report, in the Format Results page, click Custom Expression to see the new Choose Function list. Image of the new Choose Function list: 
|
|
|
Configuration picker enhancements Report Builder now includes a newly redesigned configuration picker that scales and performs much better than the previous picker. Using the new picker you can search for configurations instead of loading all the configurations at once. The search is run by LQE. Image of the new configuration picker: 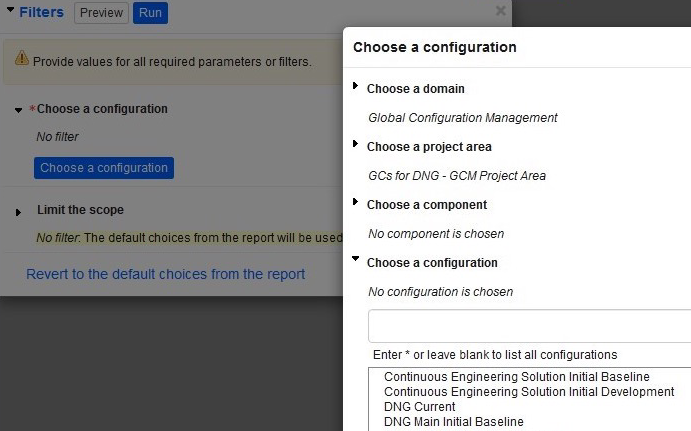
|
|
|
Configuration-scoped reports now display selected configuration in the report header There is now a link in the header of a configuration-scoped report that indicates the selected configuration name. You can click the link to view the configuration details in a new tab. This link displays the configurations used to run the report either in a dashboard widget or in Report Builder. Image of the configuration link in the report header: 
|
|
|
Dynamic date filtering by future dates Previously, when you wanted to filter by dates, you could only filter by days ago, months ago, and years ago. For example, if you wanted to write a report on how many work items are due in the next 3 days, you had to set a static date to count from, and that date had to be changed every time you run the report. Now you can also filter by days later, months later, and years later. So if you want a report on how many work items are due in the next 3 days, you can set the filter to "before 3 days later". This future date is changed dynamically every day, so you no longer have to set a manual date every time you run the report. Image of the new date filter: 
|
|
|
Choose the paper size for Microsoft Word/PDF output When you export a report to Word or PDF, you can now choose either Letter or A4 paper size. Image of Letter size selected for Word output: 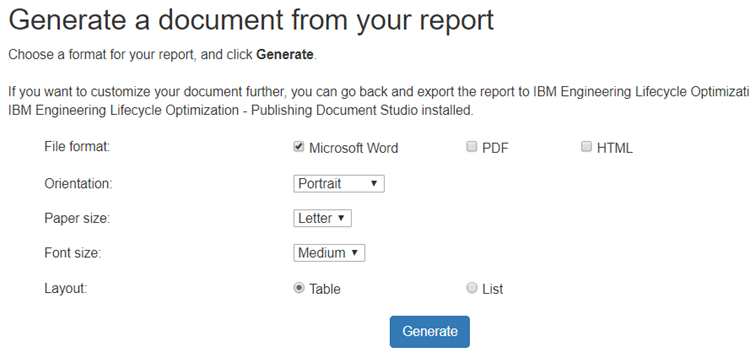 Image of A4 size selected for Word output:  Image of generated document in A4 paper size: 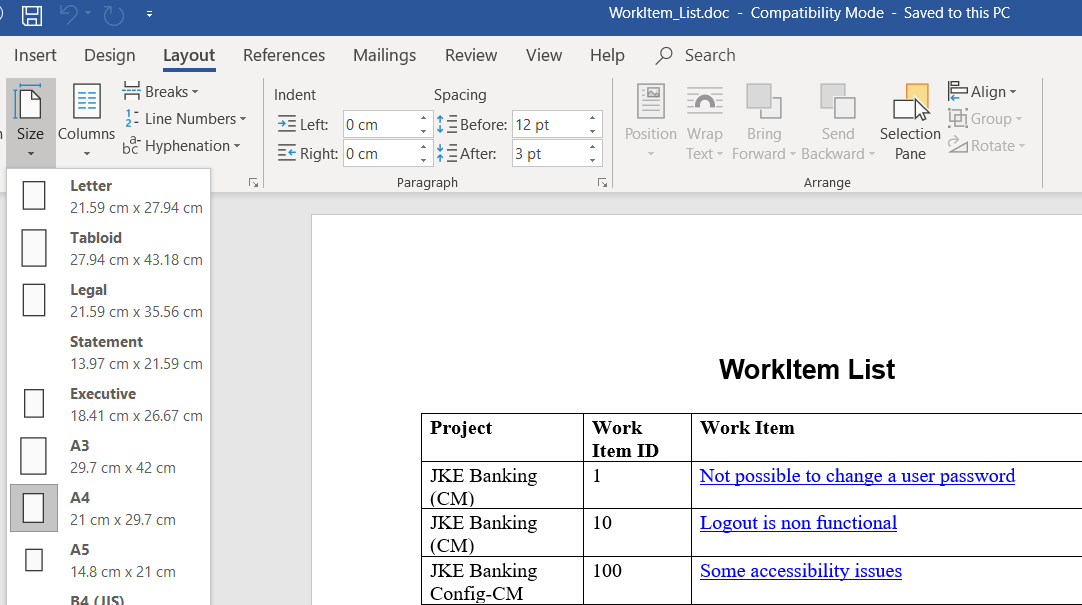 You can also set the paper size when scheduling a report export. Image of the paper size settings on the Schedule Report page: 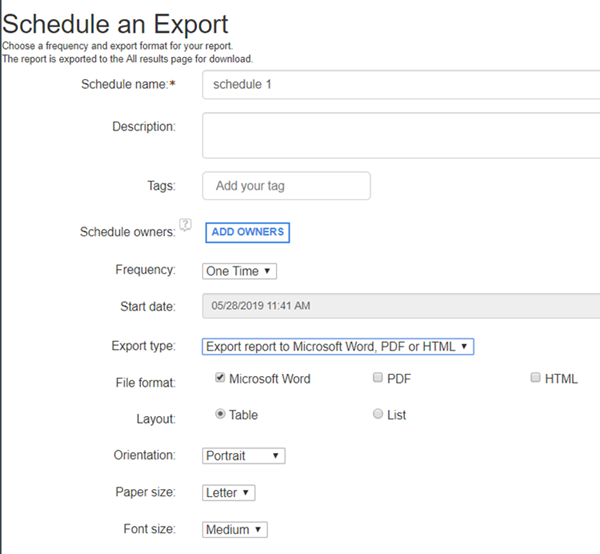 |
|
|
New default export limits for Excel You can set a limit for the number of query records you want to export into Microsoft Excel. By default, you can export up to a maximum of 20,000 records. Previously, the maximum was 5,000 records. To modify the default limit, add the query.results.excel.limit property to the JRS_install_dir\server\conf\rs\app.properties file and set a value to define the limit. Save your changes and restart the server. Setting the property's value to -1 exports all the records. Considerations for upgrading from 6.0.6.1 1. In 6.0.6.1, if you set the query.results.excel.limit property to a certain value, after you upgrade to 7.0, this setting is preserved and the value will continue to be valid in 7.0. 2. In 6.0.6.1, if you did not set this property, the number of records exported is 5,000. After the upgrade to 7.0, since no value is set, the number of records exported is the default of 20,000. |
|
|
Adjust the column width in report results Previously, to adjust column widths for Report Builder reports, you had to edit the report and make permanent changes in the Format Results section. Now, you can adjust the column width in the report results. At the edge of the column, click and drag the double-headed arrow. Image of the icon to adjust column widths: 
|
|
| Lifecycle Query Engine |
Create LQE validation schedules You can now schedule LQE validation activities on a regular basis. The scheduling works similar to backup and compaction scheduling, however the validation schedule is configured per TRS data source. To create LQE validation schedules:
Image of a data source with unscheduled validation:  Image of a validation schedule: 
|
|
Monitor query metrics You can now view and configure Lifecycle Query Engine (LQE) query load and metrics information. LQE looks at every query that was completed since the last load check. Based on the timeout configured for each query, LQE looks at the total execution time compared to the timeout to determine if the query ran too long. LQE will also total the number of queries that ran past the timeout compared to the total number of queries requested within the check interval. If the percentage of timeout queries exceeds a threshold then query load performance for that interval is considered to be warning or critical. On the SPARQL Service LQE Administration page, you can configure the following values in the Timeout Monitoring section:
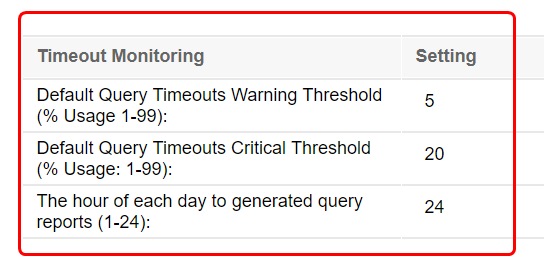 You can view the following query metrics on the Partition Performance page in the Health Monitoring section:
Notifications On the LQE Administration page, you can configure LQE to email a summary of the query load performance for the previous day. In the SPARQL Service section, in The hour of each day to generate query reports field, specify when to send the summary. Then, in the Notifications section, select the Load Monitoring events check box. You can also view load monitoring information on the LQE home page and in the maintenance RSS feed. |
|
|
New REST API for initiating TRS validation A new REST API is available so that TRS provider side validation or repair can be scripted. The response from invoking the validation includes a key to identify the request so that a summary can be periodically polled for. Documentation for this API is now available on any Jazz server under <application>/doc/scenarios. For example, for the Global Configuration application, you can see the API documentation under https://jazz.net/gc/doc/scenarios. See the TRS Validation API section. |
|
| Installation |
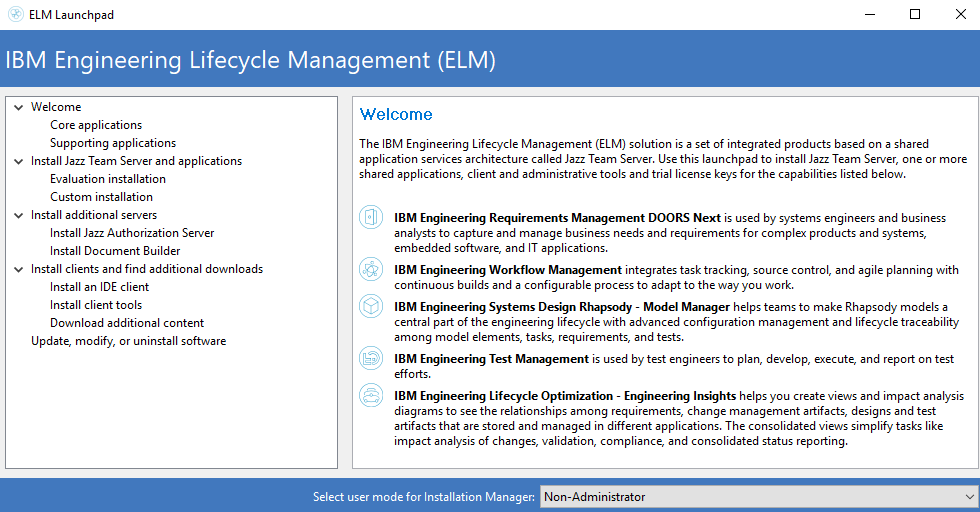
ELM launchpad reorganized
The ELM launchpad has been reorganized as follows:
|
| General |
New look for product and component banners The product banners for IBM Engineering Lifecycle Management (ELM) products and components are updated to align with IBM's open-source Carbon design theme. This modern theme provides a consistent look across IBM products. The login window is also updated, but still works the same way. If you extend the UI in ELM applications, learn more about the Carbon guidelines at https://www.carbondesignsystem.com. Summary of changes for Report Builder: The All Reports and My Reports pages are now tabs on the Reports page. Access the build page by clicking Build report on the Reports page. The schedules are moved from the All Reports or My Reports page to a new Schedules page. The results are moved from the All Reports or My Reports page to a new Results page. Image of the product banner for Report Builder:  Image of the product banner for LQE:  Image of the login window: 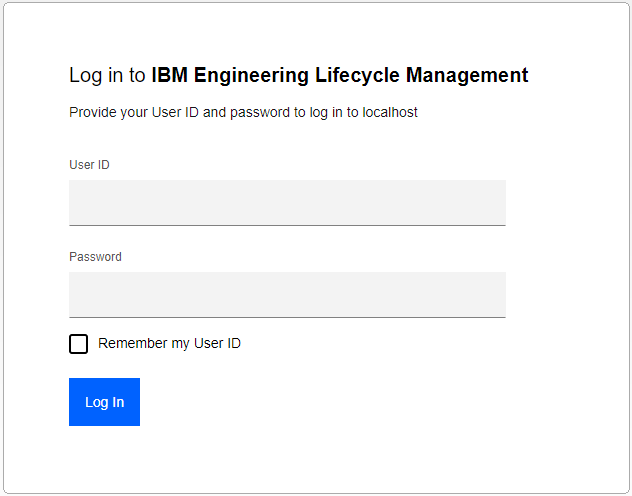 |
| Dashboards and work items are no longer publicly available, so some links may be invalid. We now provide similar information through other means. Learn more here. |