Define Aggregate Rules for Semi-Additive Measures in Framework Manager
Introduction
This document describes how to customize the IBM Rational Insight framework model to show the actual total of workitems in a repository by day, week and month (a workitem could be a defect, enhancement request or other). In this example, we are using the Insight 1.1 release.
Scenario
In this exercise, the metrics team needs to create a report (named “Total Workitems Trend”) that shows a trend of how many total workitems were in their repository, over time, by day, week and month. In their sample repository, they have 81 workitems. That has not changed for the month of February, so the total amount should be 81 workitems (or as labeled in the framework, “Requests”).
In IBM Cognos Report Studio, utilizing the REQUEST METRICS data mart, they selected “Total Requests” as the default measure and the “Date” dimension as the Category (x-axis).
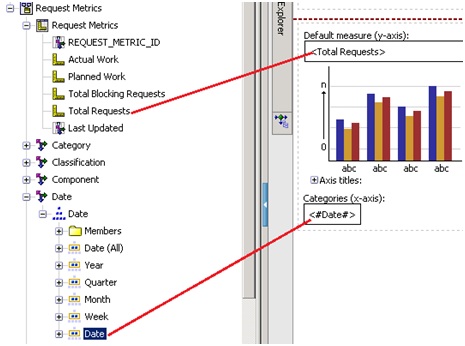
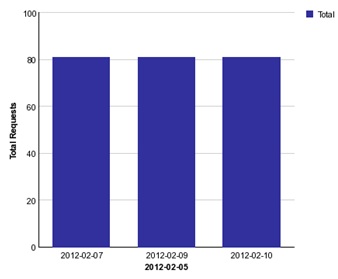
When utilizing the “Date” level (by day) of the Date dimension, correct results are returned (81 workitems each day).
However, when utilizing the “Week” level, incorrect results are returned (243 for the first week, 567 for second week and 324 for third week).

What is happening is the “Total Requests” measure is aggregating the results (81 workitems) for each time the ETL was run that week. So based on the data results, we ran the ETL 3 times the first week, 7 times the second week, and 4 times the third week.
To resolve this, they need to define an aggregate rule for the semi-additive measure “Total Requests”. A semi-additive measure is a measure that is to be summed for some dimensions, but should not be summed across some other dimensions. For the dimensions over which the measure is not additive, a different aggregation rule must be specified.
In our exercise, we define a rule to dictate how the “Total Requests” measure would be aggregated with respect to the “Date” dimension. The aggregate rule would generate the “LAST” total of workitems (Requests) for any given period of time. So for the “Week” total, we would view the total number of workitems for the last day before the week ended. This would be our most accurate total for the week.
Here is how to do this:
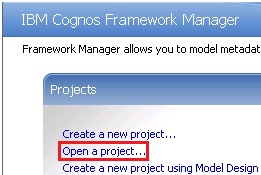
- Launch IBM Cognos Framework Manager and open your DW model project (out of the box, it is named “Rational Insight Reporting Data Model (DW)”)
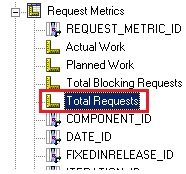
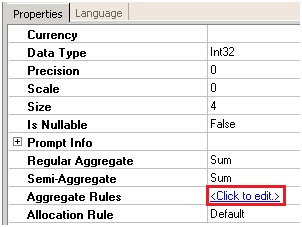
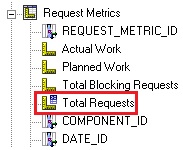
- Once the framework model is open, navigate to “Dimensions > fact > Request Metrics” and highlight the “Total Requests” measure
- In the Properties pane, locate “Aggregate Rules” and click on “Click to edit”
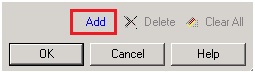
- Create an Aggregate Rule
- Add the “Date” dimension here by clicking on the “Add” link
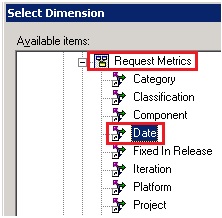
- Navigate to “Business View > Change Management > Request Metrics”, select the “Date” dimension shortcut, and click “Ok”
- Now specify the Aggregation Rule “Last” (this will return the last total of requests for this measure based on the level in the dimension) – Click on the ellipsis icon and select “Last”
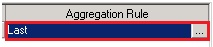
- Verify that your Aggregation Rule window now looks like this:
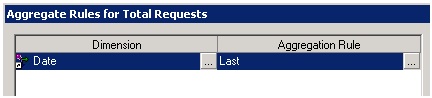
- Click “Ok” to apply these changes and close the window
- Add the “Date” dimension here by clicking on the “Add” link
- Now you will notice the icon for the “Total Requests” measure changes and looks like this:
- Save your Project and republish your package
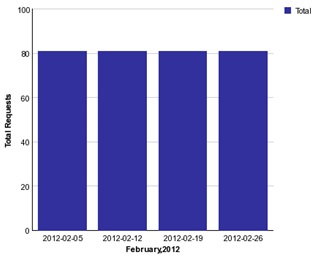
- Now, you can go back to Report Studio and launch your “Total Workitems Trend” report using the updated package and view your results. The “Week” view now reports correctly, showing a total of 81 workitems for each week in February.
Summary
In this exercise, we customized the Rational Insight framework model, using Framework Manager, to define an aggregate rule for a semi-additive measure (“Total Requests”). The metrics team is now able to view an accurate trend of the total number of workitems over time by all levels of the Date dimension: Day, Week, Month, Quarter and Year.
Note: This solution may not be appropriate in all situations. For example:
- If user is not running daily ETLs, then the last day of the week may result in empty data
- At a higher level of the Date dimension, like ‘Quarter’ or ‘Year’, more common cases would be to use the ‘Average’ aggregation instead of the ‘Last’
For further reference on Aggregation in Reporting, see IBM Cognos Documentation.
Copyright © 2012 IBM Corporation