Comparing Apache Traffic Server and Squid Performances
The purpose of this article is to provide an overview of the performance tests we performed using Squid and Apache Traffic Server (ATS) with the IBM Engineering Lifecycle Management (ELM) platform.
What are Squid and ATS?
Squid and Apache Traffic Server are both cache servers. Their role is to improve network performance by caching frequently- accessed data, particularly at the edge of the network. They are particularly used to bring the content physically closer to end users from remote locations.
Test environment
This section provides an overview of the environment that was used for the performance testing, including the test topology, the testing scenarios and the size of the data used for testing.
Test Topology
Figure 1 provides an overview of the topology that was used for the comparison performance testing. All machines in our topology are Linux virtual machines.
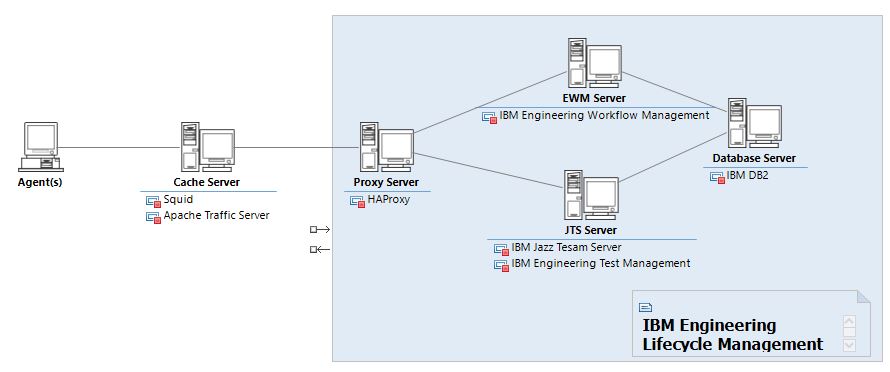
The first element in the topology are the Agents. We are using a maximum of 5 agents and all of them have the same content, the only differences are in the configuration files. To create the load and measure the response times we use a set of Java scripts that are leveraging the Engineering Workflow Management rich client API to communicate with the EWM server through the Cache Server.
The Cache Server is the machine hosting Apache Traffic Server (ATS) and Squid. They are are both installed in the same machine to try to reduce as much as possible external factors in the comparison, but we only run one at a time. ATS and Squid are used to cache EWM data, but they are accessing EWM through the Proxy Server, to mimic the most common ELM deployment topology. As the purpose of the test is to compare the performance of both cache servers once the data has been cached, the cache size has been configured to be able to contain all the data that would be exchanged between the the Agents and EWM.
- The Proxy Server that only contains an HAProxy docker container, set up as a reverse-proxy to access the applications in the our ELM deployment .
- The JTS Server, which, apart from the Jazz Team Server (JTS), also contains IBM Engineering Test Management (ETM).
- The EWM Server that hosts the IBM Engineering Workflow Management (EWM).
- The DB Server that contains a DB2 docker container that would run our applications databases
Test Configuration
The main goal of the test is to compare the performance of Squid and ATS under normal usage, that means after the data is cached in the cache server. To ensure the data requests by the test scripts is as stable as possible, the idea is to load a given workspace. So, that we only have ensure all the data pertaining to this workspace is in the cache before starting the performance test.
This is what lead us to use as our first scenario the load and unload of a given workspace, and we repeat that 2 times to get more data points. So each user would perform this same scenario, meaning that the only difference between the different runs would be the number or simultaneous users. Running this test with 25, 50 and 100 simultaneous users would tell us how well each cache server is able to handle the load. To make it meaningful enough, the workspace we pick has one component and a size of about 12 GB.
These runs provide us a perspective on how our cache server handles the load as the simultaneous users increase. However, to complete this perspective we wanted also to evaluate the behavior of the cache servers when we increase the number of workspaces. That is why we also run a test, with 100 simultaneous users, to compare the performance of the cache server when, instead of loading a unique workspace, each user picks one of ten different workspace.As we multiply the number of cached workspace by 10 we have to reduce the size of the workspace, from 12GB to 6.5GB, to avoid running out of space in the cache server.
Test results
This section describes the results from our 2 tests, the one with a unique workspace and the one with the ten different workspace.
Loading a Unique Workspace
The first scenario we tested was to have all users load and unload two times the same workspace. The figure 2 shows a comparison of the responses times observed when using 25, 50 and 100 simultaneous users. As shown, even for 25 simultaneous users the response time for Squid are more than three times slower than the one for ATS. And as the number of simultaneous users increase, this difference increases. Squid response time increase exponentially while the ATS ones seem to only increase linearly. So it seems that the ATS is able to better handle this load than Squid.

Figure 2 – ATS and Squid Response Time Comparison for one Workspace
The difference in the response times can be explained by the difference in throughput between ATS and Squid during this load as shown in figure 3. The throughput seems to peg at 256 requests per second for Squid, while is it about 720 requests per second for ATS. Nearly 3 times higher, like the response times were nearly 3 times faster for ATS than for Squid.

Figure 3 – ATS vs Squid Throughput Comparison
So, it seems that when loading the same workspace, ATS performance and throughput are better than Squid ones. But what happens if we vary the data? That’s why we decided to perform tests using ten workspace instead of one, and the results are described in the next section
Loading Ten Different Workspaces
To evaluate the impact we run some tests using one hundred simultaneous users, but this time instead of having the users all load the same workspace, they are alternating between ten different workspaces. As shown in figure 4, both cache server see a similar increase in their response time. This still keeps ATS performance better than Squid.
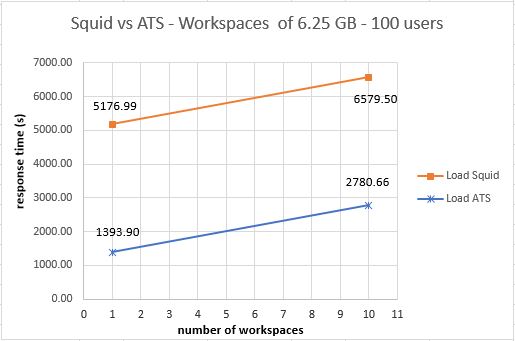
Figure 4 – ATS and Squid Response Time Comparison for 10 Workspaces
Similarly, in figure 5 we can see a drop in the throughput when going from one to ten different workspaces. The drop seems more important for ATS (from 737 requests/s to 420 requests/s) than Squid (from 248 requests/s to 186), but that still makes ATS twice as fast as Squid. The difference in the importance of the drop could be explained by the way both cache servers manage their RAM cache. Squid put as many objects as possible in the RAM cache, while ATS only put the most frequent requested objects in the RAM cache. Said otherwise, unlike Squid, ATS Ram cache efficiency would be built overtime.
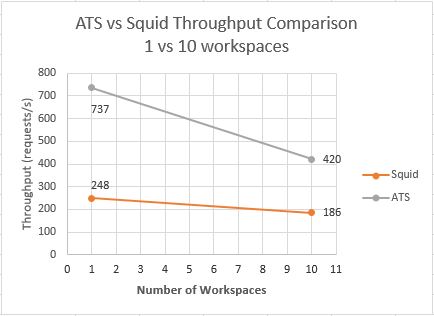
Figure 5 – ATS vs Squid Throughput Comparison
Conclusion
Based on the results from our tests, we can conclude that for loading and unloading EWM workspaces, Apache Traffic Server is about three times faster than Squid.
For more information
- ATS 7.1.4 User Manual (Apache Traffic Server 7.1.4 documentation)
- Squid Wiki (Squid documentation)
About the author
Celso Gonzalez is a Principal Product Architect in the Jazz Foundation development group in Persistent Systems. During his 24 yeas of experience in software engineering he touched to the different aspects and roles of the Software Development Life Cycle. Celso led the investigation on ATS and Squid performances.
© Copyright IBM Corporation 2019