Technology preview: Lifecycle Query Engine with property graph technology
Jazz Reporting Service Team
Last updated: 14 June 2018
Build basis: Jazz Reporting Service 6.0.6
Overview
You can now try a technology preview of Lifecycle Query Engine (LQE) in a test environment. This LQE preview uses JanusGraph property graph technology to offer scalability for a growing data and user base.
Until now, LQE used a triple-store database for lifecycle data. Each artifact had a Resource Description Framework representation with three parts (RDF triple): subject, predicate, and object.
A property graph models data in a different way. Lifecycle artifacts are represented as vertices, and links between them are edges. The vertex is the fundamental unit of the graph and is described by properties. An edge is a connection between two vertices that expresses a relationship between them. An edge has multiplicity and direction.
A triple-store database uses the SPARQL language to query data and return results. The property graph uses the Gremlin query language.
In this technology preview, data from a tracked resource set (TRS feed) is indexed in a property graph and Report Builder generates Gremlin queries and returns results from LQE.
Get started
Before you enable the technology preview, ensure that you are using ensure that you are using IBM Java Version 8, Service Refresh 5 or later.- Download the product from the All Downloads page, and start the installation.
- When you select the Jazz Reporting Service components to install, ensure that you include Apache Cassandra and Elasticsearch.
Jazz Reporting Service components in IBM Installation Manager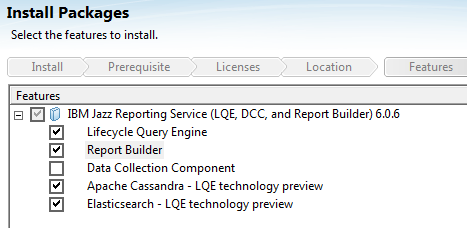
- Set up the Apache Cassandra back-end database.
Windows
a. Set theJAVA_HOMEenvironment variable toJazz_install_dir/server/jre.
b. RunJazz_install_dir/Cassandra/bin/cassandra.batto start Apache Cassandra.
Linux
a. Run thechmod +x file_namescommand to assign execution permissions to the following files:
Jazz_install_dir/Cassandra/bin/cassandra
Jazz_install_dir/Cassandra/bin/nodetool
b. Set theJAVA_HOMEenvironment variable toJazz_install_dir/server/jre.
c. RunJazz_install_dir/Cassandra/bin/cassandrato start Apache Cassandra. - Set up LQE with a WebSphere Liberty server.
- Enable the technology preview:
a. Log in as an administrator and go to the LQE technology preview activation page:https://host_name:port/lqe/web/pgs/act
b. Read the license and, if you agree to its terms, click Activate. When you activate the technology preview, LQE starts to process the TRS data in a property graph that is stored in a NoSQL database. JanusGraph is the property graph technology, and Apache Cassandra is the NoSQL database.
c. On the Property Graph Settings page, configure the property graph connection, caching, storage, and full-text search options.
You might want to focus only on the property graph solution. You must pause the indexing for the original triple-store database. On the LQE administration page, click LQE Nodes, click the node name, and clear the check box beside TRS Processing for Triplestore.
Pausing the indexing for the triple-store database
- To monitor the indexing status, go to the Health Monitoring section and check the Property Graph Indexing page.
- To see further node details and performance metrics, go to the Property Graph Details page.
- Configure Report Builder to use the new data source. Go to the Report Builder administration page and click Connect to data sources to add LQE Property Graph – Preview.
- Use the new data source to create your reports. Go to
https://server_name:port/rsand click Build. Select the report type and choose LQE Property Graph – Preview as the data source. - To try the technology preview, create this report:
a. Select QM Test Case.
b. Add a relationship to Requirements. Choose the Validates Requirement relationship.
c. Go to the Format Results page and click the Advanced section. Notice that the generated query uses the Gremlin query language.
d. Run the report. - Check the health of the LQE node:
a. Go tohttps://server:port/lqe/web/health/overview.
b. Go to the Property Graph Query section.
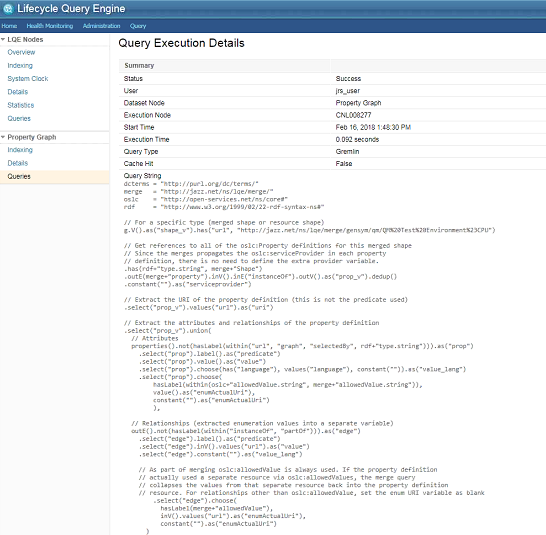
c. In the list of completed queries, click the More details link in the Actions column. You’ll see the query execution details.
Property graph query details
Limitations
LQE
- You cannot back up or restore LQE or the Apache Cassandra database.
Report Builder
- You cannot use this technology preview with Rational Engineering Lifecycle Manager.
- Historical metric reports and queries are not supported.
- Custom attributes are not supported.
- Calculation-based reports are not supported.
- Configuration management and access contexts are not supported.
- Report Builder refreshes might be slow.
- Queries that use counting can be very slow.
More information
© Copyright IBM Corporation 2018