Reporting with a purpose
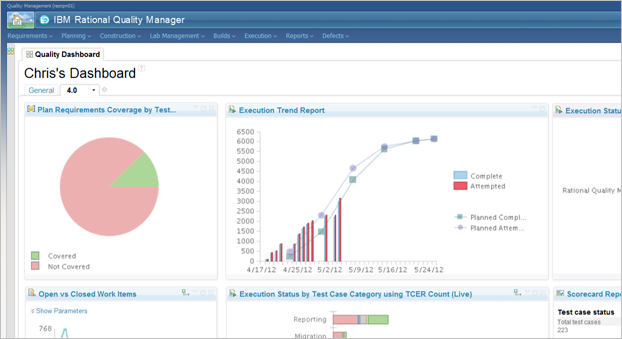
Always have a real-time accurate status without having to ping each and every team members. Dashboard provides an at-a-glance view of test artifacts, work item queries, event feeds, reports, and other items that are critical to understanding your progress. Reports provide both real-time views and historical trends of test cases, test executions, defects, and other artifacts that your team works with.
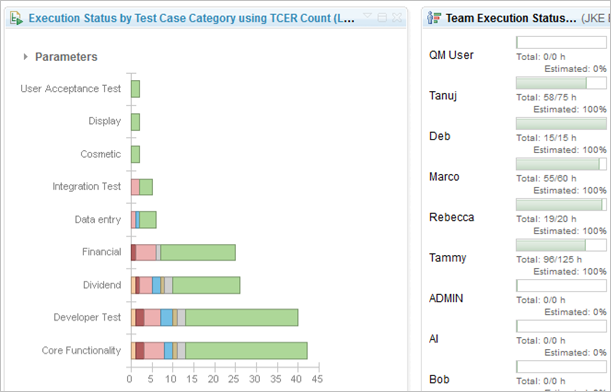
Take informed decisions with to real-time data
Rational Quality Manager comes with a set of predefined dashboard widgets and reports to help track test plan and execution progress in real-time throughout the testing cycles. Quickly identify weak or problematic areas that need your immediate action before it is too late to mitigate those risks.
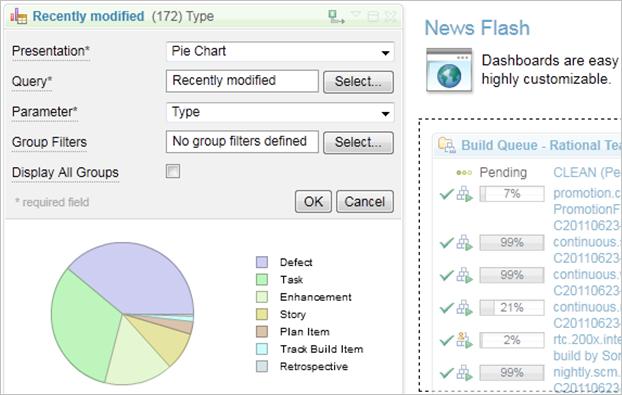
Highly customizable
Dashboards are easy to create and update, and are highly customizable. You can add or remove any viewlet, drag and drop to move them around, organize them under different tabs, and configure each one to show exactly what you want. The appearance of each viewlet is also customizable. You can change titles, trim colors, and even make them trim-less so they stand out.
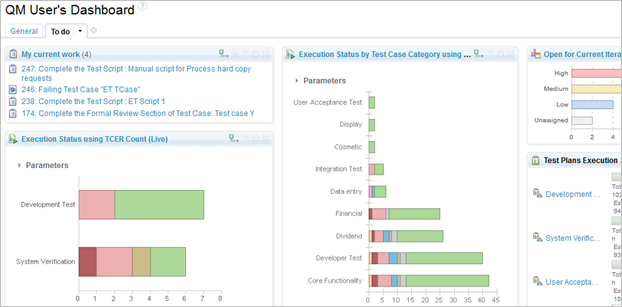
Project and personal dashboards
Dashboards provide a great starting point or portal for any project or team by combining and condensing various types of useful information in one place. Keep track of your project’s overall health. See useful team information, links, announcements, and activity by visiting your team dashboard. Dashboards have a low barrier of entry. All you need is a browser. Users can create, configure, and share one or more Personal Dashboards to track project, team, and contributor information.